Identifying Winners In The Business Of Gold


Gold mining is a tough business. It has been said that more people became wealthy during the California Gold Rush of 1848-49 by setting up supply shops and hotels to serve prospectors than by actually mining for gold. Indeed in the modern era, there are over a thousand companies involved in the production and exploration of gold ore throughout the world -- yet a significant percentage will wind up bankrupt, either unable to find sufficient gold in the first place or even more frustrating, unable to bring their known gold to the surface for a profit.
So why bother with the gold mining business at all? Because for those few who do succeed in this business, the gains can be phenomenal. Companies that find a significant deposit of gold and then successfully mine it can see gains in excess of 1,000% over the course of a few years.
In our previous article covering the sector, we made the case that from a technical standpoint, the gold mining industry is approaching a significant long-term bottom from a valuation standpoint much lower than even the 2008 lows. From this bottom we expect a tremendous revaluation will occur over the next decade.
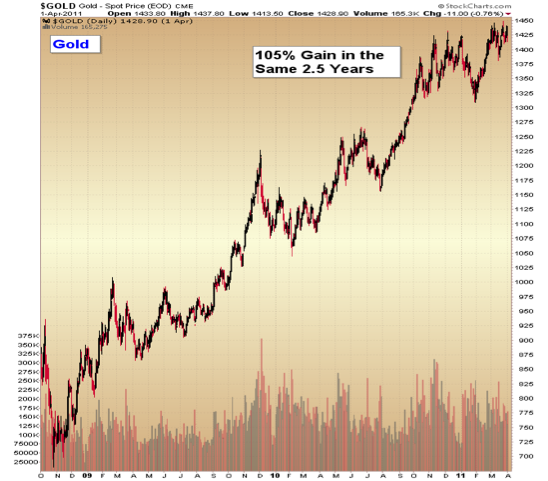
So let us consider an example from 2008 of a well-known large gold mining company, IAMGOLD Corp., which achieved successful increases in their gold production during this time period, as gold prices themselves steadily increased:
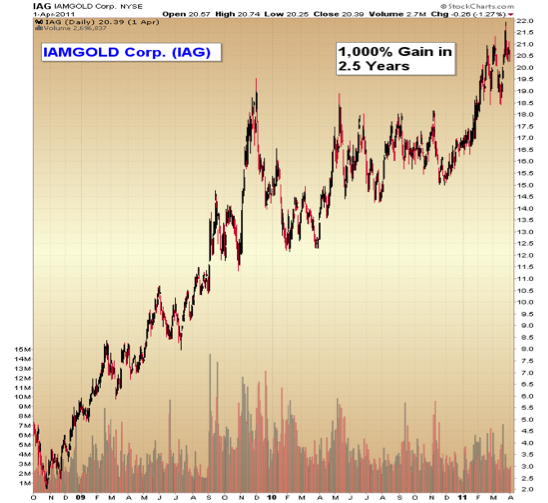
This is the type of performance one should look to achieve when investing in the right mining company at the right time in the gold cycle.
How this outperformance works can be illustrated with a simple example: say ABC Mining Co. owns a deposit of one million ounces of gold in the ground, and is able to mine every ounce for $800 per ounce. When they later sell that gold for $1,100 per ounce (near current prices), they will profit $300. Now suppose the price of gold increases to $1,400. Assuming the costs to mine stay relatively stable, ABC Mining Co. now sells each ounce for a $600 profit. So, we can see here that as the price of gold increased by 27% ($1,100 to $1,400) the profits and therefore share price of the company would have increased by 100%. Thus, an investor can achieve profits well in excess of the actual price of gold.
Of course, in the real world the mining industry is not this simple, and the same principle also works in reverse. A gold mining company can go bankrupt if the price of gold falls too far, whereas the metal itself will never be worthless.
The Two Keys to Successful Investing in the Gold Mining Sector
1) Invest in the mining sector only as gold prices are bottoming and/or rising. If you are reading this article, you are probably already familiar with our analysis in previous articles, where we outline in detail why gold prices are now bottoming, with the next surge in prices to come over the next several years.
2) Invest only in the top tier companies in the sector:
- those with significant deposits of gold
- in politically stable regions of the world
- which do not rob their shareholders with excess share dilution
- which are able to extract their ounces from the ground at a cost that still leaves a healthy profit margin
- and which are able to increase production year over year
Separating the Wheat from the Chaff
How does an individual investor go about finding these select few companies that can provide exceptional profits on the next leg up in the gold price, leveraging their percentage gains to the price of gold, while staying away from the pitfalls that can plague the majority of mining companies? There are dozens of metrics that the financial industry uses to evaluate companies, and even more so that mining companies use to evaluate their mineralogy.
While these can all be useful guidelines, they are insufficient in an industry where there is so much potential for risk. For example, a mining company with perfectly good financials can have a problem with the development of a mine shaft that will not be revealed to a fundamental-based investor until after they have taken a significant loss. This is just one example of the multitude of problems these companies can face as they attempt to mine a deposit of gold.
The Technical Approach
After over a decade of experience in both the gold market and the broader financial markets, I have seen firsthand that the only approach that consistently works to separate the top-tier companies from the future bankruptcies is technical analysis. Technical analysis is the study and interpretation of a stock or commodity based on patterns in price movements. Patterns in price movements repeat throughout history, because human nature repeats throughout history, and prices represent the sum of all the people who are participating, either buying or selling, in a given market.
My study of technical analysis incorporates several disciplines: stage analysis, Japanese candlesticks, pattern analysis, and relative strength to name a few. Each market tends to have technical disciplines that are better suited to it. In the gold market, I find stage analysis and relative strength to be the two most important indicators for separating the future 1,000% gainers from the future total losses.
Stan Weinstein summarizes the technical approach best in his excellent book Secrets for Profiting in Bull and Bear Markets:
"The tape tells all. That's more than a cute slogan, it's a market philosophy that works. What it simply means is that all of the relevant information about a company's earnings, new products, management, and so forth--the fundamentals--that is currently known and cared about is already incorporated in the price of its stock. It isn't that I don't care about an important piece of fundamental news such as a pending takeover offer; rather I learned long ago that you and I aren't going to find out about that juicy news before it hits the broad tape--and by then it's too late.
Sure, we'll hear rumors, but for every 100 that you hear no more than one or two really pan out. That is not a way to rack up a winning percentage in the market. So accept the fact that unless you're willing to break the laws on insider trading, you aren't going to find out about that important piece of news ahead of time. And once you read the news in the paper, it's too late to act on it profitably. The remarkable thing is that when you learn how to properly interpret what's taking place on the tape--and on your chart--you'll often be buying or selling with the insiders."
Relative Strength
The relative strength of a stock is its performance in comparison to another asset, typically a related one. In the case of gold mining companies, the most useful type of relative strength analysis is to compare an individual company to a broader index of miners.
Relative strength is most useful when markets are approaching long-term tops or long-term bottoms. You would not be reading this if you were not aware that the gold market has undergone a brutal bear market over the last five years, yet if you've followed some of our other analysis on the price of gold, you'll know why we believe the gold market is in the process of putting in a significant long-term bottom and why the next up-leg is one that will see the price eventually exceed the previous all-time high, set in 2011 ($1,917/oz). If you're not in agreement with this analysis, that's okay -- but then I would encourage you to move onto another asset class. I only believe in investing in assets that one understands and agrees with.
Since I believe gold is bottoming, and that the mining companies are poised to offer returns that will be multiples of the price of gold over the next several years (as they have in the past), we should use relative strength analysis as a primary indicator to separate those companies that should outperform from those that will underperform. Keep in mind the old investing adage "a rising tide lifts all ships". This is to say the majority of mining companies will see significant returns during this next bull market, but the best ones will offer life-altering returns. Why not be invested in the ones poised to do best?
An Example of Relative Strength
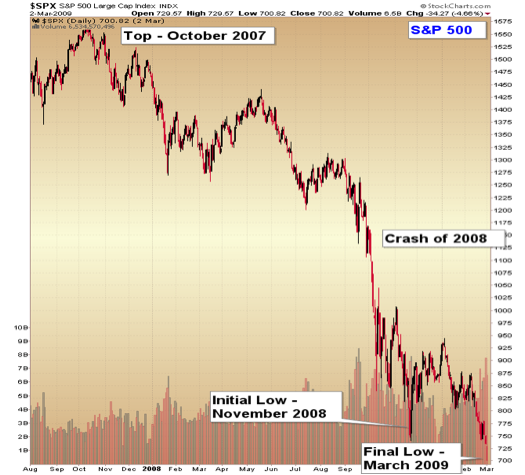
I am going to give one set of examples of relative strength put into use so that this will be more clear. The last significant bear market that most investors remember is the crash of 2008-2009. In this decline, the broad S&P 500 Index fell by over 57%, wiping out trillions of dollars in wealth. So that everyone is on the same page, the following chart shows this decline.
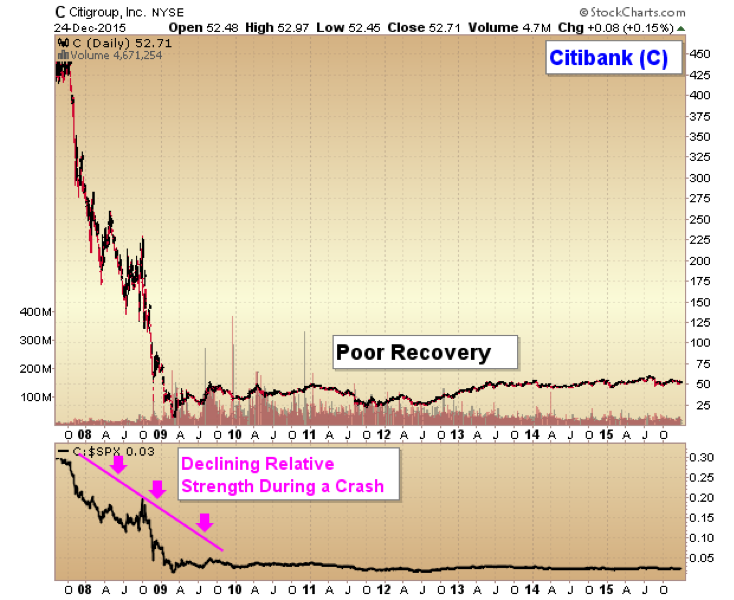
To illustrate relative strength, the next chart shows the stock of a large and well-known company, Citibank, over the exact same time period. Note how the price fell from 460 to under 20 in this same time period, a loss of over 95%. This was a true crash.
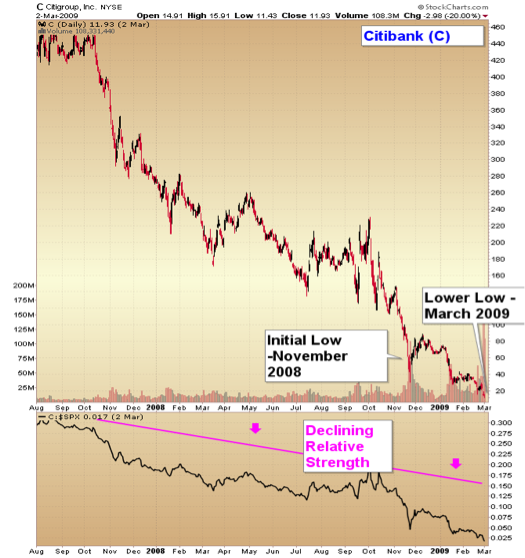
Note the declining relative strength line at the bottom, highlighted in bright pink. This shows the stock of Citibank relative to the price of the S&P 500. Notice that even though both the S&P 500 and Citibank declined from 2007-09, Citibank declined further in percentage terms.
Now let's look at the second example, Amazon, over the exact same time period:
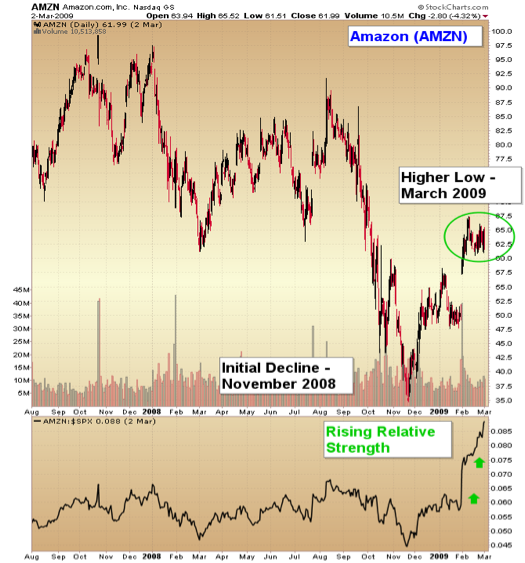
Clearly, Amazon stock also fell from 2007-09, getting caught in the stock market crash like everything else. Indeed, it's fall from over 97 to 35 per share represents a 64% drop. Yet--and this is the key--notice how it did not make a lower low in March 2009 than it did in November 2008, whereas Citibank and the S&P 500 did. This is significant positive relative strength, highlighted on the chart in bright green.
So a loss of 64% for Amazon compared to a loss of 95% for Citibank. Would it have been better to be in cash than to own either of these stocks? Yes, of course. And we hope you were in cash: no one should sit on a losing asset for too long.
Yet we can learn from the positive strength that Amazon showed compared to Citibank, relative to the final decline that happened between November 2008 and March 2009 in the broad S&P 500.
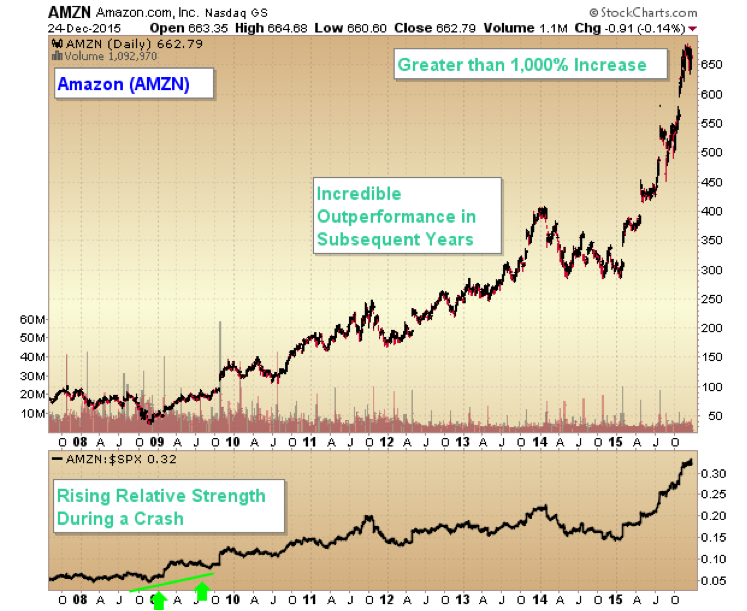
The difference in subsequent performance after a market decline for stocks showing high relative strength compared to stocks showing poor relative strength can be illustrated by extending the charts of Citibank and Amazon through the present:
Whereas Citibank has barely recovered from its 2009 lows, Amazon has risen over 1,000%.
Yet, both crashed from 2007-2009.
Which would you rather have owned for the last six years?
How can we spot the winners from the losers?
The Answer: Positive Relative Strength...During a Crash
The bottom line is relative strength analysis works. It can help spot the future winners from the continuous laggards. But the essential time to use it is when a market is forming a bottom. It is as the bottom is forming that we can most clearly see the relative strength divergence.
Why does it work? The fundamental explanation for why relative strength analysis works is that as the rest of the broad market is selling off, certain insiders (a.k.a. 'strong hands' or 'smart money') are refusing to sell their most prized stocks. Why? It could be any number of reasons. It could be that positive earnings will be coming out shortly. It could be that a new product will be announced soon. It could be a pending takeover offer. Yet, as Stan Weinstein explained (above), the fundamental reasons are impossible for us to know ahead of timeunless we are insiders.The majority of private investors will never have this knowledge. But that is okay, because ultimately the point is not to know what the cause of a move is -- the point is to make money. And we can make money by aligning ourselves with the insiders, by seeing their moves reflected in the price of the stock. Those moves appear most clearly as the price of the stock refuses to move down even as the rest of the market crashes.
Now jumping into Amazon at the current level is NOT advised. The easy gains have been made. Yet those who didn't recognize the relative strength of stocks like Amazon and who failed to hold on for gains of 1,000% have a new chance by turning their attention to the market now forming a significant bottom after a crash: gold and the gold miners.
In Part II of our series next week, we will focus on using this principle in action and reveal several companies within the gold mining sector that we expect will be big winners in the revaluation to come.
We monitor emerging trends in the precious metals markets in our free video updates
Read more articles by Christopher Aaron:
- Gold Miners - A Historic Revalutation Will Occur
- Gold Forecast: Final Low Targets For The Bear Market
- Gold Forecast: Multi-Decade Breakouts are Rare and Powerful
*****

Christopher Aaron began his career as an intelligence analyst for the CIA and Department of Defense. He served two tours to Afghanistan and Iraq between 2006 - 2009, conducting pattern-of-life mapping for military leaders.
Mapping shares similarities with technical analysis of the financial markets because both involve the interpretation of repeating patterns found in human nature. He is the founder of iGold Advisor, providing independent research and analytics on all aspects of the precious metals markets.
He speaks regularly on the cyclical patterns found within the financial markets and on international policy. He has been featured in the New York Times and NPR news amongst other financial publications.


