Just A Matter Of Time Now


 During the 1996-2000 bear market in gold, two mechanisms were used to force the price lower - the gold ‘carry trade’ using gold leased from central banks and, when the price showed strength, actual sales of gold by Great Britain and Switzerland. As the market bottomed and turned, the 2001-2011 bull market in gold experienced a rear guard action from bullion banks, making irregular very large raids on the price. Then, starting in 2011, massive sustained pressure was applied to gold and silver in the form of very frequent ‘waterfall’ raids. It seems that during the bull market, the bear raids could employ actual metal as needed, but after 2011 the raids were all of the paper variety. During recent months, this campaign has become more blatant; a sign of growing desperation. Perhaps this sign of increasing vulnerability has been noticed by predatory large players who now pursue prey in the PM markets? Do the hedge funds perhaps see potential for a short squeeze that can make them billions?
If this suspicion is correct, it is now just a matter of time.
Observers of the PM market surely have noticed that the markets no longer recover slowly and hesitantly after a waterfall raid has been executed; just as soon as the waterfall ends, prices rebound steeply as bargain hunting commences. The sellers do not have the time and opportunity to cover some of their shorts for profit; they have to sell more to keep the recovery in check. If correctly interpreted, growing open interest and open short interest for the commercials should provide proof.
Given the uncertain state of the debt-ridden global economy and less than positive economic news in the US, it is surprising that Wall Street seems bent on chasing an 18 000 level on the DJIA again. Over the past four years it has become a feature of the DJIA to have near miraculous recoveries late in the trading day. Recently this has become an almost daily occurrence – a sharp move higher on increased volume late in the day. The jump in volume shows concerted buying against sellers who are determined to close positions before the day ends. This is also a sign of desperation similar to what is seen in gold and silver and it may trigger a similar response from the large hedge funds.
Waiting to see whether the DJIA this week can chase the 18 000 level, attention is also on the widely watched dollar index; probably seen as more important than a single exchange rate, the dollar index is under pressure, but enjoys frequent rallies rather similar to what one sees on a day chart of the DJIA. The yield on the 10-year Treasury note is a third market that displays such volatile behaviour and if frequent efforts to keep it below the 2% level are also symptomatic of mounting desperation in certain quarters, the hedge funds could be having a field day quite soon.
When the anticipated trends will accelerate is pure guesswork; available evidence as proof of major tipping points is mounting, but it would be presumptuous to set a date for them to take full effect. The powers ranged to try and prevent or at least delay these events have the full weight of officialdom behind them. But just as with dead men walking, it is only a matter of time.
Euro-Dollar Chart
The rising trend of the euro, off support at the bottom of channel AD ($1.0636) is still well-contained in the new bull channel, KL (K $1.1794: L $1.1087). Resistance is waiting at line C ($1.1648). Line Y ($1.1246), intermittently acting as resistance and support as the euro has oscillated around it, may now be out of play since the euro has remained well clear of it for the past week.
The outlook remains bullish while channel KL holds, with a definite break above line C needed for greater confidence in the new bull.
olding above line N should reHH
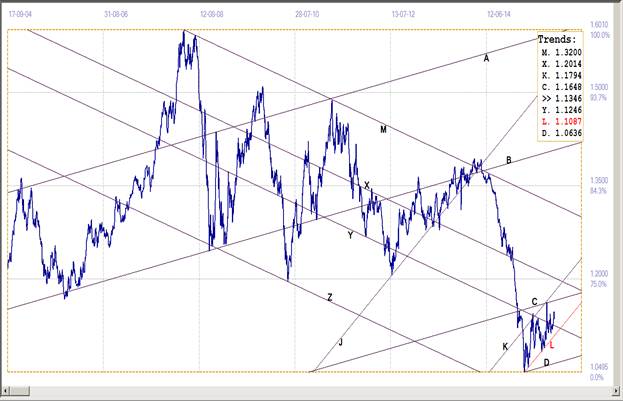
Euro-dollar, last = $1.1346 (www.investing.com)
Dow Jones Industrial Average (DJIA)
Following the high at 18312 on 19th May this year, the DJIA entered a volatile bear move that lasted for three months keeping line L (17046as support. On August 20th a decline of 360 points took the DJIA steeply below line L in the first day of a 4 day sell-off that cost the DJIA 1683 points (9.7%). A steep recovery took the index to near the resistance at line B (16568) where it settled in volatile fluctuation mode as it sought new direction.
A new weaker trend had the DJIA closing at 16002 two days before the end of the quarter, which clearly displeased many folks. Buyer support came into the market and the DJIA rallied straight up for 9 trading days to close just above line L on 12th October, back above the 17 000 level. Despite a brief setback, the DJIA has broken higher again, to end last week clear above this key support.
Wall Street has been and probably still remains the most closely watched indicator of US economic health, at least in domestic terms. Signs of increasing weakness in the US dollar, which is perhaps of greater significance for the financial community, makes Wall Street and the DJIA in particular the final measure of economic health. Thus it would not surprise to see further effort being expended to ensure the DJIA extends its recent trend, closer to 18 000 points.
Failure to achieve this, at any time soon, with a decline back into bear channel KL and also below support at line B (16568) should confirm a major bear trend.

Dow Jones Industrial Index, last = 17216 (money.cnn.com)
Gold PM fix - Dollars
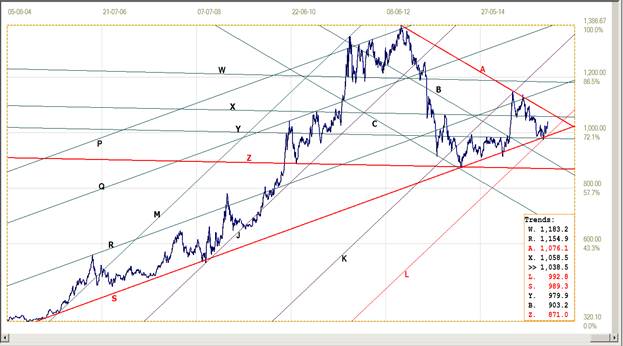
Recent new insights into the chart patterns were used to update a few of the charts used this week. The gold chart in particular appears far more exact than before. It now shows a far better fit of the large pennant GL ($1141), and with a clear break higher this week. Channel PQR has also been adjusted. As the price moved further right on the chart, the channel now has a ratio of 386:614, which is very close to the Fibonacci ratio of 382:618, which is typical of strong channels.
The break higher at the end of leg 5 of the pennant is taken as a sign the new bull market has started. While the price can still come under pressure, the support at line L and, if that should fail, also at line R ($1123) is expected to hold firm.

Gold price – London PM fix, last = $1180.85 (www.kitco.com)
Gold PM fix - Euro
The euro is still improving in fits and starts while it remains in its bull channel that is shown in the first chart of this report. It therefore still prevents the euro price of gold to obtain full benefit from the improving performance of the dollar price.
Despite the three marginal and brief breaks below line S (€989) over a period of 11 years, the fit of the large triangle SA (€1076) is very close. This confirms that the market for euro priced gold also displays accurate preferred gradients and patterns. The new reversal higher just off support at line S – and holding to bull channel JKL that has a ratio exactly equal to the Fibonacci ratio! – commenced leg 5 of triangle SA and, in terms of accepted pattern behaviour, it can be expected to break higher from the triangle to resume the long term bull market in gold.
The euro price of gold is lagging the dollar price when considering their respective major chart patterns. A possible explanation is that the large triangle on the euro chart has a longer history that covers a wider range of prices, while the fact that the euro and the gold price are expressed in dollars has a dampening effect on the euro price of gold.
Euro gold price – PM fix in Euro, last = €1038.5 (www.kitco.com)
Silver Daily Fix Chart
Silver daily fix, last = $16.04 (www.kitco.com)
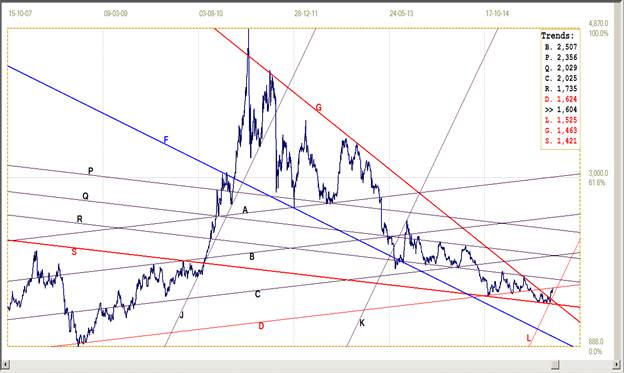
The silver chart also improved with a slightly changed analysis. Three major chart patterns can be identified: the large triangle GD and two pennants, GF and GS. The triangle GD ($16.24) was penetrated to the lower side during the late phase of the bear market and now acts as resistance to the new rally. Leg 4 of steep pennant GF completed in August 2013, with a firm start to leg 5. This was not allowed and the price of silver extended the bear market, finally settling into pennant GS.
The break below support along line D developed to complete leg 4 of pennant GS ($14.63,14.21), with the new bullish leg 5 being squeezed right into the apex of the pennant. The break higher at the end of leg 5 signals the real start of the new bull market – now needing a break above the extension of the bottom boundary of the old triangle GD at $16.24 to confirm the new trend. The next resistance is at line R ($17.35) and a break there should release the bull.
U.S. 10-year Treasury Note
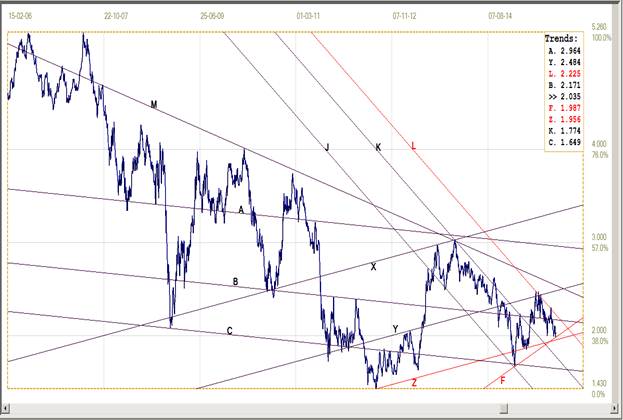
U.S. 10-year Treasury note, last = 2.035% (www.investing.com)
Another new analysis shows the yield now in a rising trend above line F (1.987%). It is still contained in the steep bull channel JKL (2.225%). There is still room for a sideways move near and just above the important 2% level before a break from the narrowing gap between support and resistance forces a new trend.
A lower yield on the 10-year note has distinct advantages to the powers that be: it lowers the mortgage rate, which is good for the housing market, counters a weaker US dollar from the perspective of foreign holders of US Treasuries and it presents a picture of the US financial system that many neutral observers could interpret as a positive sign. That fact that it devastates savers and retirees living of savings is not generally treated as a negative – except for those hoping to rely on their savings!
West Texas Intermediate crude. Daily close
The price spent quite some time sitting on support from line D ($45.05) in a tight sideways trend. During the pas two weeks the price kicked higher to remain in bull channel FG ($47.66). It is a steep channel and the slight weakness towards the end of last week coupled to the steepness of the channel has now resulted a break just below the channel.
This break could be a signal that the price of crude is not yet ready to turn bullish. A sideways to lower trend along and just above support along line D seems likely while the break lower holds. Should the market turn more negative, support along the bottom of bull channel ST ($40.53) could come into play. A clear and sustained break above resistance at line Y ($52.36) is needed before one could consider that a new bull trend for crude is under way.
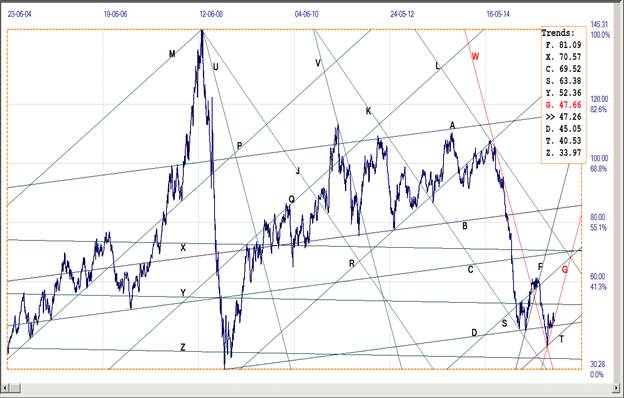
West Texas Intermediate – Daily close, last = $47.26
©2015 daan joubert, Rights Reserved chartsym (at) gmail(dot)com


