Key Elliot Wave Counts Update


S&P500

The extent of this rally eliminates our idea that this is likely a wave -iv- of (i) rally, which now opens up the possibility that wave (i) ended at 2039.69, and the current rally is all or most of a wave (ii).
Some projections, from the 2119.59, wave B top are:
50% = 2079.64;
61.8% = 2089.07.
Our current high is 2080.99. If wave (i) ended at 2039.69, we likely have a completed the following correction:
-a- = 2066.41;
-b-= 2041.07;
-c- = 2080.99 if complete. Note that -c-=1.618.a.= 2084.30.
We will update our 10 Min Chart and attach it to next Morning Post.
Here’s a look at it now:

A shorting opportunity is likely at hand again, at the end of wave (ii).
USDX
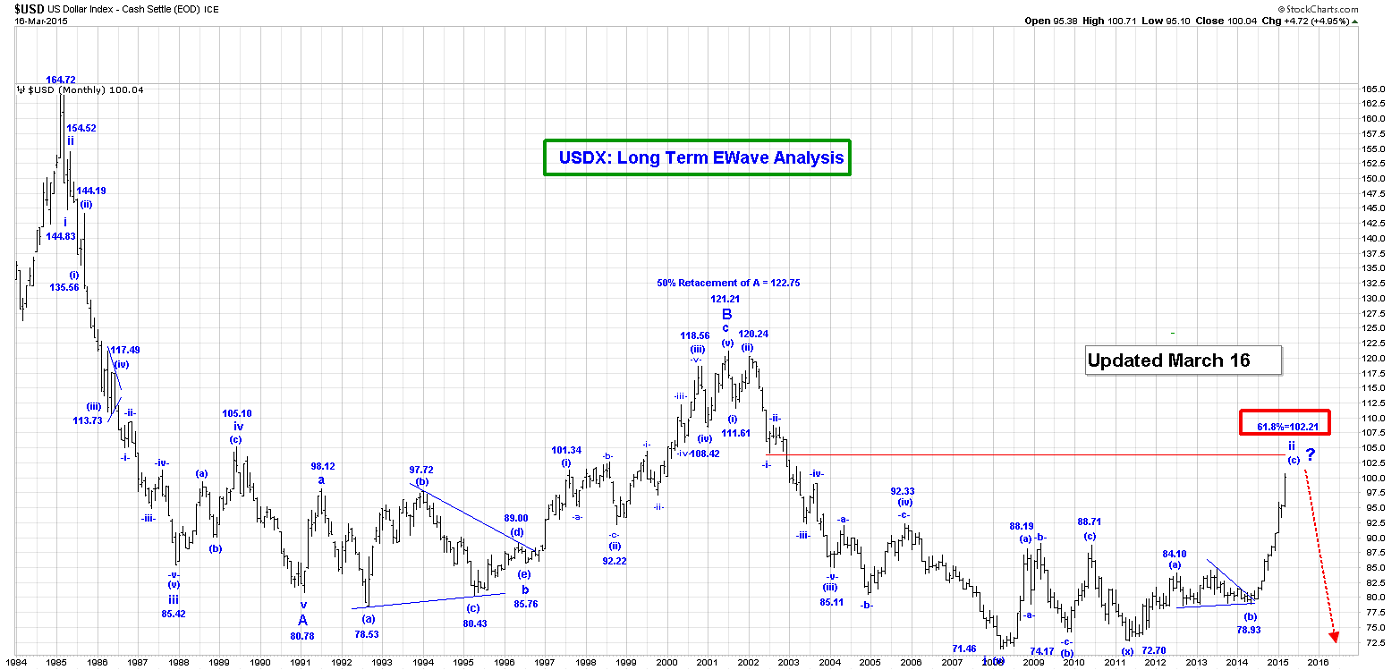
The USDX was lower in today’s day session, but, unfortunately, it looks like the drop from the overnight high of 100.67 was not impulsive.
We expect the USDX to rally back to the 100.67 high….. one or more times. Here’s a look at the daily chart that could produce at a double top in the 100 – 103 area:

NEWMONT

Some gold stocks have made serious attempts to launch C wave surges, and that include behemoth Newmont! We need to see more stocks make similar move, and that would indicate the entire sector, and gold, is ready to launch the C wave advance!
CLAUDE RESOURCES
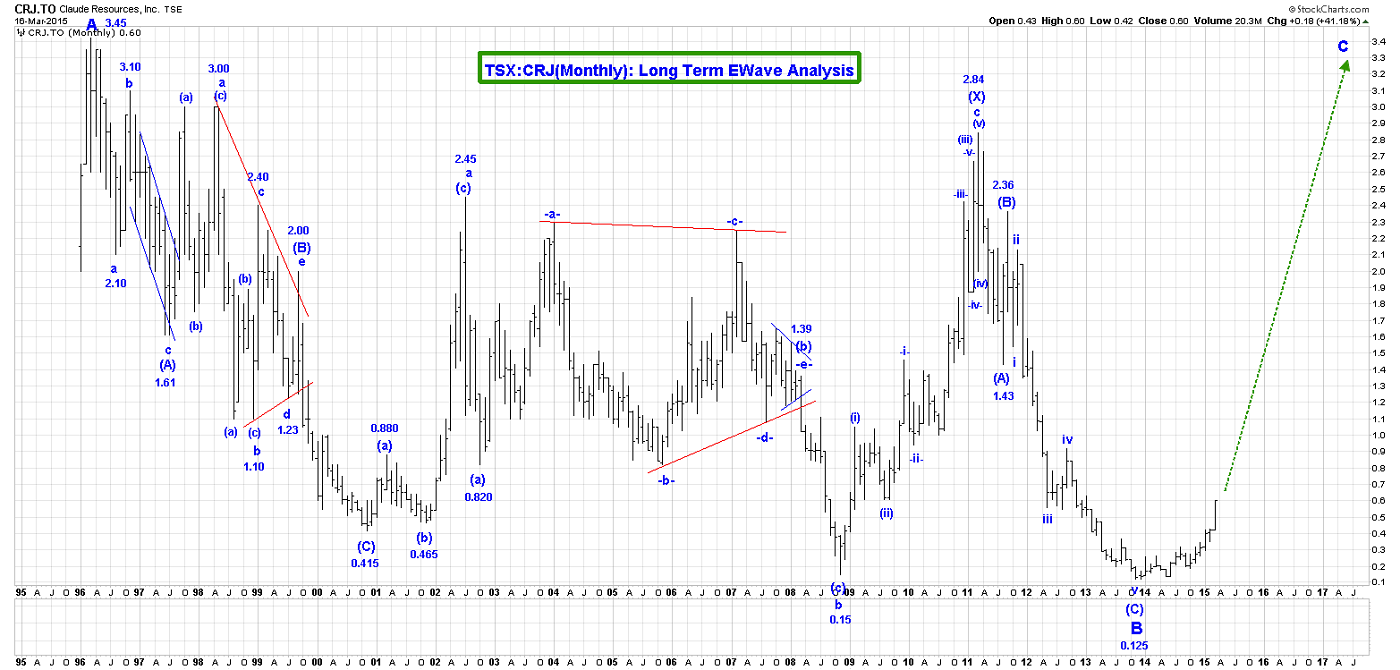
Here’s a look at one of the gold stock sector leaders, Claude Resources. We bought it in late 2014, expecting a dramatic C wave advance to begin, and ultimately lead gold bullion higher.
We’ve stepped to the sidelines for now, from a trading perspective, but are eyeing much higher prices, both for Claude and for gold!
GDX

We know it’s disappointing that GDX could make a new low, after the next rally, but regardless of what Elliot Wave analysis you apply, the low for gold stocks, and GDX in particular, appears to be very near, and if Claude and Newmont are correct…. It’s already here!
Gold

Gold moved lower in today’s day session reaching 1149.60, at the time that this Post was being written.
We do not see any indication that wave (b) is complete at these levels and we are still expecting one more drop below the 1146.60 low, to complete all of wave (b) of b of our wave 4 triangle. Our trading strategy remains unchanged.
Recommendation: Buy 5 COMEX gold 100oz contracts at 1141.60 and buy 5 x 1150 puts as stops.
(We always trade the near-term contract, but if close to expiry, can go out to the next one, June in this case)
Up until this week, we had been working on the assumption that wave i of 3 of V had ended at 1923.70, and that we were falling in wave ii of 3 of V. We had also thought that wave ii had ended at 1130.40.
Based on the weakness in gold, we had also considered the possibility that all of wave V had ended at 1923.70 and that we were falling in a very long term ABC pattern. We had even suggested drops in gold to the 750, or 350 area.
This option is valid and remains in our minds, but we think now that something more bullish is happening.
As you see on the attached Long term Gold Chart of wave V, we are now thinking that only wave 3 of V ended at 1923.70.
Our problem with saying that all of wave V ended at 1923.70, is that we do not see a clear five wave advance from the end of wave IV of 254.80.
Since it appears the rally from our previous wave ii low of 1130.40, is not impulsive, it can only be a triangle in this position.
Triangles on their own can only appear in a wave 4 position. Triangles consist of a single or multiple three wave patterns. As you see on the attached chart, we have graphically shown a possible series of three patterns that form wave b of our wave 4 triangle.
If our thinking is correct, then gold should rally, but it will be messy.
So how could this bullish scenario go bust? Well, we must stay above the wave 1 high of 1033.90, and we likely need to stay above the 1130.40 low also.
If wave a of our wave 4 triangle ended at 1130.40, then we have already started higher in wave b, in our first (a), (b), (c) pattern as follows:
(a) = 1307.80,
(b) = 1146.50, if complete,
(c) rally to go.
So if for argument’s sake, wave (b) ended at 1141.00, then some projections for the end of wave (c) are:
(c) = (a) = 1318.40;
(c) = 1.618(a) = 1428.00.
That is why we are planning to go long! We are watching our key lead indicator stocks like TSX:CRJ (you’ll see Ewave analysis on that as you read this report)… and they is telling us that gold is going… higher!
********
Email: [email protected]
Website: www.captainewave.com
Risk: CAPTAINEWAVE.COM IS AN IMPERSONAL ADVISORY SERVICE. AND THEREFORE, NO CONSIDERATION CAN OR IS MADE TOWARD YOUR FINANCIAL CIRCUMSTANCES. ALL MATERIAL PRESENTED WITHIN CAPTAINEWAVE.COM IS NOT TO BE REGARDED AS INVESTMENT ADVICE, BUT FOR GENERAL INFORMATIONAL PURPOSES ONLY. TRADING STOCKS DOES INVOLVE RISK, SO CAUTION MUST ALWAYS BE UTILIZED. WE CANNOT GUARANTEE PROFITS OR FREEDOM FROM LOSS. YOU ASSUME THE ENTIRE COST AND RISK OF ANY TRADING YOU CHOOSE TO UNDERTAKE. YOU ALSO AGREE TO BEAR COMPLETE RESPONSIBILITY FOR YOUR INVESTMENT RESEARCH AND DECISIONS AND ACKNOWLEDGE THAT CAPTAINEWAVE.COM HAS NOT AND WILL NOT MAKE ANY SPECIFIC RECOMMENDATIONS OR GIVE ADVICE TO YOU OR ANY OF ITS CLIENTS UPON WHICH THEY SHOULD RELY. CAPTAINEWAVE.COM SUGGESTS THAT THE CLIENT/MEMBER TEST ALL INFORMATION AND TRADING METHODOLOGIES PROVIDED AT OUR SITE THROUGH PAPER TRADING OR SOME OTHER FORM OF TESTING. CAPTAINEWAVE.COM, ITS OWNERS, OR ITS REPRESENTATIVES ARE NOT REGISTERED AS SECURITIES BROKER-DEALERS OR INVESTMENT ADVISORS EITHER WITH THE U.S. SECURITIES AND EXCHANGE COMMISSION OR WITH ANY STATE SECURITIES REGULATORY AUTHORITY. WE RECOMMEND CONSULTING WITH A REGISTERED INVESTMENT ADVISOR, BROKER-DEALER, AND/OR FINANCIAL ADVISOR. IF YOU CHOOSE TO INVEST WITH OR WITHOUT SEEKING ADVICE FROM SUCH AN ADVISOR OR ENTITY, THEN ANY CONSEQUENCES RESULTING FROM YOUR INVESTMENTS ARE YOUR SOLE RESPONSIBILITY.
ALL INFORMATION POSTED IS BELIEVED TO COME FROM RELIABLE SOURCES. CAPTAINEWAVE.COM DOES NOT WARRANT THE ACCURACY, CORRECTNESS, OR COMPLETENESS OF INFORMATION AVAILABLE FROM ITS SERVICE AND THEREFORE WILL NOT BE LIABLE FOR ANY LOSS INCURRED. DUE TO THE ELECTRONIC NATURE OF THE INTERNET, THE CAPTAINEWAVE.COM WEBSITE, ITS E-MAIL & DISTRIBUTION SERVICES AND ANY OTHER SUCH "ALERTS" COULD FAIL AT ANY GIVEN TIME. CAPTAINEWAVE.COM WILL NOT BE RESPONSIBLE FOR UNAVAILABILITY OF USE OF ITS WEBSITE, NOR UNDELIVERED E-MAILS, OR "ALERTS" DUE TO INTERNET BANDWIDTH PROBLEMS, EQUIPMENT FAILURE, OR ACTS OF GOD. CAPTAINEWAVE.COM DOES NOT WARRANT THAT THE TRANSMISSION OF E-MAILS, OR ANY "ALERT" WILL BE UNINTERRUPTED OR ERROR-FREE. CAPTAINEWAVE.COM WILL NOT BE LIABLE FOR THE ACTS OR OMISSIONS OF ANY THIRD PARTY WITH REGARDS TO CAPTAINEWAVE.COM DELAY OR NON-DELIVERY OF THE CAPTAINEWAVE.COM NIGHTLY EMAILS OR "ALERTS". FURTHER, WE DO NOT RECEIVE ANY FORM OF PAYMENT OR OTHER COMPENSATION FOR PUBLISHING INFORMATION, NEWS, RESEARCH OR ANY OTHER MATERIAL CONCERNING ANY SECURITIES ON OUR SITE OR PUBLISH ANY INFORMATION ON OUR SITE THAT IS INTENDED TO AFFECT OR INFLUENCE THE VALUE OF SECURITIES.
THERE IS NO GUARANTEE PAST PERFORMANCE WILL BE INDICATIVE OF FUTURE RESULTS. NO ASSURANCE CAN BE GIVEN THAT THE RECOMMENDATIONS OF CAPTAINEWAVE.COM WILL BE PROFITABLE OR WILL NOT BE SUBJECT TO LOSSES. ALL CLIENTS SHOULD UNDERSTAND THAT THE RESULTS OF A PARTICULAR PERIOD WILL NOT NECESSARILY BE INDICATIVE OF RESULTS IN FUTURE PERIODS. THE RESULTS LISTED AT THIS WEBSITE ARE BASED ON HYPOTHETICAL TRADES. PLAINLY SPEAKING, THESE TRADES WERE NOT ACTUALLY EXECUTED. HYPOTHETICAL OR SIMULATED PERFORMANCE RESULTS HAVE CERTAIN INHERENT LIMITATIONS. UNLIKE AN ACTUAL PERFORMANCE RECORD, SIMULATED TRADES DO NOT REPRESENT ACTUAL TRADING. ALSO, SINCE THE TRADES HAVE NOT ACTUALLY BEEN EXECUTED, THE RESULTS MAY HAVE OVER OR UNDER COMPENSATED FOR THE IMPACT, IF ANY, OF CERTAIN MARKET FACTORS SUCH AS LACK OF LIQUIDITY. YOU MAY HAVE DONE BETTER OR WORSE THAN THE RESULTS PORTRAYED. NO REPRESENTATION IS BEING MADE THAT ANY ACCOUNT WILL OR IS LIKELY TO ACHIEVE PROFITS OR LOSSES SIMILAR TO THOSE SHOWN. NO INDEPENDENT PARTY HAS AUDITED THE HYPOTHETICAL PERFORMANCE CONTAINED AT THIS WEBSITE, NOR HAS ANY INDEPENDENT PARTY UNDERTAKEN TO CONFIRM THAT THEY REFLECT THE TRADING METHOD UNDER THE ASSUMPTIONS OR CONDITIONS SPECIFIED HEREAFTER. WHILE THE RESULTS PRESENTED AT THIS WEBSITE ARE BASED UPON CERTAIN ASSUMPTIONS BELIEVED TO REFLECT ACTUAL TRADING CONDITIONS, THESE ASSUMPTIONS MAY NOT INCLUDE ALL VARIABLES THAT WILL AFFECT, OR HAVE IN THE PAST AFFECTED, THE EXECUTION OF TRADES INDICATED BY CAPTAINEWAVE.COM. THE HYPOTHETICAL RESULTS ON THIS WEBSITE ARE BASED ON THE ASSUMPTION THAT THE CLIENT BUY AND SELLS THE POSITIONS AT THE OPEN PRICE OF THE STOCK. THE SIMULATION ASSUMES PURCHASE AND SALE PRICES BELIEVED TO BE ATTAINABLE. IN ACTUAL TRADING, PRICES RECEIVED MAY OR MAY NOT BE THE SAME AS THE ASSUMED ORDER PRICES.


