Major Market Turning Points


SPX: Long-term trend - Bull Market
Intermediate trend – SPX has started an intermediate correction
Analysis of the short-term trend is done on a daily basis with the help of hourly charts. It is an important adjunct to the analysis of daily and weekly charts which discusses the course of longer market trends.
DUE FOR A BREATHER
(BUT MORE TO GO)
Market Overview
Last week, the dam which had held back a price decline for many weeks, finally broke! That should put an end to the discussion about whether this is just a long-term consolidation, or an intermediate top.
There is nothing unusual about the market’s behavior over the past few months. A period of distribution must occur which will be important enough to produce a decline proportional to the current structure (in this case most likely a primary wave IV). This requires many reversals in the 3X P&F chart and when the appropriate amount has been met, a decline begins which will fit in the needed structural pattern.
The water behind a dam is actually a good analogy because by measuring the amount of water which has accumulated, we can estimate how much of a decline we must have before the supply is exhausted. In this case, we are just starting to empty the first reservoir and by the time it is completely drained, the SPX should be in the vicinity of the October low. There is a second reservoir of about the same capacity which is also available in case it is required by the structure. We’ll have to see whether or not it is needed. If so, it would approximately double the size of the first decline.
If you think this sounds extreme, consider this! One of the first things that an analyst learns is that a correction is normally between .382 and .618 of the preceding advance. This advance (primary wave III) started at 1075 in October 2011 and ended at 2135 on 5/20/15. That’s a total of 1060 points! A normal correction would be between 405 and 655 points. If we retrace to about 1820, that would be 315 points for the first phase. Double that and you get 630 points, which is right in the ball park.
These numbers are based on the amount of distribution which took place between the market top and 8/18, when the decline started in earnest. Let’s see if what takes place is anywhere close to these calculations!
Indicators Survey
The weekly MACD waited for the sell signal to go negative, which it did last week.
The daily MACD made its lowest low since Last October’s low which was at about -30. As of Friday, we were only at -14.84.
(The NYSI is Courtesy of MarketCharts.com) Last week’s comment: “There is nothing here to suggest that we are about to see some sustained market strength over the near term.”
The drop has been sudden and, although the index has turned down, there has not been enough time for the A/D action to be fully reflected in the NYSI. Let’s see what it looks like next week.
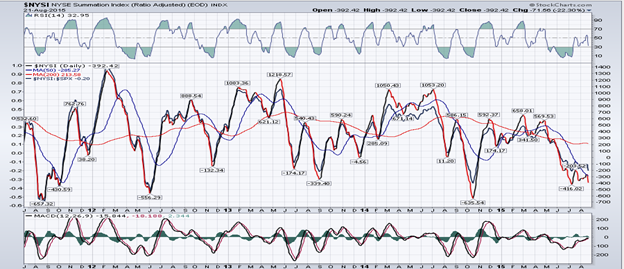
Both P&F charts (1X and 3X) are in agreement. A short-term low could be reached a few points lower and give us the first rally within the intermediate decline.
Chart Analysis
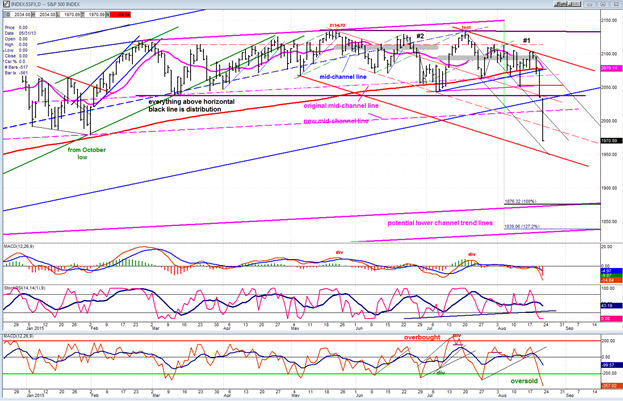
The following chart of the Daily SPX (chart courtesy of QCharts.com as others below) requires a bit of explanation.
I originally had a narrow pink channel which could have been left as is, but by drawing the bottom channel line across the October low and making the original bottom line the mid-channel line, I believe that it will better delineate the action which is taking place. Actually, I have drawn two bottom channel lines. The upper one from the October low is almost exactly a 100% extension of the top line to the new mid-channel line. Because I think it may be a little conservative for the low of the first phase of the decline, I have added another at the 127.2% extension of the top portion. These lines should represent the level at which the first phase of the decline will end.
I have also marked in wide gray lines the first two phases of the distribution area up to the 2135 top. My line of demarcation between the first and second phase is arbitrary but, I think, logical. Actually, as I have noted on the chart, the entire trading range above the 2040 level (black line) can be considered distribution. Therefore, my thinking that the correction will be over after we have completed about half of the total distribution area because it would satisfy a primary wave IV structure is also arbitrary. If the downtrend persisted beyond phase #2, we would have to revise the labeling of the entire structure and consider the probability that we are in a full scale bear market.
The red channel which was drawn before the decline started, turned out to be correct since the top downtrend line is exactly where the last rally stopped. However, the width of the channel had to be increased and a new, steeper channel created within to delineate the trend acceleration. It could set parameters for the short-covering rally which is about to take place. How it was created will be easier to see on the hourly chart.
We have also broken below the blue uptrend line which is the bottom line of the channel from October 2011 (primary wave III). That helps to confirm that last week’s decline is the beginning of an intermediate correction.
The A/D oscillator is very oversold and that, plus the fact that we are near a projection phase, suggests that a reversal is very close.
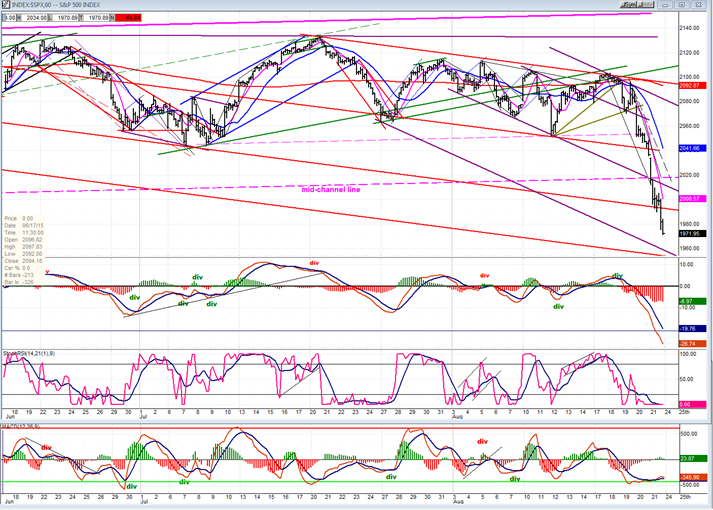
I have also enlarged the red channel on the Hourly chart and created an experimental black channel which is based on the line connecting three lows. We’ll see if future prices conform to it.
On an hourly basis, the A/D has flattened and started to turn up. This is another sign that a reversal is very near. Structurally, we may be about to complete the third wave of the move from the 2103 high. That would put us in 5 of 3, also indicating that a low is near. The exact projection price will be made available to subscribers (including trial subscribers) in the Monday morning comment.
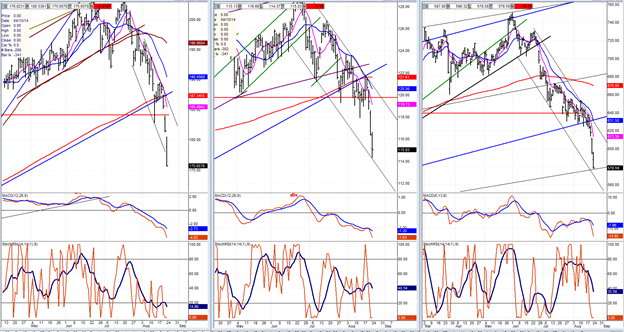
XBD -- IWM -- SOX
The charts speak for themselves and do not require a commentary.
UUP (dollar ETF)
UUP may be having a wave 4 correction in the form of a triangle after which it should go on to fill its projected high.

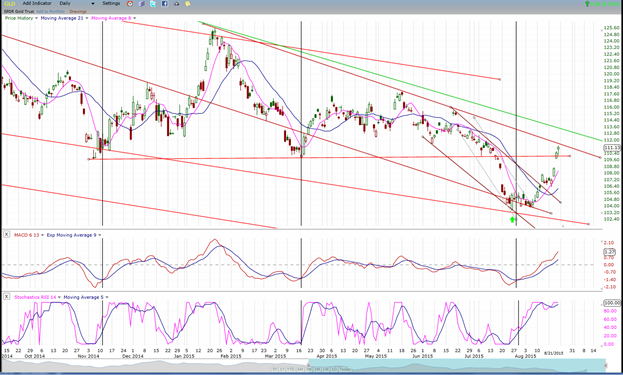
GLD (Gold Trust)
GLD did a good job of bottoming when expected, even moving beyond its conservative 109 projection. This may be about all we get for now. Longs should be cautious. The last few peaks show you how quickly it can reverse when its move is over. There is also the matter of the incomplete 101 projection which could come in early to mid-October, still a while away, and GLD may have time to correct a couple of points and rise a little higher before making its final low. It looks like another wave down is necessary to complete the current structure. Also, note that GDX is not doing much. Why should it if GLD still has to make a final low before starting a genuine uptrend!
USO (US Oil Fund)
And there you are! USO has reached 13. Even if this is the low, I am not expecting very much after it stops going down (if it has). Base building may be in order. Or, it may simply consolidate before dropping to 7 or 8.

Summary
“SPX is undergoing a consolidation in a downtrend using the 200-DMA as support. A daily close below 2073 which does not hold, should bring about the next challenge to the 2040 major support level.”
That “major” support level evaporated as it became evident that something serious was starting and stocks were still being dumped at Friday’s close. But we are extremely oversold over the short term and, furthermore, we are approaching a projection from which a short-covering rally is likely to develop.
Don’t expect this correction to be over in a couple of days! It has quite a ways to go both in time and in price.
********
FREE TRIAL SUBSCRIPTON
Market Turning Points is an uncommonly dependable, reasonably priced service providing intra-day market updates, a daily Market Summary, and detailed weekend reports. It is ideally suited to traders, but it can also be valuable to investors since highly accurate longer-term price projections are provided using Point & Figure analysis and Fibonacci projections. Best-time reversal estimates are obtained from cycle analysis.
For a FREE 4-week trial, send an email to: [email protected]
For further subscription options, payment plans, weekly newsletters, and for general information, I encourage you to visit my website at www.marketurningpoints.com. By clicking on "Free Newsletter" you can get a preview of the latest newsletter which is normally posted on Sunday afternoon (unless it happens to be a 3-day weekend in which case it could be posted on Monday).
The above comments and those made in the daily updates and the Market Summary about the financial markets are based purely on what I consider to be sound technical analysis principles. They represent my own opinion and are not meant to be construed as trading or investment advice, but are offered as an analytical point of view which might be of interest to those who follow stock market cycles and technical analysis.

When Andre Gratian was a stock broker years ago, a friend introduced him to technical analysis of the market. Consequently, it is not an exaggeration to say that Andre fell in love with this approach! Ever since then, it has become an increasingly important part of his professional life. Gratian has studied the works of Wyckoff, Edwards & Magee, Edward J. Dewey (cycles) and many others. However, one of my most profitable undertaking has probably been to study Point & Figure charting, which he finds invaluable in analyzing stocks and indices. If he were restricted to one methodology, this is the one that he would choose. This well-rounded background has given him what he feels to be a special insight into the stock market, facilitating the recognition of meaningful patterns and the ‘turning points’ in all trends, whether they be short or long term. Andre feels very comfortable discussing the stock market and passing on meaningful information to others. His subscribers include individuals and money managers throughout the world. Moreover, his Newsletters are currently published on several financial sites, here and abroad.


