Major Markets Update


Gold
Short-Term Update

In the overnight session gold reached a low of 1191.80, and has since recovered somewhat to be trading around the 1215 area, at the time that this Post was being written.
As we mentioned in yesterday’s Morning Post we are now working on wave !iv! and it could now be possible that all of that corrective wave is complete at the 1191.80 low.
The current low is pretty much our 38.2% retracement level which is 1189.60.
We cannot rule out the possibility that wave !iv! is still underway and that it could also become a triangle.
On the Intraday Chart the rally from the 1191.80 low to the current high of 1217.50, is impulsive looking, which could mean that wave !v! has already begun.
Upon completion of wave !iv! we expect gold to rally in wave !v! to at least the wave !iii! high of 1307.80, to complete all of wave ^iii^.
Our initial count for wave (3) of 3 is as follows:
*i* = 1088.30
*ii* = 1046.80;
*iii*:
^i^ = 1081.40;
^ii^ = 1056.60;
^iii^:
!i! = 1113.10;
!ii! = 1071.10;
!iii! =1263.40, 1262.90(Daily Continuous Futures);
!iv! = 1191.80, if complete.
!v! rally to go after the completion of wave !iv!, which should reach the 1307.80 level to complete all of wave ^iii^.
Projection for the end of wave *iii* is:
*iii* = 6.25*i* = 1314.90.
Longer-Term Update:
In the very long term we are now rallying in wave V, and with wave V we have the following count:
1 = 1033.90;
2 = 681.00;
3:
(1) = 1923.70;
(2) = 1045.40;
(3) rally is now underway.
Projections for the end of wave (3) are as follows:
((3)) = 1.618((1)) = 3056.10;
((3)) = 2.618((1)) = 4298.80
Based on the above count we can provide some projections for the end of wave 3, as follows:
3 = 2.618(1) = 3085.10;
3 = 4.236(1) = 4345.70;
3 = 6.25(1) = 5914.80.
The reason that we doubt that the 1045.40 low is a wave 4 is because it corrected over 61.8% of the rally from 681.00 to 1923.70. This is too deep for a wave 4 correction, but more in line with a wave (2) type retracement.
Active Trading Positions: Long 20 positions, with puts at 1085.00!
Crude Oil
Short-Term Update:

Crude was initially sharply higher in the overnight session, reaching 31.44, on the hopes of a production cut by the producing nations include Saudi Arabia and Russia.
There are no serious production cuts, so crude has fallen back.
We have been watching a number of options for the future direction crude of crude and have now adopted Option 4, as the likely path for this market. In Option 4 we believe that all of wave -iii- ended at 26.05 and that we are now rallying in wave -iv-.
Since we are in a diagonal triangle, wave -iv- needs to consist of at least one 3 wave pattern, but could have up to three such patterns.
On the Intraday Chart the rally from 26.05 to the current high of 31.44 looks like a completed impulsive sequence, so if that observation is correct then we should expect crude to correct between 50 to 61.8% of the entire completed impulsive sequence.
It is a bit too early to determine what pattern wave -iv- is going to follow.
With crude now rallying in a possible wave -iv-, then we might still get filled on our proposed Suncor short order at 24.75!
Long-Term Update
Wave -iii- is complete at the 26.05 low and we should now be rallying in wave -iv, as the next big event in the market.
Active Trading Positions: Will short Suncor at 24.75, risking to 27.00, and will buy Suncor at 13.00!
S&P500
Short Term Update
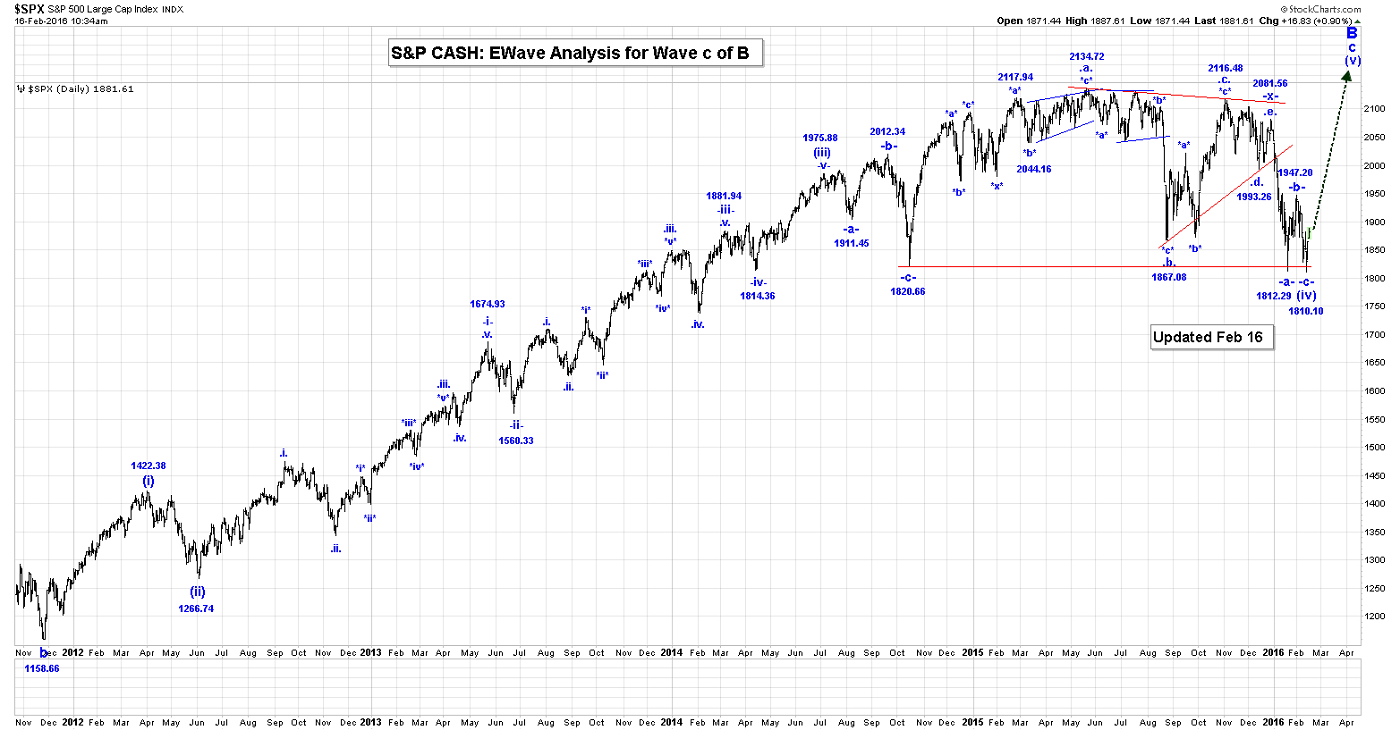
The S&P Futures were up over the last couple of sessions, but off their highs. In yesterday’s Morning Post we talked about an updated wave (iv) count that should be complete at the 1810.10 low.
This means we are now rallying in wave (v). We remain skeptical of this count, but right or wrong that is what we follow what the EWaves are telling us about this market, and we don’t try to outsmart ourselves.
We are still have trouble declaring that the S&P has completed wave B, due to the inability of seeing and impulsive wave structure drop from the 2100/2135 highs.
We are still working on the idea that only wave (iv) ended at 1810.10, and that we should expect one more rally in wave (v) to all time new highs to complete all of wave B.
We do have an issue with this coun,t as it is inconsistent with what gold and the USDX are doing, but we do not want to force our analysis by using failures to make it work!
A break below the 1810.10 wave (iv) would eliminate this option and again force us to conclude that all of wave B ended somewhere in the 2100/2135 level.
Long Term Update
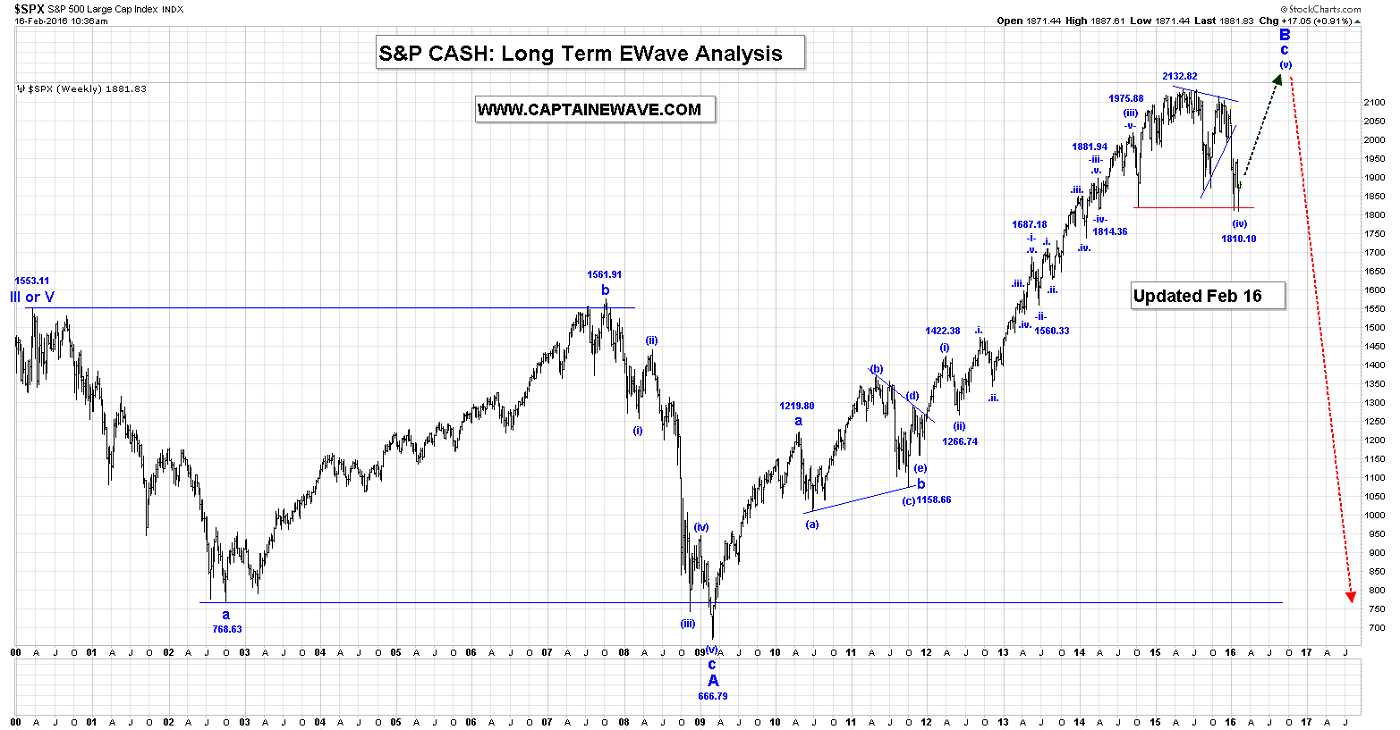
If the S&P breaks below the 1810.10 lows then a major top in the S&P has occurred somewhere as a failure top in the 2100/2140 area, otherwise wave (iv) has taken a different path, and we might be rallying in wave (v) to one more new all-time high.
Active Trading Positions: Flat!
USDX
Short-Term Update

The USDX reached a high of 96.91 in yesterday’s day session. We reached a low of 96.40, in the overnight session, at the time that this Post was being written.
Either we are rallying in wave *ii* of .iii. or we are still working on the legs of a wave ^iv^ triangle.
We are working on the assumption that all of wave *i* of .iii. is complete at the 95.28 low, and that we have started to rally in wave *ii*, however on the Intraday Chart wave ^v^ of *i*, did not really have the correct looking internal wave structure that we thought it should.
This brings the wave *iv* triangle option back into consideration. At the moment the wave *iv* triangle option would look like:
^a^ = 97.50;
^b^ = 95.28;
^c^ = 96.91, if complete, as we cannot rally above the wave ^a^ high of 97.50.
^d^ drop is now
^e^ to go to complete all of the wave *iv* triangle.
For the time being we will assume that all of wave *i* is complete at the 95.28 low, but we are watching the wave *iv* triangle option closely. If wave *I* is complete at the 95.28 low then our upcoming wave *ii* rally should retrace between 50 to 61.8% of then entire wave *i* drop.
We will provide those retracements when we are sure that all of wave *i* is complete.
Our current count for wave -c- is:
.i. = 97.59;
.ii. = 99.95
.iii.:
*i*:
^i^ = 98.45;
^ii^ = 99.88;
^iii^ = 96.04;
^iv^ = 97.50, if complete and not becoming a triangle;
^v^ = 95.28, if complete, to complete all of wave *i*;
*ii* rally will be next.
Projections for the end of wave *ii* are:
50% = 97.62;
61.8% = 98.17.
We have the following projections of all of the wave .iii. drop:
.iii. = 1.618.i. = 94.53;
.iii. -= 2.618.i. = 91.18;
.iii. = 4.236 i = 85.76.
Long-Term Trading Update
We should be falling sharply in wave .iii. in the next couple of weeks or months. If wave *i* of .iii. is now complete, then a wave *ii* rally will be the next big event.
Active Trading Positions: None!
NatGas
Short Term Update
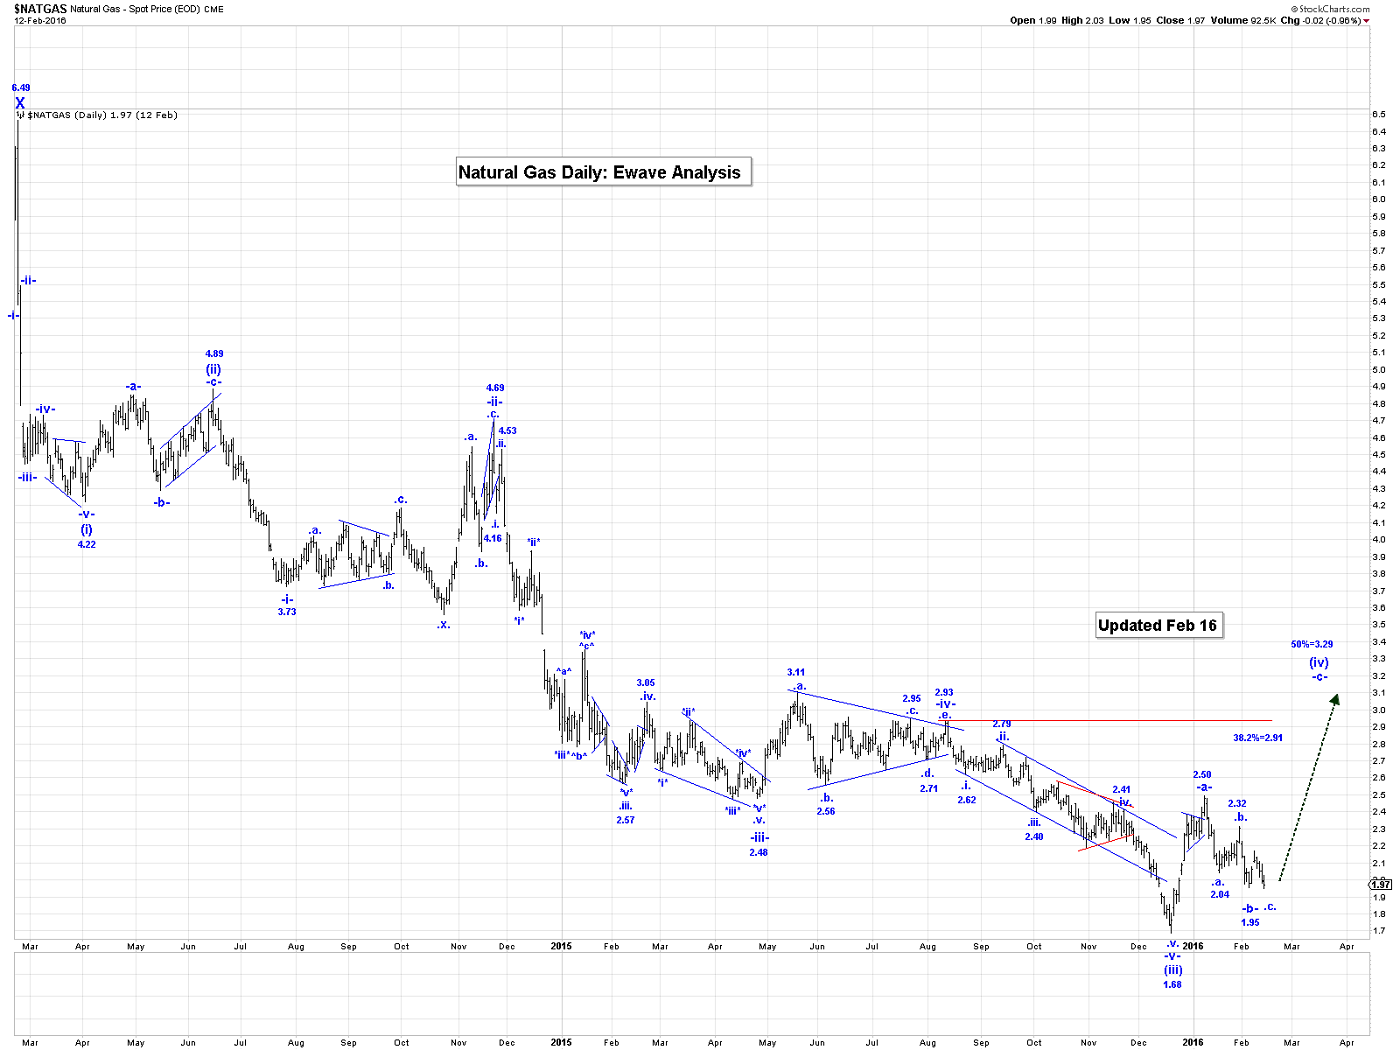
NG dropped a little more in the overnight session, reaching 1.911, at the time that this Post was being written. On the Intraday Chart, the drop from our wave -a- high of 2.494 to the current low of 1.952, looks corrective, but INCOMPLETE.
Our suggested alternate triangle option, that we talked about in about in our last Morning Post has also been eliminated.
The short term direction in NG is now unclear, but we are still assuming that wave -a- ended at 2.494 and that we are working on some kind of incomplete wave -b- at the moment.
Long-Term Trading Update
Our retracement levels for all of wave (iv):
38.2% = 2.91;
50% = 3.29.
For the time being we will assume that wave (iv) is a simple -a-, -b-, -c- pattern, and within that count we have:
-a- = 2.494;
-b- is still underway:
-c- rally would be next and should rally to at least the wave -a- high, but more likely to our 38.2%/50% retracement zone shown above.
Active Trading Positions: We are long 5 positions at 2.04, risking to 1.80!
HUI/GDX and Selected Gold Stocks
Short-Term Update:

In terms of CRJ (Claude Resources): On the Long term Chart we see no reason why CRJ cannot reach the 1.40/1.50 level to complete all of wave (iii).
On the Daily Chart, wave *v* is NOT complete at the 1.19 high, which supports a possible run to our 1.40/1.50 level, to complete all of wave -v- and (iii). Upon completion of wave (iii), we expect a correction in wave (iv) which is expected to retrace between 23.6 and 38.2% of the entire wave (iii) rally.

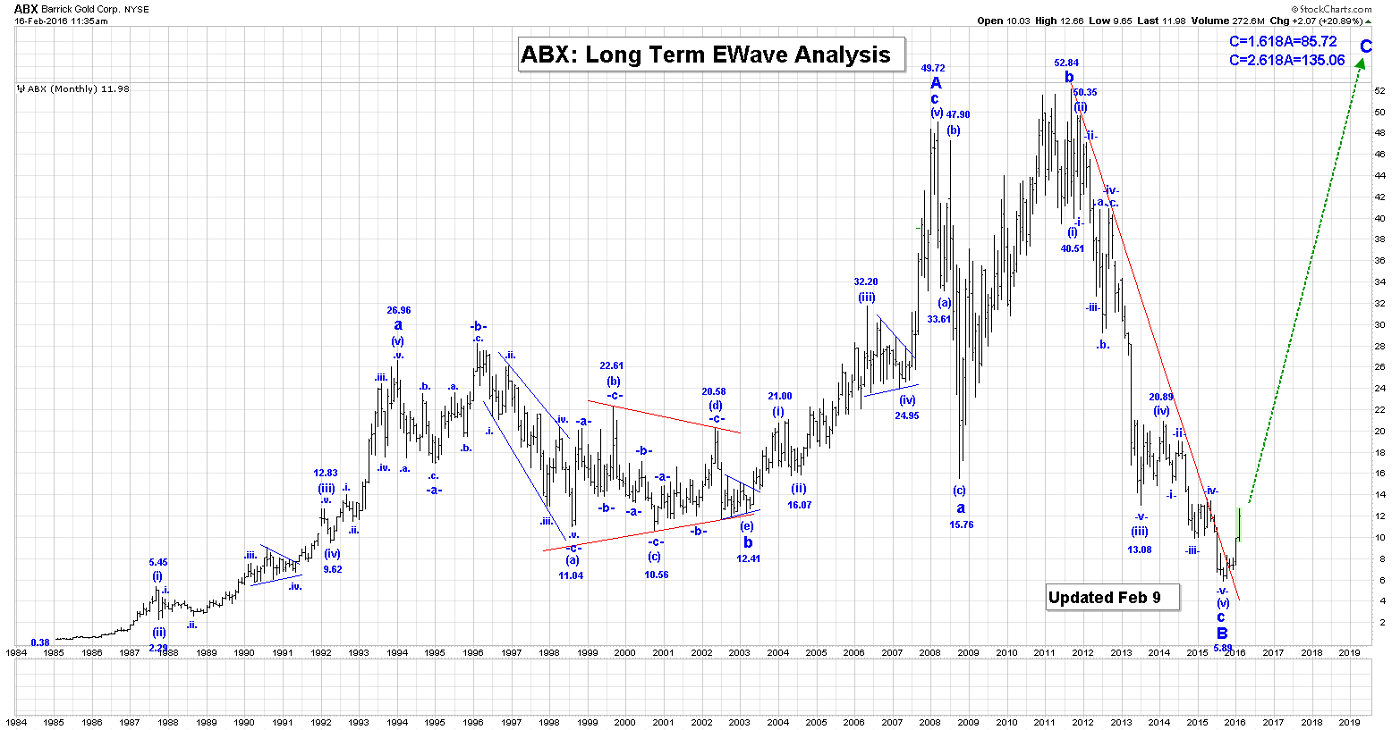
In terms of ABX, we have attached the updated 120 Min Chart. We had been thinking that all of wave (v) was complete at the 12.66, high, but it now appears likely that wave (v) is subdividing as shown on the attached 120 Min ABX Chart. It looks like within wave (v) we have:
.i. =12.66;
.ii. = 11.62. Note that wave .ii. did retrace at least 50% of the wave .i. rally.
.iii. is next.
A clean break of the 12.66 high, would eliminate any possibility that all of wave (v) ended at 12.66 high.
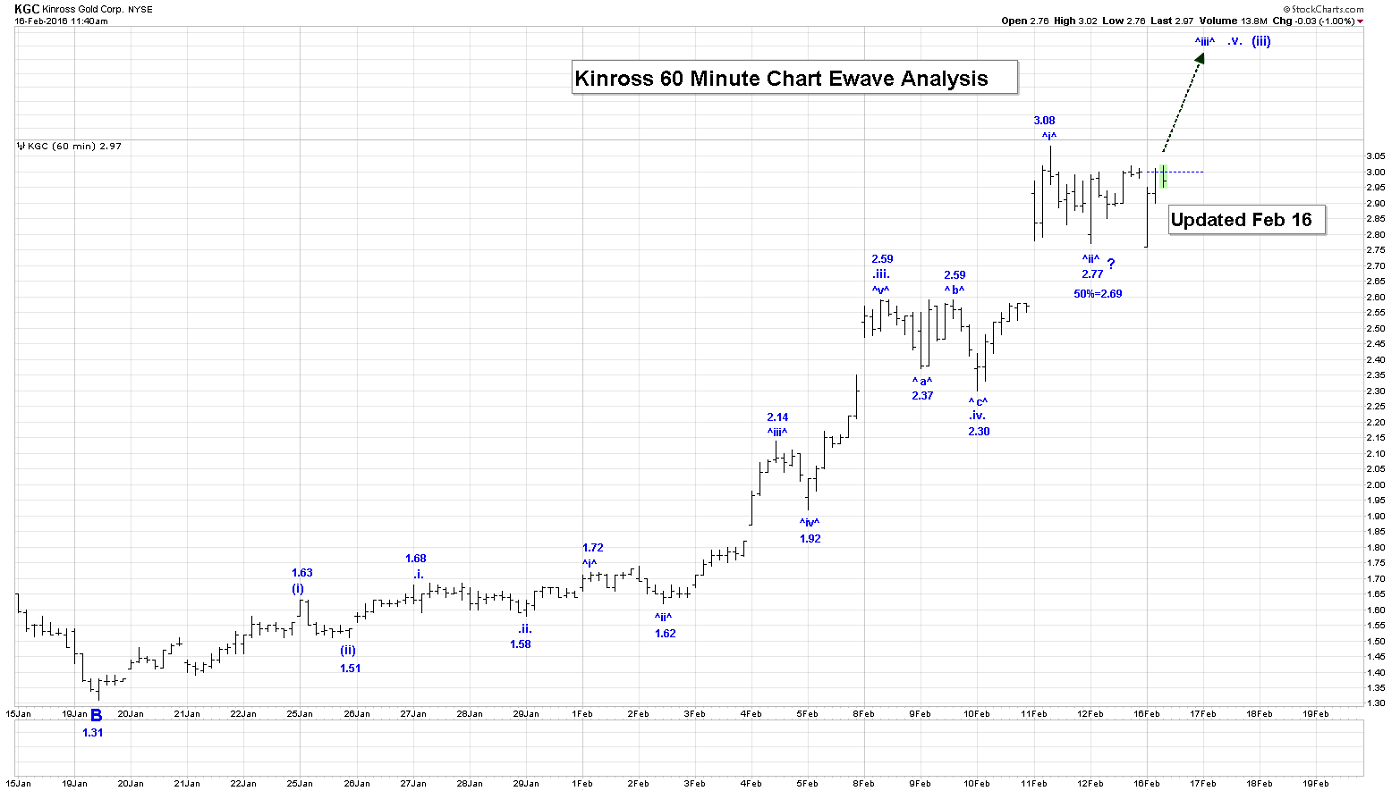
In terms of Kinross, we have attached the updated 60 Min Chart. Like ABX it looks like wave .v. and wave (iii) are subdividing also. In this case, however, wave ^ii^ did not reach our 50% retracement level for wave ^ii^ of .v. which is 2.69, as we only reached 2.77, before moving higher.
It could be that wave ^ii6 is not complete at the 2.77 low, but that is kind of meaningless, as it appears that Kinross is still going higher, before we get a more meaningful correction.
We reached a high of 3.08, which could signal the end of wave (iii). If that is the case then we should expect a wave (iv) drop that retraces between 23.6 to the 38.2% of the entire wave (iii) rally, as the next big event.

In spite of gold being down on Friday, the GDX was higher reaching 18.85. The chart is bullish and we expect higher prices this week!
If the above observations on the GDX and our selected gold stocks are correct, then we believe that wave !iii! in gold may not be over and that we are still heading higher to our 1310ish projected target area, before wave !iii! ends!
Long Term Update
The Long Term HUI, Long Term XAU, Long Term Kinross and Long Term ABX Charts have all broken major down trend lines, which is technically signaling a major change in direction. All of the those stocks/indices have finally completed their respective wave B lows.
The rally in these stocks should be spectacular over the next couple of years. We are very long all of these stocks!
Active Trading Positions: We are long the GDX, ABX, KGC, NEM, CRJ, and TSX:XGD with no stops!
********
Special Offer For Ewave Enthusiasts: Send me an Email to [email protected] and I’ll give you a 3 day free trial subscription!
Email: [email protected]
Website: www.captainewave.com
Risk: CAPTAINEWAVE.COM IS AN IMPERSONAL ADVISORY SERVICE. AND THEREFORE, NO CONSIDERATION CAN OR IS MADE TOWARD YOUR FINANCIAL CIRCUMSTANCES. ALL MATERIAL PRESENTED WITHIN CAPTAINEWAVE.COM IS NOT TO BE REGARDED AS INVESTMENT ADVICE, BUT FOR GENERAL INFORMATIONAL PURPOSES ONLY. TRADING STOCKS DOES INVOLVE RISK, SO CAUTION MUST ALWAYS BE UTILIZED. WE CANNOT GUARANTEE PROFITS OR FREEDOM FROM LOSS. YOU ASSUME THE ENTIRE COST AND RISK OF ANY TRADING YOU CHOOSE TO UNDERTAKE. YOU ALSO AGREE TO BEAR COMPLETE RESPONSIBILITY FOR YOUR INVESTMENT RESEARCH AND DECISIONS AND ACKNOWLEDGE THAT CAPTAINEWAVE.COM HAS NOT AND WILL NOT MAKE ANY SPECIFIC RECOMMENDATIONS OR GIVE ADVICE TO YOU OR ANY OF ITS CLIENTS UPON WHICH THEY SHOULD RELY. CAPTAINEWAVE.COM SUGGESTS THAT THE CLIENT/MEMBER TEST ALL INFORMATION AND TRADING METHODOLOGIES PROVIDED AT OUR SITE THROUGH PAPER TRADING OR SOME OTHER FORM OF TESTING. CAPTAINEWAVE.COM, ITS OWNERS, OR ITS REPRESENTATIVES ARE NOT REGISTERED AS SECURITIES BROKER-DEALERS OR INVESTMENT ADVISORS EITHER WITH THE U.S. SECURITIES AND EXCHANGE COMMISSION OR WITH ANY STATE SECURITIES REGULATORY AUTHORITY. WE RECOMMEND CONSULTING WITH A REGISTERED INVESTMENT ADVISOR, BROKER-DEALER, AND/OR FINANCIAL ADVISOR. IF YOU CHOOSE TO INVEST WITH OR WITHOUT SEEKING ADVICE FROM SUCH AN ADVISOR OR ENTITY, THEN ANY CONSEQUENCES RESULTING FROM YOUR INVESTMENTS ARE YOUR SOLE RESPONSIBILITY.
ALL INFORMATION POSTED IS BELIEVED TO COME FROM RELIABLE SOURCES. CAPTAINEWAVE.COM DOES NOT WARRANT THE ACCURACY, CORRECTNESS, OR COMPLETENESS OF INFORMATION AVAILABLE FROM ITS SERVICE AND THEREFORE WILL NOT BE LIABLE FOR ANY LOSS INCURRED. DUE TO THE ELECTRONIC NATURE OF THE INTERNET, THE CAPTAINEWAVE.COM WEBSITE, ITS E-MAIL & DISTRIBUTION SERVICES AND ANY OTHER SUCH "ALERTS" COULD FAIL AT ANY GIVEN TIME. CAPTAINEWAVE.COM WILL NOT BE RESPONSIBLE FOR UNAVAILABILITY OF USE OF ITS WEBSITE, NOR UNDELIVERED E-MAILS, OR "ALERTS" DUE TO INTERNET BANDWIDTH PROBLEMS, EQUIPMENT FAILURE, OR ACTS OF GOD. CAPTAINEWAVE.COM DOES NOT WARRANT THAT THE TRANSMISSION OF E-MAILS, OR ANY "ALERT" WILL BE UNINTERRUPTED OR ERROR-FREE. CAPTAINEWAVE.COM WILL NOT BE LIABLE FOR THE ACTS OR OMISSIONS OF ANY THIRD PARTY WITH REGARDS TO CAPTAINEWAVE.COM DELAY OR NON-DELIVERY OF THE CAPTAINEWAVE.COM NIGHTLY EMAILS OR "ALERTS". FURTHER, WE DO NOT RECEIVE ANY FORM OF PAYMENT OR OTHER COMPENSATION FOR PUBLISHING INFORMATION, NEWS, RESEARCH OR ANY OTHER MATERIAL CONCERNING ANY SECURITIES ON OUR SITE OR PUBLISH ANY INFORMATION ON OUR SITE THAT IS INTENDED TO AFFECT OR INFLUENCE THE VALUE OF SECURITIES.
THERE IS NO GUARANTEE PAST PERFORMANCE WILL BE INDICATIVE OF FUTURE RESULTS. NO ASSURANCE CAN BE GIVEN THAT THE RECOMMENDATIONS OF CAPTAINEWAVE.COM WILL BE PROFITABLE OR WILL NOT BE SUBJECT TO LOSSES. ALL CLIENTS SHOULD UNDERSTAND THAT THE RESULTS OF A PARTICULAR PERIOD WILL NOT NECESSARILY BE INDICATIVE OF RESULTS IN FUTURE PERIODS. THE RESULTS LISTED AT THIS WEBSITE ARE BASED ON HYPOTHETICAL TRADES. PLAINLY SPEAKING, THESE TRADES WERE NOT ACTUALLY EXECUTED. HYPOTHETICAL OR SIMULATED PERFORMANCE RESULTS HAVE CERTAIN INHERENT LIMITATIONS. UNLIKE AN ACTUAL PERFORMANCE RECORD, SIMULATED TRADES DO NOT REPRESENT ACTUAL TRADING. ALSO, SINCE THE TRADES HAVE NOT ACTUALLY BEEN EXECUTED, THE RESULTS MAY HAVE OVER OR UNDER COMPENSATED FOR THE IMPACT, IF ANY, OF CERTAIN MARKET FACTORS SUCH AS LACK OF LIQUIDITY. YOU MAY HAVE DONE BETTER OR WORSE THAN THE RESULTS PORTRAYED. NO REPRESENTATION IS BEING MADE THAT ANY ACCOUNT WILL OR IS LIKELY TO ACHIEVE PROFITS OR LOSSES SIMILAR TO THOSE SHOWN. NO INDEPENDENT PARTY HAS AUDITED THE HYPOTHETICAL PERFORMANCE CONTAINED AT THIS WEBSITE, NOR HAS ANY INDEPENDENT PARTY UNDERTAKEN TO CONFIRM THAT THEY REFLECT THE TRADING METHOD UNDER THE ASSUMPTIONS OR CONDITIONS SPECIFIED HEREAFTER. WHILE THE RESULTS PRESENTED AT THIS WEBSITE ARE BASED UPON CERTAIN ASSUMPTIONS BELIEVED TO REFLECT ACTUAL TRADING CONDITIONS, THESE ASSUMPTIONS MAY NOT INCLUDE ALL VARIABLES THAT WILL AFFECT, OR HAVE IN THE PAST AFFECTED, THE EXECUTION OF TRADES INDICATED BY CAPTAINEWAVE.COM. THE HYPOTHETICAL RESULTS ON THIS WEBSITE ARE BASED ON THE ASSUMPTION THAT THE CLIENT BUY AND SELLS THE POSITIONS AT THE OPEN PRICE OF THE STOCK. THE SIMULATION ASSUMES PURCHASE AND SALE PRICES BELIEVED TO BE ATTAINABLE. IN ACTUAL TRADING, PRICES RECEIVED MAY OR MAY NOT BE THE SAME AS THE ASSUMED ORDER PRICES.
More from Gold-Eagle


