The March Reversals


Introduction
Since March 2000, the SP500 has been in a rhythm which I find very interesting. I do not predict or forecast market directions, and this is neither a prediction nor forecast, but until the rhythm changes, it is wise to pay attention.
Lets go to the charts…

March 2000 - a top to remember.
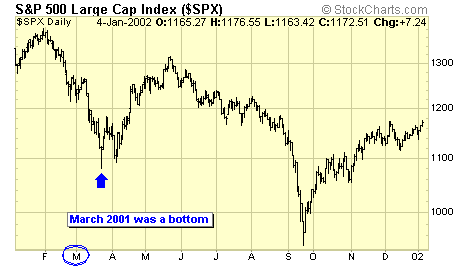
March 2001 - a short term bottom and a tradable bounce worthy of 20%.

March 2002 - another major top which produced excellent profits for the sellers.

March 2003 - a major bottom which produced excellent profits for the buyers.
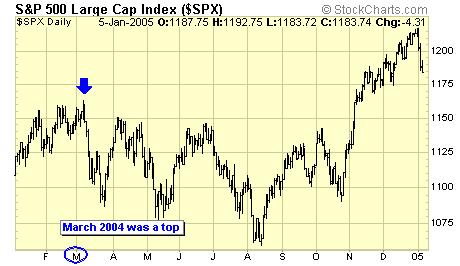
March 2004 - a short term top but difficult to trade for both buyers and sellers.

March 2005 - here we are, does it appear that we are at a bottom, or a top? Elliott wave fans can quickly recognize the 5 waves up since Aug 2004, because we just made a higher high this first week of March. Obviously, it does look like we are closer to a top than bottom, further evidence is apparent by checking out the internals….

OK, despite a higher high in price, the percentage of stocks with a buy signal within the SP500 index actually dropped from the Dec high, this creates a bearish divergence.

The summation index also confirms this bearish divergence.
Summary
The seasonal strength and weakness in the markets have been well documented over the years. I've had the good fortune of working with a market researcher a few years ago, and from studying over eighty years of data, there is no question about the seasonal strength between the months of October to April, and the seasonal weakness between the months of May to September. But that was before the internet era. Nowadays, any ordinary investor can have easy access to the technical structure of the markets, with some very common indicators defining the up and down cycles of the markets. The increased participation of ordinary folks into the once guarded fortress of the financial markets, has created a major impact on how the markets behave, and these behaviors are easily observed by trained eyes thru some simple charting and technical studies.
Jack Chan at www.traderscorporation.com
5 March 2005

Jack Chan is the editor of Simply Profits, established in 2006. Chan bought his first mining stock, Hoko Exploration, in 1979, and has been active in the markets for the past 37 years. Technical analysis has helped him filter out the noise and focus on the when, and leave the why to the fundamental analysts. His proprietary trading models have enabled him to identify the NASDAQ top in 2000, the new gold bull market in 2001, the stock market top in 2007, and the US dollar bottom in 2011.
More from Gold-Eagle


