The Market Got It Wrong


As we look back upon another interesting week in the market, there are a few standout matters I would like to point out.
To begin with, I saw the following quote from an interview with well-known economist Austan Goolsbee:
“The timing of the selloff has been something of a “puzzle” given there was no major change in the Fed’s latest projections.”
Mr. Goolsbee’s quote evidenced his ignorance of certain market dynamics. First, this selloff was not at all a “puzzle,” as the setup for it was developing weeks ago, as I have outlined in public articles. But, you will not be able to identify these types of movements based on traditional economics. As Benoit Mandelbrot outright stated, one cannot reasonably apply an economic model to the financial markets:
“From the availability of the multifractal alternative, it follows that, today, economics and finance must be sharply distinguished . . .”
Second, the Fed does not control the market as many seem to believe. If it were true, then the market would not have been rallying to 4607 over this last year. In fact, that rally took Mr. Goolsbee and most other economists by surprise as well.
As I have often said, while news can act as a catalyst, the substance of the news is not really material to the direction of the market move. While many market watchers superficially believe that the substance of a news announcement determines the direction of a market move, they often ignore the many times the market moves in the opposite direction of expectations. And, here, Mr. Goolsbee is proving our point.
To take this one step further, on September 18, I published an article entitled “Sentiment Speaks: Will The Fed ‘Cause’ A Mini-Crash?” wherein I noted the following:
“Moreover, should we see that downside follow through in the set up I am outlining, then it will likely be blamed upon a reaction to the Fed this coming week. But, please read that quote from Robert Prechter again, and hopefully you will not come back here and tell me that the Fed “caused” that drop. They will simply be a catalyst for a market move that is being set up.”
In fact, on September 11 (a week and a half before the Fed meeting), I noted the following:
“Based upon the current structure that the market seems to be tracing out, I am going to assume that the bears may be coming out of hibernation over the coming weeks. Yet, if they do, it may only be for a snack.”
Now, for those of you who have been following my public articles, you would likely know that I set a target for this decline in the 4230-4274SPX region before it even began. And, this past week, we hit a low of 4217SPX.
Moreover, we even were able to identify the specific twists and turns during the recent market action, as outlined in a blog post this past week:
And, as one of our members noted:
"Killing it for 6 weeks straight.... newbies pay attention, it doesn't get any better than this here."
So, let’s turn our focus to the action seen on Friday. If you read the blog post above, you would know that I was expecting one more decline as of Thursday. As I outlined to our members, as long as the resistance box I outlined on my chart held as resistance, I was expecting a decline into the end of the week to potentially complete the downside structure.
What was truly interesting about the action on Friday was that the market initially declined as expected, supposedly due to the jobs report published that morning. However, once it struck a double bottom, it then turned strongly in the opposite direction, and rallied over 100 points off that low. As one of the commenters to my article last week noted:
“Yo yo, check out the markets today. The jobs news implies strong economy and inflation, disaster for the Fed, so yields have spiked, 10 year is up 1.3%.
So, the stock market responds to news too, so it must be down ... right?
NOPE. SPX is up big.
So: think about it. Which better explains today's actions: breaking news? or technical and sentiment analysis?”
And, as one of our members joked in our trading room:
“Wow that elevated jobs number really tanked the market lol”
I even saw a number of people comparing the action seen on Friday to the action seen on October 13, 2022, which was a day when hotter-than-expected inflation numbers came out, yet it marked the bottom of the market since that time, as it rallied 6% off the low struck that day. And, if you had been following our analysis during that time too, you would know we were expecting a major market low around 3500SPX, with a further expectation of a rally to take us to 4300+ from there, no matter what the news.
If you have not realized it yet, I will again repeat that while the news can act as a catalyst to a market move, the substance of that news will often not be determinative of the direction of that market move. And, if you are being honest, then you have to realize the truth of this proposition. What ultimately directs the market move is the nature of the market sentiment at the time of the announcement. Allow me to give you an example of how we were looking at the market sentiment structure at the end of the week.
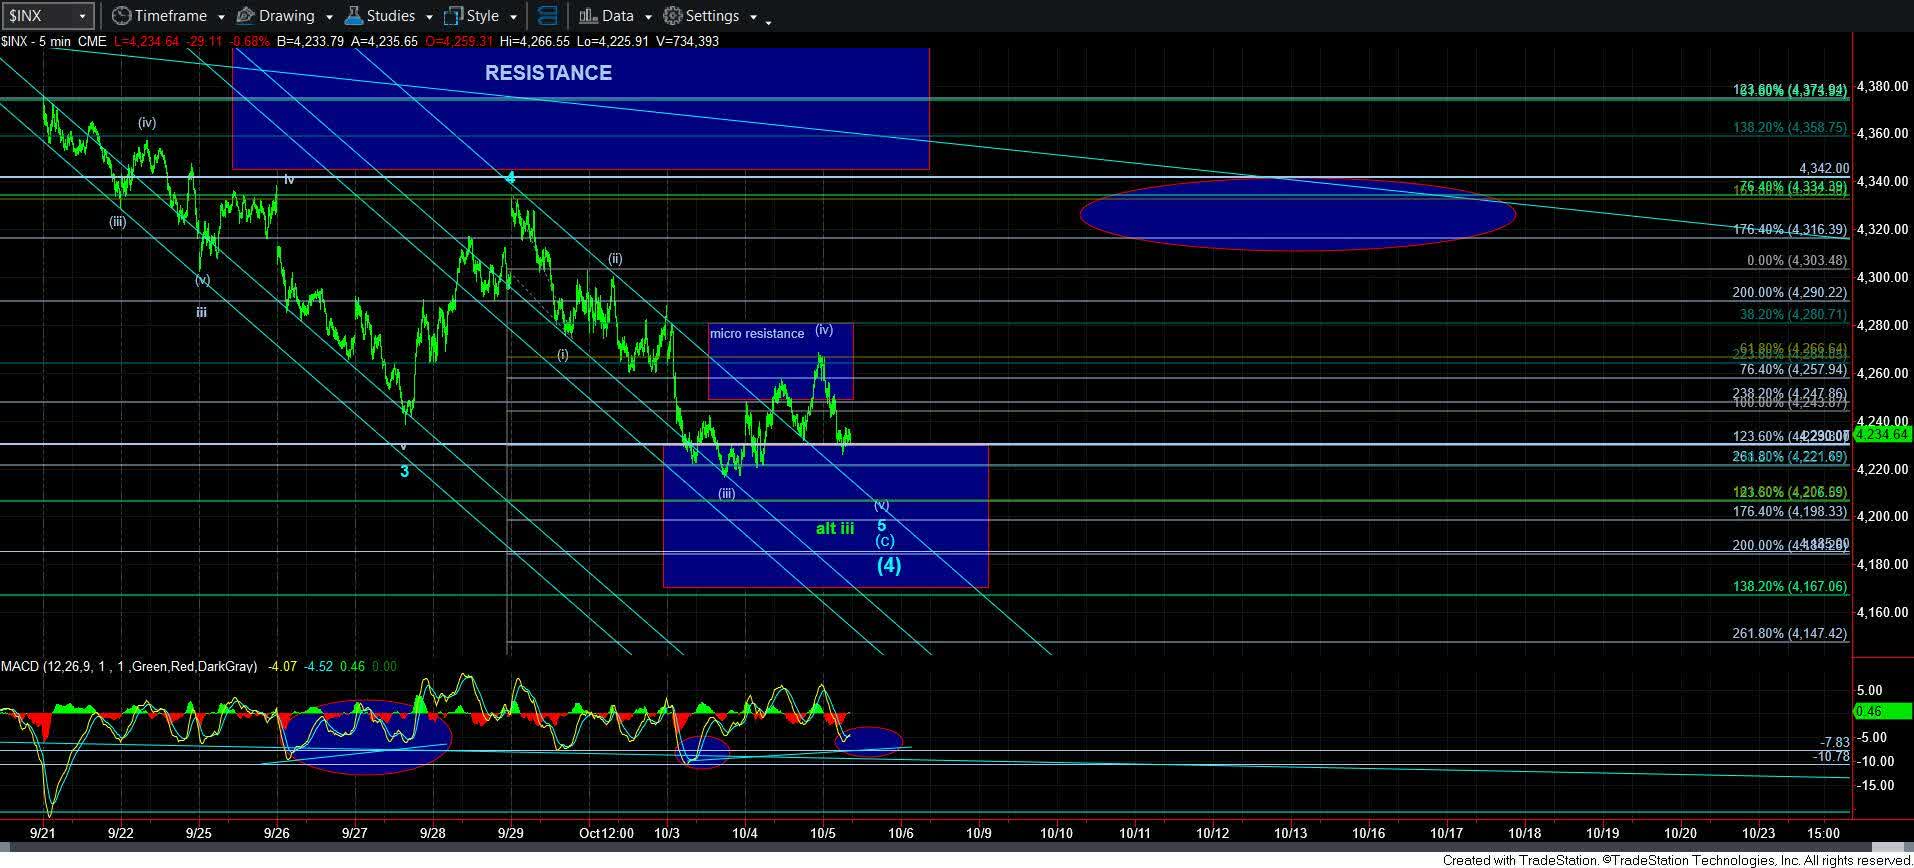
We were on high alert that the market was prepared for a reversal, as I outlined to our members on Thursday morning, as we were preparing for the decline we expected into Friday:
"Just stay on your toes, as once this downside completes . . . we should see a very strong reversal which can take us back towards the ellipse overhead.”
Elliottwavetrader
The ellipse referred to in the quote above was pointing to a strong rally back to the 4316-4342SPX region as our expectation once a low was struck. And, if you look at the action seen on Friday, we indeed saw a very strong reversal which topped on the same day at 4324SPX, right in the middle of the ellipse outlined on our chart.
Some may be wondering how I was able to make such a prognostication. Well, the structure with which the market was bottoming on Friday is called an ending diagonal in Elliott Wave parlance. One of the hallmarks of an ending diagonal is that when it completes, price action reverses quite strongly and points back to the region from which it originated. That is how I was able to expect a very strong rally back to the region outlined by the ellipse on my chart.
Of course, the question we now turn toward is whether we have begun that rally to 4800SPX?
It would seem most people are taking the perspective of the following comment that I read on Sunday night – before I wrote this article:
“the fundamentals (which do matter), do not lend to a bull run.”
Yet, the fundamentals have not mattered. Rates are higher today than they were in October 2022, yet the market is significantly higher. And, everyone and their grandmother has been calling for a recession for well over a year. So, forgive me if I continue to ignore fundamentals and continue to focus on what has truly mattered and has kept us on the correct side of the market – market sentiment.
So, I am going to give you a very simple way to view our market. If you want further details, you can review the weekend report I published at ElliottWaveTrader.net. But, again, to keep it simple, over the coming weeks there are two regions that will tell the story: 4165SPX and 4375-4401SPX. Once the market is able to break out through 4375-4401SPX resistance, it will suggest that we are likely on our way to 4800SPX, with a move through 4451SPX invalidating the alternative bearish potential.
You see, there is also an alternative structure we are tracking in the background, which would have a tremendously detrimental impact on our markets for the long term. Allow me to explain.
Although it is a lower probability at this time, if the market breaks down below 4165SPX, it opens the door in a big way to the market setting up for a crash into 2024 which would point us down to the October 2022 low, and potentially well below it. But, it would still likely provide us with a multi-week “bounce” before we see a major break down below 4000SPX. Moreover, should this setup develop in the coming months, then it confirms that a long-term high has been struck in the market, and a multi-year bear market has begun.
So, again, to keep it simple, as long as the market remains over 4165SPX, and rallies through 4401SPX, then I will maintain my primary expectation for a rally to 4800SPX. However, if we see a sustained break of 4165, which then points us to the 4000-4100SPX region, it begins to set up a market crash structure over the coming months, which will likely trigger in early 2024.
I want to now discuss why we always maintain an alternative perspective for the market. Most people approach market analysis from the perspective of, “tell me what the market is going to do right now.” Well, I think anyone who has experience in the market knows that this is an impossibility. The market is a non-linear environment, therefore, we approach the market with a non-linear perspective.
Therefore, we provide our perspective by ranking probabilistic market movements based on the structure of the market price action. And, if we maintain a certain primary perspective as to how the market will move next, and the market breaks that pattern, it clearly tells us that we were wrong in our initial assessment. But, here is the most important part of the analysis at this point: We also provide you with an alternative perspective at the same time we provide you with our primary expectation, and let you know when to adopt that alternative perspective before it happens.
This is no different than if an army general were to draw up his primary battle plans, and, at the same time, also draw up a contingency plan in the event that his initial battle plans do not work in his favor. It is simply the manner in which the general prepares for battle. So, why should we not do the same when we approach the market?
Moreover, we provide objective price points at which we recognize that we have to move to our contingency plan, and we then move into that contingency plan without delay. This allows us to view the market objectively and avoid the big losses that so many traders and investors often experience, which drags on your overall performance.
Lastly, I want to note my support for the people of Israel and ask for your prayers for a very selfish reason. I have many friends and family members residing in Israel right now. In fact, my 25-year-old son was in Israel for the holiday of Sukkot, and is a veteran of the Israeli army. His mother was my late wife, Becky, and we are actually approaching the 11th anniversary of her passing in a few weeks. Due to his being in the country for a religious holiday rather than at home in the US, we are concerned that he will be called back to the army. As he was a medic during his tenure with the army, he would likely be sent up to the front. So, I humbly ask for your prayers for my son, as well as all the people of Israel.
*********
 Avi Gilburt is a widely followed Elliott Wave technical analyst and author of ElliottWaveTrader.net, a live Trading Room featuring his intraday market analysis (including emini S&P500, metals, oil, USD & VXX), interactive member-analyst forum, and detailed library of Elliott Wave education. You can contact Avi at: [email protected].


