Market Top Called to within One Day by Contracting Fibonacci Spiral...Now what


It is nearing two years since I first published an article describing a theory titled “Contracting Fibonacci Spiral”. For further information, simply Google “Contracting Fibonacci Spiral” and a plethora of articles should be listed to provide a more thorough description. Further to this, I published an article in the April 2013 issue of Technical Analysis of Stocks and Commodities (Submitted in October 2012) to attempt to bring more mainstream exposure to this concept.
In a nutshell, the theory indicated important tops of 1966, 1987, 2000, 2008, with the next sequential date due in 2013. The ideal date was December 27th, 2012, but a 5% extension in time generated a date of May 21st, 2013. The broad stock market indices topped on May 22nd, 2013, which is either a fluke or is following the CFS, but with an extended time post for this move. The next CFS date is 3 years away and has already been determined and posted on our site.
Historically, whenever a CFS time post has been reached, a subsequent sharp correction in the market occurs. It is important to understand that this cycle provides no indication for how long a correction can last. The 1966 top saw a correction last for over 15 years, while the 1987 top saw a very sharp, yet short correction. I would highly recommend everyone try to get a copy of the article in the April issue of Stocks and Commodities Magazine, because it provides a complete picture of this theory.
Lowry's has the stock market in a correction phase at present, with expected strength in the stock market for the remainder of 2013. One thing I can comment about the CFS is that if for some reason their was a “skip” in the rhythm of this cycle, then the 2016 top would represent a very important top that would subsequently find a very sharp correction. In today's report, I have included 5 different charts that help to paint a picture about what appears to be developing.
To quickly summarize for those who do not wish to delve into the technical analysis, here is what I see:
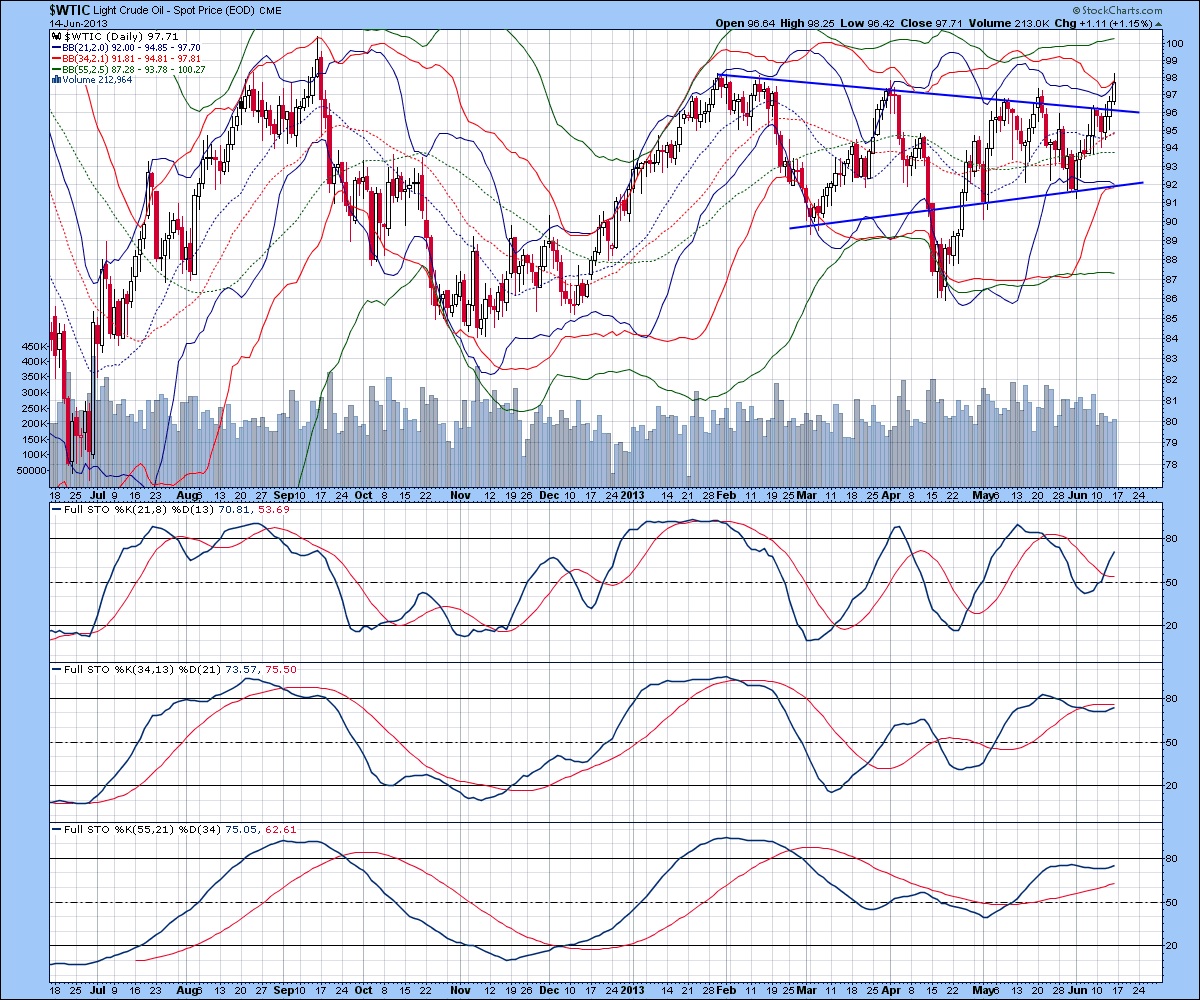
- The price of oil appears set to rise to at least $111/barrel due to a few different technical factors. Rising energy costs will result in a decrease in disposable income for the consumer that would result in a gradual slow down in the economy.
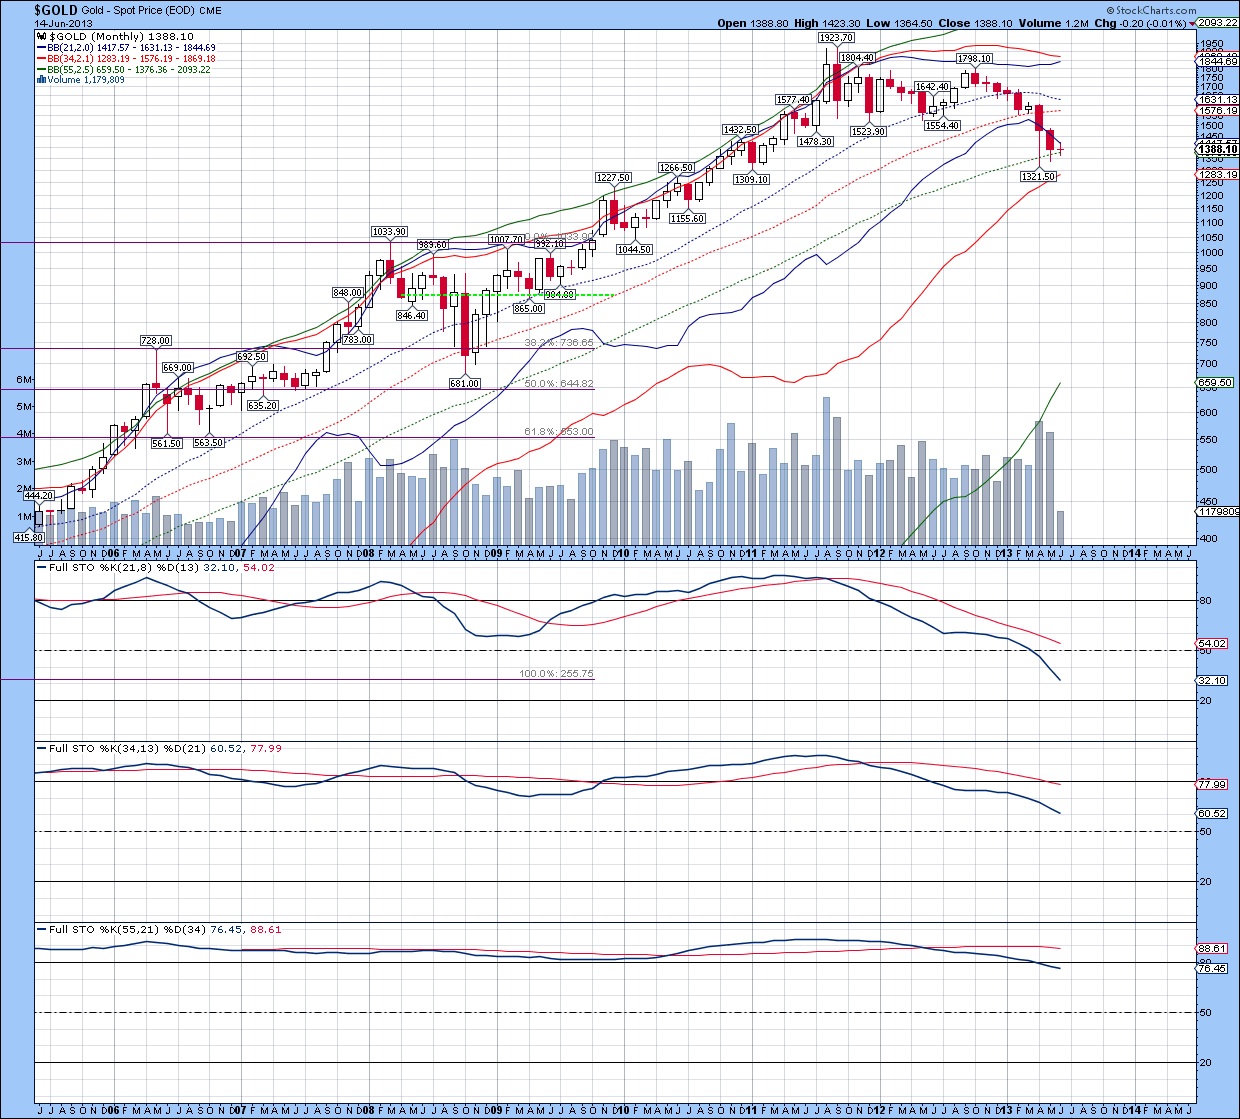
- The monthly chart of gold remains bearish with examination of stochastics, which suggests the bigger picture is a deflationary back drop, which would impact everything ex the US Dollar.
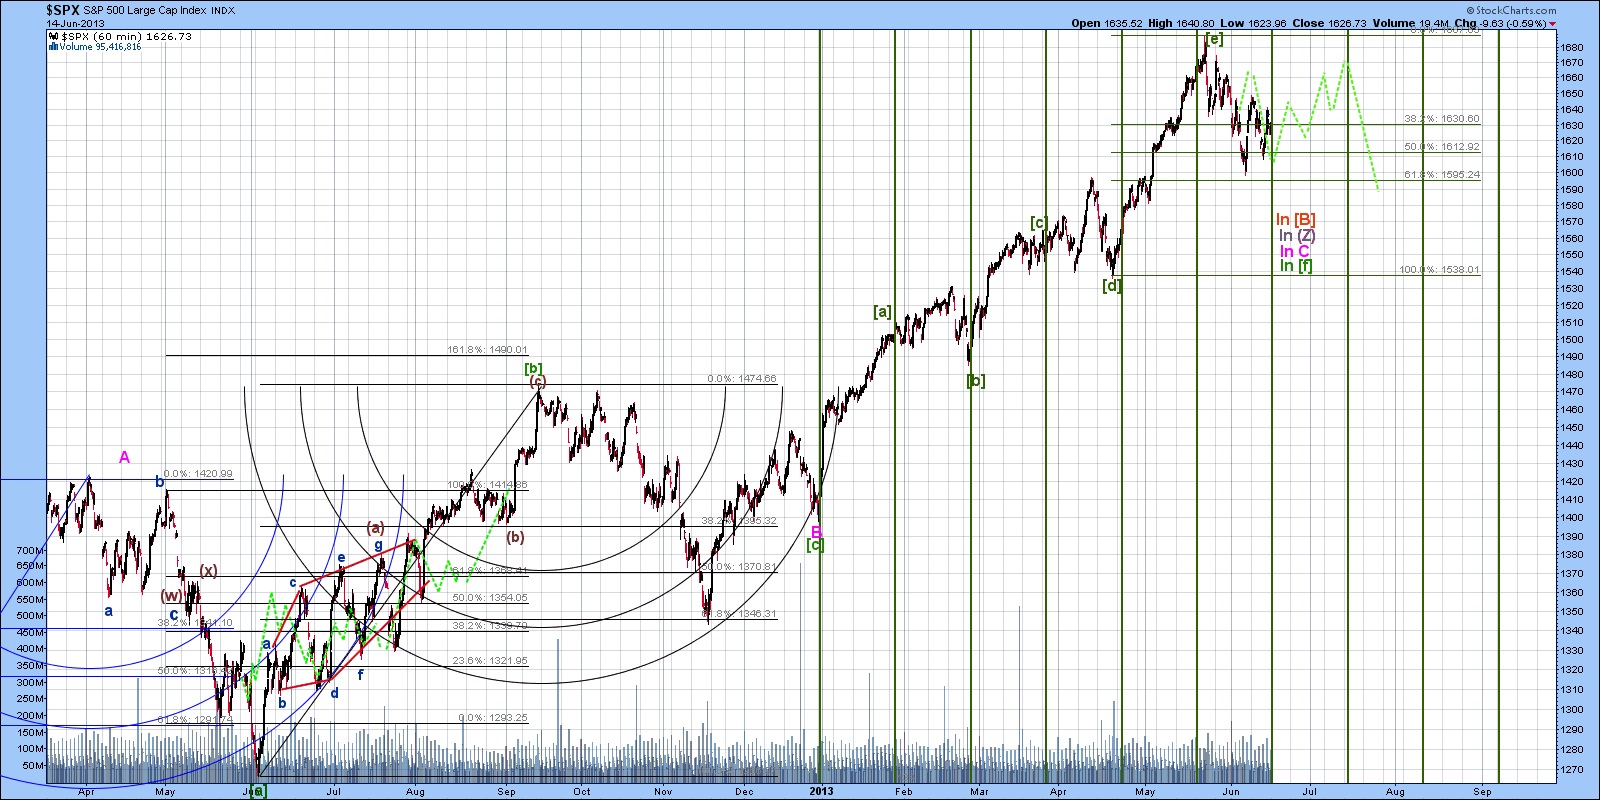
- The short-term Elliott Wave count of the S&P 500 Index has one more leg up to at least retest the May 22nd 2013 high no later than Thursday this coming week and should top out by mid July. A rounding top is expected to continue to develop over the summer.
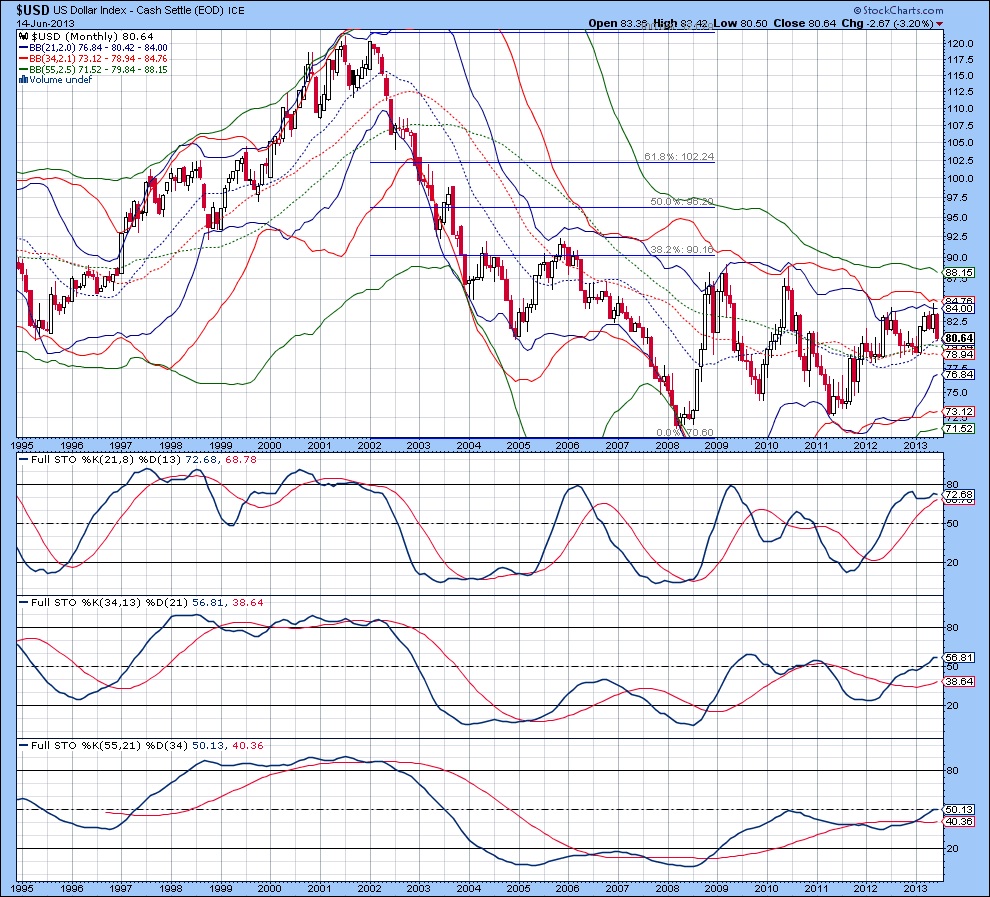
- The monthly chart of the US Dollar Index is showing a building trend for a move to the upside. The sharp move down this past month was not expected and altered the wave structure to indicate a more gradual rise rather than a sharp move that charts were indicating.
- The XOI Elliott Wave count has followed patterns to the highest degree for everything that I track and it is pointing to a top in October 2013. While the energy sector rises, it is expected that weakness in other sectors will see a rotation into energy, which will merely extend the rolling top.
The following charts will illustrate the points mentioned above and what to expect over the coming months.
The daily chart of oil is shown below, with a convincing breakout of an upper triangular trend line that has been developing since February 2013. This created an inverse head and shoulders pattern that has a measured move to $111/barrel, which makes any oil related ETF a buy. Full stochastics 1, 2 and 3 are shown below in order of descent, with the %K above the %D in 1 and 3 and beneath the %D in 2. With the %K in stochastics 2 and 3 appearing to be hooking up, expect another 3-4 weeks of further sideways to upward price action before any sort of a top is put in place. Rising oil prices will translate into higher prices for any processed item or goods requiring transportation (food, clothing, manufactured goods etc.), which could put the breaks on the economy. The UFC is in Winnipeg Manitoba tonight (where I live) so this is probably the most anyone in the US would know about this city. Gasoline prices are $1.35/L (L = Litre) and there is talk that it could reach up to $1.50/L. There are 3.78 US gallons per L, so doing the math, it is easy to see that we are paying over $5/US gallon up here in the Great White North, with oil prices at $96ish/barrel. If oil goes to $110/barrel, then $1.50-1.60/L is in the cards. Energy prices are one of the key items that will keep an economy running or put on the brakes, so it will be very important that oil prices do not overextend. Otherwise, another recession would likely be triggered.
Figure 1
Click to Enlarge
The monthly chart of gold is shown below, with a price excursion beyond the lower 21 MA Bollinger band for the third consecutive month. Full stochastics 1, 2 and 3 are shown below in order of descent, with the %K beneath the %D in all three instances. When gold took out the 2 year horizontal support back in April, it changed the dynamics of this market, with lower prices likely in the not too distant future. The %K in stochastic 1 is still headed lower and has provided no indication that a bottom has been put in place. Although an oversold condition is developing, it could still take anywhere up to 6-8 months before an extremely oversold condition finally results in a move to the upside. If the price of gold were to head lower, it could result in people being forced to liquidate, which in turn could drive prices lower. The general back drop of the economy suggests deflation as people must now start paying down debt. If I were to summarize what lies ahead, a drop to $1000-1100/ounce is highly probable, followed by an 8-12 month rise by $400-600/ounce and then one leg to at least retest the lows, maybe worse. The currency crisis that lies ahead will be resolved by gold bullion, and based upon the CFS, it appears that some time between mid to late 2015 into 2020 is likely to be the period of time when extreme prices in gold that have been discussed over the past decade occur.
Figure 2
Click to Enlarge
The mid-term Elliott Wave count of the S&P500 Index is shown below, with the thought pattern forming denoted in green. Based upon this count, a bottom is due on Monday or Tuesday, followed by a rise into mid-July to either at or below the May 22nd high. If this pattern is correct, then a market top should be confirmed and should be followed by a series of higher lows as the broad stock market indices begin to roll over. We were bullish from 2009 until May 2013, so the Contracting Fibonacci Spiral theory should at least be respected for what potentially could occur. Again, if it were by chance to skip this time post, then the aftermath of a 2016 top would be very intense to the downside. With the CFS, it indicates market tops and with the next one due in 2016, there in theory should be in theory a decline ranging anywhere from 30-50% between now and then, followed by another strong move to the upside. This is why caution should be exercised at this point in time....the downside may not occur, but then again it might. Remain alert with respect to the broad stock market indices at this point in time.
Figure 3
Click to Enlarge
The monthly chart of the US Dollar Index is shown below, with Bollinger bands not providing any real clear indication of trend. Full stochastics 1, 2 and 3 are shown below in order of descent, with the %K above the %D in all three instances. Extrapolation of the %K in Stochastics 1 and 2 have sideways price action that conforms to the market price action of the past year. With rising oil prices, it fits with the inverse correlation that it has to the US Dollar. There are other factors, such as supply and demand, political stability, conflicts around areas that produce the majority of the globe's oil supply etc., so rising prices for oil have many different dials that help to gauge how high prices rise...the US Dollar is just one of them. The expected trend of the US Dollar after its correction is complete is to head higher...more analysis on this with next week's analysis.
Figure 4
Click to Enlarge
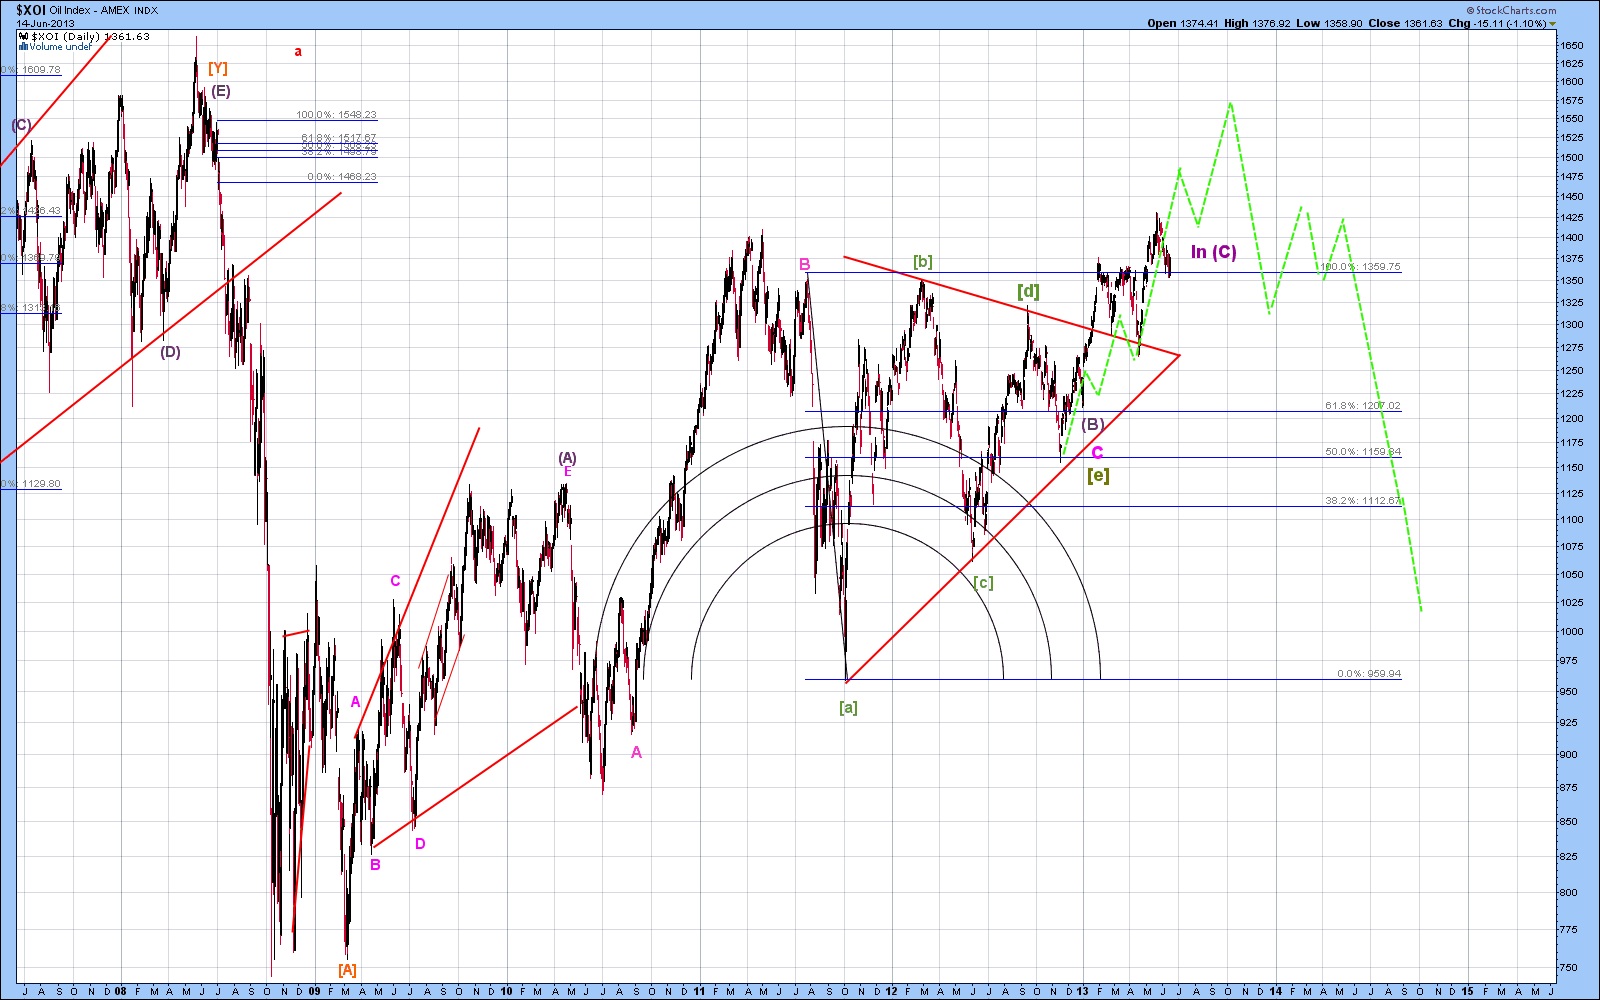
The long-term Elliott Wave count of the XOI is shown below, with the thought pattern forming denoted in green. The pattern broke out of a triangle, with wave (C) thought to be forming at present. If this pattern is accurate, then a top is not expected until sometime around October 2013. This scenario fits well with rising oil prices, which in turn raises profits of energy companies. So, out of everything that I can see, oil and related stocks appear to have the best short-term potential profits.
Figure 5
Click to Enlarge
That is all for today...back tomorrow with an update of oil, natural gas and the XOI. Have a great day.
David Petch
June 18th, 2013

Copyright © 2013 treasurechests.info Inc. All rights reserved.
Unless otherwise indicated, all materials on these pages are copyrighted by treasurechests.info Inc. No part of these pages, either text or image may be used for any purpose other than personal use. Therefore, reproduction, modification, storage in a retrieval system or retransmission, in any form or by any means, electronic, mechanical or otherwise, for reasons other than personal use, is strictly prohibited without prior written permission.
Disclaimer: The above is a matter of opinion and is not intended as investment advice. Information and analysis above are derived from sources and utilizing methods believed reliable, but we cannot accept responsibility for any trading losses you may incur as a result of this analysis. Comments within the text should not be construed as specific recommendations to buy or sell securities. Individuals should consult with their broker and personal financial advisors before engaging in any trading activities as we are not registered brokers or advisors. Certain statements included herein may constitute "forward-looking statements" with the meaning of certain securities legislative measures. Such forward-looking statements involve known and unknown risks, uncertainties and other factors that may cause the actual results, performance or achievements of the above mentioned companies, and / or industry results, to be materially different from any future results, performance or achievements expressed or implied by such forward-looking statements. Do your own due diligence.
 David Petch is a cofounder of www.treasurechests.info which has been in existence since 2003. His technical analysis focuses on Bollinger bands, stochastics (using daily, weekly and monthly charts), as well as extensive Elliott Wave analysis. His recent discovery of the Contracting Fiboancci Spiral the broad stock market indices are trapped in has indicated every major top since its inception in 1932. The CFS cycle also identifies expected major tops between now and 2020. David holds a BScH and MSc in Microbiology.


