Market Turning Points


Current position of the market
SPX: Long-term trend – In 1932 and 1974, the 40-yr cycle was responsible for protracted market weakness. The current phase is due this year but where is the weakness? Has man (Federal Reserve) finally achieved dominance over universal rhythms or has it simply delayed the inevitable?
Intermediate trend – We are looking for the move from 1905 to end, after which a much more serious correction should start.
Analysis of the short-term trend is done on a daily basis with the help of hourly charts. It is an important adjunct to the analysis of daily and weekly charts which discusses the course of longer market trends.
WILL THE ECB’S QE MAKE A DIFFERENCE?
Market Overview
Last Thursday, ECB President Draghi announced the implementation of a program similar to that of the Fed’s QE to support the flagging European economy. What effect will it have on the European and US markets? One can speculate but, in the end, the answer will come from technical analysis and that of supply/demand relationships. So we will just treat this news as one of the many factors which affect the stock market – and pretty much ignore it.
Last week, I stated a number of conditions which pointed to a potential market correction. Let’s see if any of these conditions have changed: We’re still in the month of September! That has not changed!
Momentum: The weekly MACD has lost its upside momentum and has made a lower low followed by a lower high, but it is still positive and the pattern remains much stronger than it did at the last two major highs (2000 and 2007), so it gives no indication that this bull market is close to being over. That does not mean than an intermediate correction cannot take place. The daily MACD is far more vulnerable to an imminent market decline. It has made a lower low followed by a lower high, both resulting in negative divergence to the price. If its lines make a bearish cross, a decline should follow.
The daily SRSI has been overbought for three consecutive weeks with not even the hint of a correction during that time. Indicators can remain overbought for a long time, but not toward the end of a trend. Sooner or later they will have to give, and from the looks of the hourly MACD and SRSI, it should be sooner!
Breadth: The McClellan Summation index is probably the best way to analyze the intermediate A/D condition. Its current configuration is reminiscent of the July 2013 formation which preceded the September/October 2013 correction. Since we happen to be at the same time of year, why should we expect anything different?
The daily A/D oscillator looks weak! It has already given a sell signal and gone negative with plenty of negative divergence. Under these circumstances it would be easy to understand why prices should follow.
VIX continues to hold well with positive divergence lows in the face of a new high by the SPX on 8/26 and on Friday’s rally, as well.
Structure: Looking for confirmation that primary wave III has topped and that we have started wave IV. This should take place when wave 5 from 1905 is complete. It is still unclear if even wave 4 (of 5) is complete. A limited correction could clarify that issue.
Accumulation/distribution: The SPX has now built a P&F pattern which can generate a conservative count of about 65 points. This would correspond to a .618 retracement if nothing changes and the count achieves its full potential.
Chart Analysis
The analysis of the daily SPX chart (courtesy of QCharts.com) should be pretty straightforward. From the low point of 1905 to the making of a new high, the index has moved in a well-defined primary and then secondary channel. In the last few days of trading, SPX has traded sideways from one wall of the channel to the other in what could either be a consolidation pattern or a topping formation.
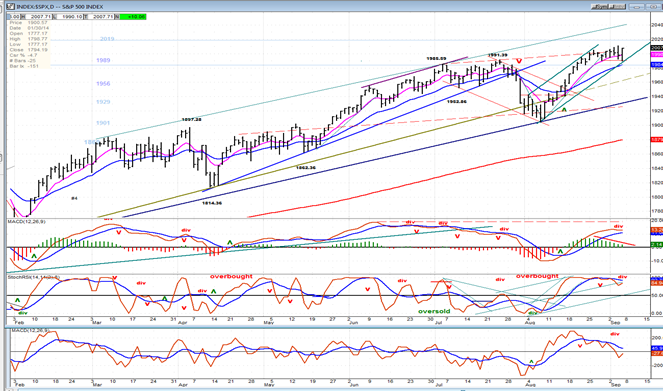
On Friday, it found support at the top of the previous high (1989.79) which closely corresponded to the bottom channel line, and it rallied. It now has to determine if its wants to start a new uptrend from here; or fall back, break out of the channel and start a correction. The answer should come early next week.
The indicators are beginning to roll over (with the A/D leading the way) but they have not yet given a conclusive sell signal. If SPX closes below 1990 – even on an hourly basis – a correction would probably be under way.
Let’s see if the hourly chart provides a more decisive answer. (It does not!)
The index originally moved in a steep blue channel from which it eventually exited, even back-testing the channel line and being pushed back in what could be the beginning of a downtrend if it does not make a new high. I have given it the benefit of the doubt, tracing out the parameters for another channel which would be rising at a lesser angle. Should this be valid, SPX could have another push downward, find support at the channel line, and move higher to complete wave 5 of the rally from 1905.
If it moves below the confines of the green channel, then we are looking at a much greater correction which could retrace 50% or more of the rally from 1905.
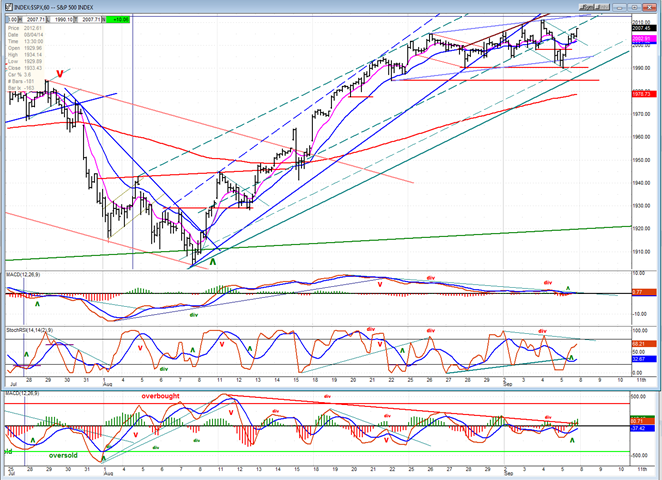
The indicators have turned up with Friday’s rally, but not before making a new low without positive divergence. Nevertheless, since they are in a new uptrend, we must wait for the price to reverse before they can give a decisive sell signal.
A resolution to the intention of the SPX should come early next week. The odds appear to favor a correction before the index makes another new high to complete wave 5. I would also remark than neither the IWM nor even the bullish QQQ looked anxious to make new highs on Friday -- especially the former!
Cycles
September 11 is scheduled to be a cycle low (unless it inverts). This increases the possibility that SPX is currently making a short-term top.
Time will reveal if the 40-yr cycle came in early (2009) or is still to arrive -- perhaps in 2016.
Breadth
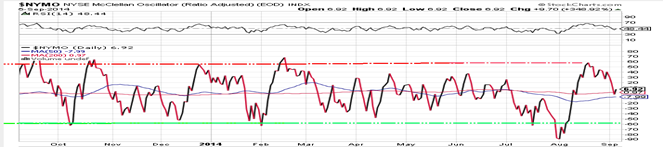
The McClellan Oscillator and the Summation Index appear below (courtesy of StockCharts.com).
The McClellan oscillator has retraced from overbought to practically neutral. If it drops lower it will be because we have started a market correction. Its action has caused the Summation index to arrest its upward move but it has not yet rolled over. It has also caused its indicators to start turning down, but not enough yet to give a sell signal. The near-term market trend will depend on what happens to the oscillator next week.

Sentiment Indicators
The SentimenTrader (courtesy of same) long term indicator remains at 60. It may have to reach 70 once again before we get to the top of the move. (no change)
(Some of the following charts are courtesy of Qcharts.com)
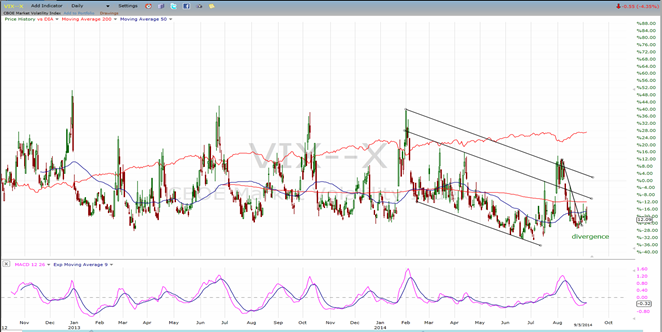
VIX (NYSE Volatility Index) - Leads and confirms market reversals.
VIX continues to hold its ground as SPX is making new highs. This is causing positive divergence in VIX and, as you can see in previous instances, it is often a precursor to a break-out in this index. Note also that the MACD is about to make a bullish cross. Completing the process could come as the SPX begins to correct.
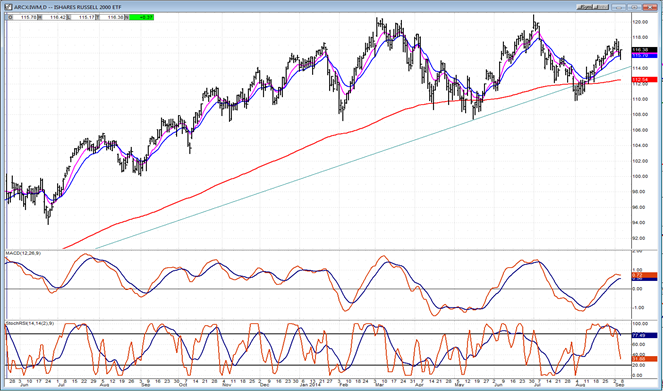
IWM (iShares Russell 2000) - Historically a market leader.
It is easy to see that IWM is lagging the stronger indices making up the overall market. IWM has found support twice on its 200-dma. If it should break it decisively, this could lead to a deeper correction than in the last two instances.
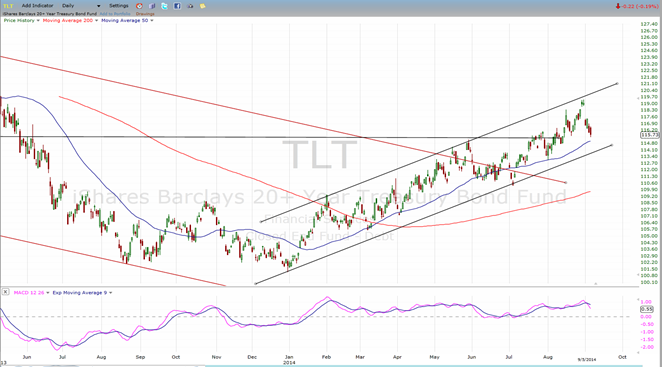
TLT (20+yr Treasury Bond Fund) – Normally runs contrary to the equities market.
It was suggested in the last letter that TLT could find resistance at the top of its bullish channel. It did and is pulling back. Perfectly normal so far!
GLD (ETF for gold) – runs contrary to the dollar index
GLD has broken below its lower support line. So far, it’s not a significant break and the current short-term downtrend is not proportional to UUP’s current short-term uptrend. When UUP starts to correct, this may be bullish for GLD over the near term. But how much of a rally can be accomplished by GLD is open to question.

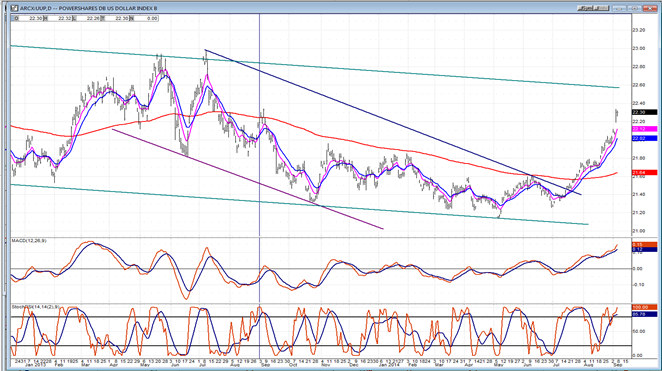
UUP (dollar ETF)
You can easily see why GLD is having trouble going up. I believe that UUP can reach 22.50 before starting a consolidation pattern.
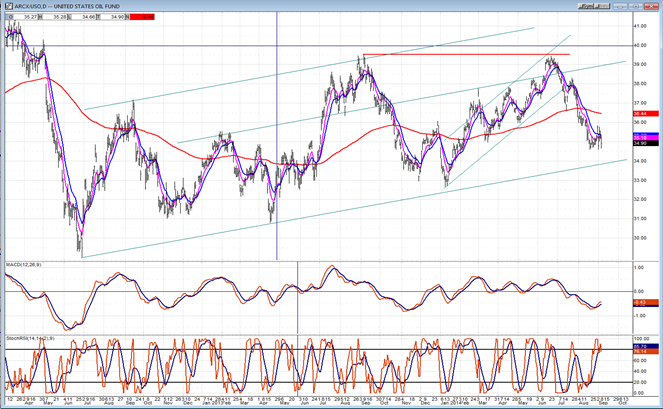
USO (US Oil Fund)
USO may have a little more to go before it finds some good support. Then what? Probably nothing very bullish!
Summary
Last week, it was evident that SPX found sellers as soon as it posted a new high. This resulted in an attempt at starting a correction but it, too, suffered the same fate in reverse.
If Friday’s rally runs into the same problem when the index reaches its higher level, it will be a (final) warning that down is the direction of least resistance, and it could result in a much needed correction of 3 or 4 days which would help to clarify the short-term structure.
If SPX should start a protracted decline which threatens to go below 1905, it will tell us an entirely different and much more negative story. This is not expected at this time.
********
FREE TRIAL SUBSCRIPTON
Market Turning Points is an uncommonly dependable, reasonably priced service providing intra-day market updates, a daily Market Summary, and detailed weekend reports. It is ideally suited to traders, but it can also be valuable to investors since highly accurate longer-term price projections are provided using Point & Figure analysis and Fibonacci projections. Best-time reversal estimates are obtained from cycle analysis. An increasing use of EWT for structural analysis and the recent addition of CIT (Change In Trend) time slots has greatly improved the exact timing of reversals.
For a FREE 4-week trial, send an email to: [email protected]
For further subscription options, payment plans, weekly newsletters, and for general information, I encourage you to visit my website at www.marketurningpoints.com. By clicking on “Free Newsletter” you can get a preview of the latest newsletter which is normally posted on Sunday afternoon (unless it happens to be a 3-day weekend in which case it could be posted on Monday).
The above comments and those made in the daily updates and the Market Summary about the financial markets are based purely on what I consider to be sound technical analysis principles. They represent my own opinion and are not meant to be construed as trading or investment advice, but are offered as an analytical point of view which might be of interest to those who follow stock market cycles and technical analysis.

When Andre Gratian was a stock broker years ago, a friend introduced him to technical analysis of the market. Consequently, it is not an exaggeration to say that Andre fell in love with this approach! Ever since then, it has become an increasingly important part of his professional life. Gratian has studied the works of Wyckoff, Edwards & Magee, Edward J. Dewey (cycles) and many others. However, one of my most profitable undertaking has probably been to study Point & Figure charting, which he finds invaluable in analyzing stocks and indices. If he were restricted to one methodology, this is the one that he would choose. This well-rounded background has given him what he feels to be a special insight into the stock market, facilitating the recognition of meaningful patterns and the ‘turning points’ in all trends, whether they be short or long term. Andre feels very comfortable discussing the stock market and passing on meaningful information to others. His subscribers include individuals and money managers throughout the world. Moreover, his Newsletters are currently published on several financial sites, here and abroad.


