Mendacity Is A System Of Lies
Mendacity, like Janet Yellen’s “growing economy”, is a system of lies. With “economic growth” managed by politicians, economists and bankers how else could it be? These self-described “policy makers” are comfortable dealing with half-truths and deception. Economically speaking, their chief concern is that key statistical data series for “growth”, and inflation as well as their contrived valuations for the financial markets remain above question for fear the truth could cause their house of cards to come tumbling down.
This has been my opinion for years, but this week the Financial Times reports "a cluster of central banking investors have become major players on world equity markets" so maybe I’m on to something. Geeze Louise; the Financial Times informs us that these central banks have purchased $29 trillion dollars of assets in the global financial markets. With that kind of money, we can be sure the college professors in charge of “monetary policy” have “injected” a heavy dose of “stability” into asset valuations. As a consequence of this “policy” central bankers undoubtedly removed a significant percentage of the shares formerly traded daily on the stock market. As money today is merely a legal fiction, a tool of “policy”, what, if anything, is stopping these professors from purchasing 100% of the float for every publicly traded company in the global stock markets? And what happens when they have to sell? What if they decide they never have to sell?
In the past few years I’ve documented a new and bizarre phenomenon in the stock market: how since January 2000 the historical relationship between valuation and trading volume at the NYSE going back to 1900, has apparently been turned upside down. In an unmanaged market, rising trading volume indicates rising demand for stocks, which resulted in rising stock market valuations up until January 2000. Declining trading volume indicates falling demand for stocks which resulted in falling stock market valuations up until January 2000. But note in the chart below and the table below it how trading volume peaked during significant post January 2000 market declines (#1-4).
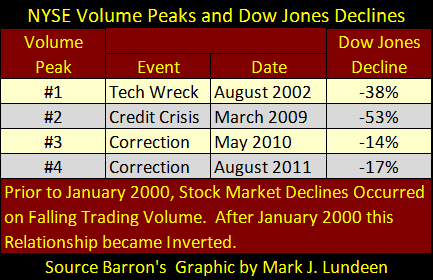
We’ll never know how far the stock market would have declined in 2002 & 2009 had the Federal Reserve not intervened. However, only the fear of repeating the depressing 1930s would have motivated a “cluster of central banks” to use such massive monetary inflation to purchase stocks at prices far above what the free market was willing to pay. Since the stock market’s low of March 2009, incredibly the Dow Jones has increased 159% on a 62% decline in NYSE trading volume. This could only be possible if the 29 trillion dollars from central banks had greatly reduced the quantity of shares trading in the American stock markets – so this must be the case.
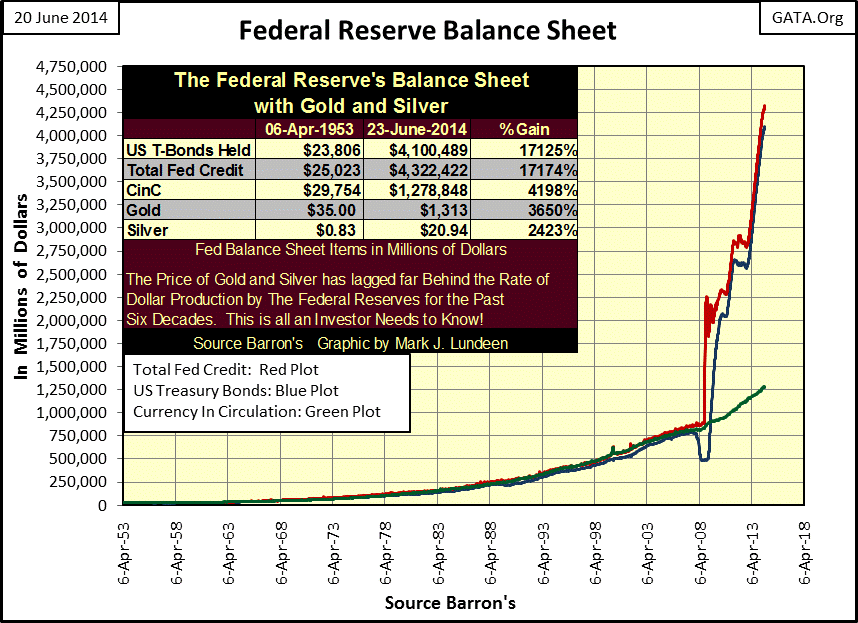
When one realizes that central banks “inject liquidity” into their economies by purchasing debt with monetary inflation (translation: money created out of thin air / money at no cost to the central bank), then this revelation by the Financial Times has ramifications beyond the stock market. Below is a chart of the Federal Reserve’s balance sheet; the Blue Plot charts only the Fed’s purchases of US Treasury debt; the Red Plot includes other items such as toxic mortgages the Federal Reserve has been monetizing since early 2008. Using this data members of the FOMC want us to believe that they have monetized only about $8.3 trillion dollars in financial assets in their “management” of the US dollar.
However in light of the Financial Times report of the $29 trillion dollars purchased by central banks in the global financial markets, the plots on this chart must hugely understate the total volume of dollars issued by the Federal Reserve. Doctor Bernanke has as much as admitted that the Federal Reserve was monetizing the stock market in this quote from a 2011 interview on CNBC.
“Policies have contributed to a stronger stock market just as they did in March 2009, when we did the last iteration of this. The S&P 500 is up 20% plus and the Russell 2000, which is about small cap stocks, is up 30% plus.”
- Doctor Benjamin Bernanke, CNBC Interview with Steve Liesman 13 Jan 2011 (1:40 PM).
It takes much more than just jawboning by the Fed Chairman to move the S&P 500 up 20%. As the American stock markets are the largest in the world, it’s not difficult believing that half, or even more of the $29 trillion came from the Federal Reserve to “stabilize” American stock and other asset valuations. No wonder the Federal Reserve can reduce its monthly QE purchases of T-bond and mortgages by tens of billions with little effect on the financial markets; instead they have been directly monetizing the stock market and who knows what else that’s not being reported on its balance sheet? Remember during the credit crisis when the Federal Reserve extended $13 trillion dollars in credit to European banks? Do you see that reflected anywhere in the Fed’s balance sheet?
Since the Federal Reserve’s creation in 1913, they have never had to submit their assets and liabilities to a public audit; and they’re not going to start now since they know central banking could never survive if the truth was revealed. When Alan Blinder was selected as the Fed’s Vice Chairman in 1994 he was as giddy as a schoolgirl as he made the circuit of financial news programs. From program to program he told all who would listen to him:
“The last duty of a central banker is to tell the public the truth.”
- Alan Blinder, Vice Chairman of the Federal Reserve
The above statement is documentation that a central banker told the public the truth at least once. Here’s doctor Blinder’s bio from Princeton University.
http://www.princeton.edu/blinder/bio.htm
It’s obvious he’s an influential left-leaning academic who is much loved in Washington as he is a proponent of big government solutions for problems best left to private individuals in a free market. When the economic system he helped construct inevitably comes crashing down, we can count on Doctor Blinder and his ilk blaming “unfettered capitalism” for the fall.
Look at the US national debt (below) and ask yourself what in the hell are the politicians in Washington spending all this borrowed money on? Absolutely nothing that will produce a profitable return. Here’s why Uncle Sam is always rolling over his old debts: these borrowed funds are mostly being squandered to buy votes in the next upcoming election. But mainly these funds are spent with the intension of creating a class of citizens whose dependence on government is absolute – call it what it is: socialism. Washington’s appetite for spending borrowed money will eventually result in ruin for all; either when the debt market refuses to rollover past debts that span back to the Great Depression, or when the Federal Reserve becomes the sole purchasers of US Treasury debt.
The most frustrating thing is that what is happening in American today is that it is nothing new. The 20th Century was an epoch where a self-appointed intelligentsia imposed their version of a socialist utopia on billions of people resulting in total war between the state and its citizens who desired nothing more than to enjoy the fruits of their labor. Aside from the many international wars from 1917 to 1989, a hundred-million people were murdered by their own governments during the 20th century to institute socialism. I’m not saying that Washington intends to murder its citizens. I certainly hope not, but desperate politicians are known to do desperate things to maintain their hold on power, and during a crisis politicians are willing to consider options that were unthinkable during the good times.
This is a point not dwelt upon by academics today, and we should all be concerned that proponents of big government like Alan Blinder, Janet Yellen and yes, President Obama, are apparently blind to the coming crisis. There can be no doubt how this exponential growth in the national debt will end; in chaos with all too many people demanding the government do something to solve the problems the same government created. Like Lenin said in 1917: “the worse things are, the better it is for us.” That’s an awfully cynical view of the world, but currently there are many people in the Democratic party who began their political careers in anti-Vietnam War, left-wing pro-communist organizations during the 1960s because they really didn’t like America or limited government then, and still act like they don’t like it now.
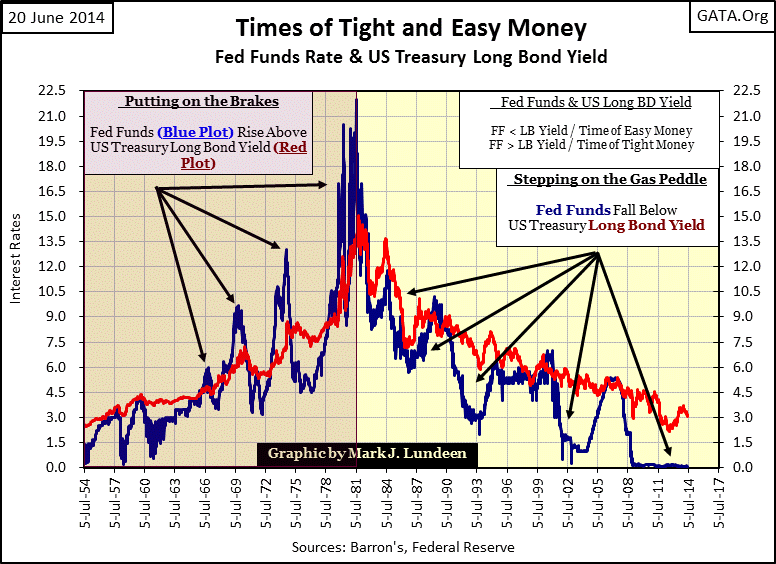
Let’s take a quick look at the last sixty years of “monetary policy” as seen below in the interplay of the Fed Funds rate (Blue Plot: 90 day money) controlled by the Federal Reserve and the US Treasury long bond yield (Red Plot), which until the last decade was a market driven interest rate. Times of “tight money” and recessions occur when the blue plot approaches, or actually rises above the red plot. Times of “easy money” or booming economies occur when the blue plot declines far below the red plot, though since 2008 this hasn’t been true. The Fed Funds rate has effectively been pegged at ZERO since December 2008 (six years) with little discernible effect on the economy.
“Monetary policy” in the chart below can be divided into two eras:
- 1954-1981: the weaning of global commerce from a stable gold back currency.
- 1981-2014: the world’s financial markets become addicted to monetary inflation.
I say the first era was the weaning of commerce from a stable currency because that’s exactly what it was. Unlike today, before and after World War 2 merchants and consumers worldwide had a basic understanding of how the old gold standard worked. They appreciated the stability a limited money supply (a gold standard) imposed on political and economic systems, although the “policy makers” hated the gold standard for that same reason.
"So far as I can discover, paper money systems have always wound up with collapse and economic chaos. --- When you recall that one of the first moves by Lenin, Mussolini, and Hitler was to outlaw individual ownership in gold, you begin to sense that there may be some connection between money, redeemable in gold, and the rare prize known as human liberty."
- Congressman Howard Buffett (Father of Warren Buffet) from a 1948 issue of the Commercial and Financial Chronicle
Compare Warren Buffet’s father’s affection for gold in 1948 with the contempt for it by his business partner in 2010.
“I don't have the slightest interest in gold. I like understanding what works and what doesn't in human systems. To me that's not optional; that's a moral obligation. If you're capable of understanding the world, you have a moral obligation to become rational. And I don't see how you become rational hoarding gold. Even if it works, you're a jerk."
- Charlie Munger, Warren Buffet’s business partner at the University of Michigan Late Sept 2010.
No doubt about it; the “policy makers” were successful in weaning the world off the gold standard and addicting it to cheap money and credit, and they broke American and international law in the process. The gold hoarding point made by Munger really shows today’s general ignorance on the old gold standard; gold would be hoarded in a gold standard during a credit crisis brought about by imprudent banking, but in a gold standard gold also circulates in the economy as money. The modern notion of warehousing gold didn’t begin until FDR confiscated US gold coinage in 1934, only to be melted down into 400 ounce bars and stored in the US Treasury’s new bullion vault at Fort Knox Kentucky. So maybe Munger was calling FDR a jerk.
Here’s a table listing a small sample of articles on banking, gold and the US dollar from the dusty old pages of Barron’s. The economic problems we struggle with today were predictable decades ago and so a long time coming.

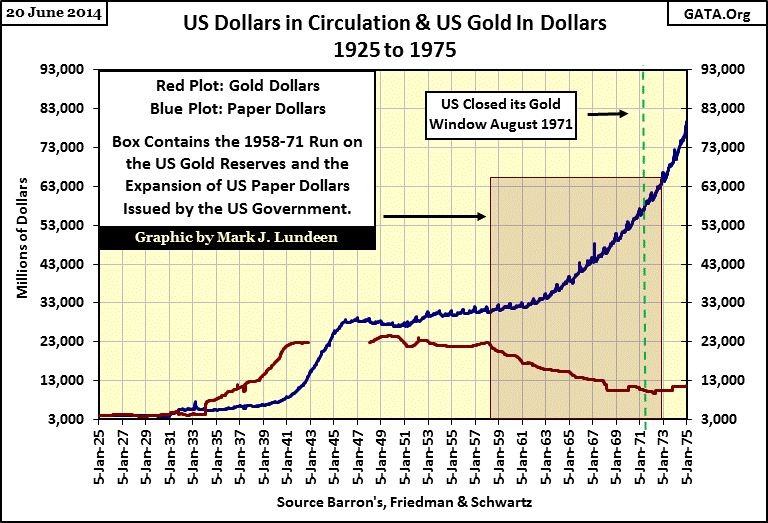
Back to the chart above; from 1954 to 1981, in the face of rising bond yields and consumer prices the Federal Reserve was forced to tighten its monetary policy frequently and severely as the world was in rebellion against its inflationary, and illegal monetary policy seen below.
The October 1979 article should be of special interest to us all. Thirty-five years ago a trend developed in Europe where hotels and restaurants began refusing payment in dollars for services rendered. It would be a mistake to believe the current mismanagement of the US dollar will not have similar consequences in the global oil market.
In 1981, with US Treasury long bond yields at 15% and just beginning a three decade decline that would eventually bottom at 2.15% in August 2012, the world changed its mind on the subject of monetary inflation. Paul Volcker and Alan Greenspan became central-banking superstars as monetary inflation no longer flooded into consumer prices, but into the stock, bond and real estate markets. It’s easy to see this profound shift in market sentiment in the credit spread between the Fed Funds rate and US Treasury long bond yield below.
Before 1981, the Federal Reserve had the yield curve inverted (Fed Funds above US Treasury long bond yield = tight money and hard times) more frequently than not. Beginning in the 1960s, each new cycle of tight money was more extreme than the previous one, until Paul Volcker eventually raised the Fed Funds rate to 22% in 1981, far above the US Treasury’s long bond yield (see two charts up).
After 1981, monetary inflation no longer flowed into the gas pump but gushed into Wall Street. The Federal Reserve became a serial blower of inflationary bubbles in the world’s financial markets as is evident in the chart above. Rarely did the Fed invert the yield curve, and when they did it wasn’t by much, but every time they did an inflationary bubble popped somewhere in the financial markets.
The Leveraged Buyout mania (LBO: bubble #1) popped in the late 1980s. Greenspan’s response to that was to lower the Fed Funds rate 5% below the US T-bond yield which ignited the high-tech bubble (bubble #2). He began tightening monetary policy in the mid-1990s, eventually popping the high-tech bubble in 2000. Greenspan then flooded the financial markets with “liquidity” again in the early 2000s lowering the Fed Funds rate a full 5% below the T-bond yield in 2002 which inflated the mortgage market bubble.
Greenspan may have begun the mortgage bubble, but it was Doctor Bernanke who terminated it by raising the Fed Funds rate a mere sixty basis points above the T-bond yield in early 2007. If you compare Bernanke’s 2007 yield inversion with the pre 1981 inversions, you get a sense of how fragile the US dollar economy had become. Our largest bubble (#4) is in the bond market, although stock and real estate prices are also being inflated.
There is no way that Janet Yellen is going to raise the Fed Funds rate above the T-bond yield until monetary chaos forces her to because when this bubble pops, interest rates will soon be at double-digit levels. This will result in many hundred-trillion dollars worth of interest rate derivatives coming into the money, with the big NY banks as the losing counterparties. As happened in 2007-08 when the big banks defaulted on many trillions of dollars of derivatives written on US mortgages, they will again default on their obligations and face bankruptcy. And even if derivatives did not exist, this economy is too weighed down with debt to withstand even a small spike in interest rates, which would surely send it into a deflationary spiral rivaling the crash of 1929.
This is pretty depressing stuff. What can we do to protect ourselves from a global economic collapse? My next chart puts things into perspective.
It was only this week when we were informed by the Financial Times of the massive purchases central banks have been making in the financial asset markets, but the CBs have been “injecting” trillions into the financial markets for over a decade as evidenced by this quote by Warren Buffet from 2003.
“Give me a few trillion dollars and I will show you a good time too!”
- Warren Buffet (comments upon the economic recovery efforts of the Federal Reserve of 2003)
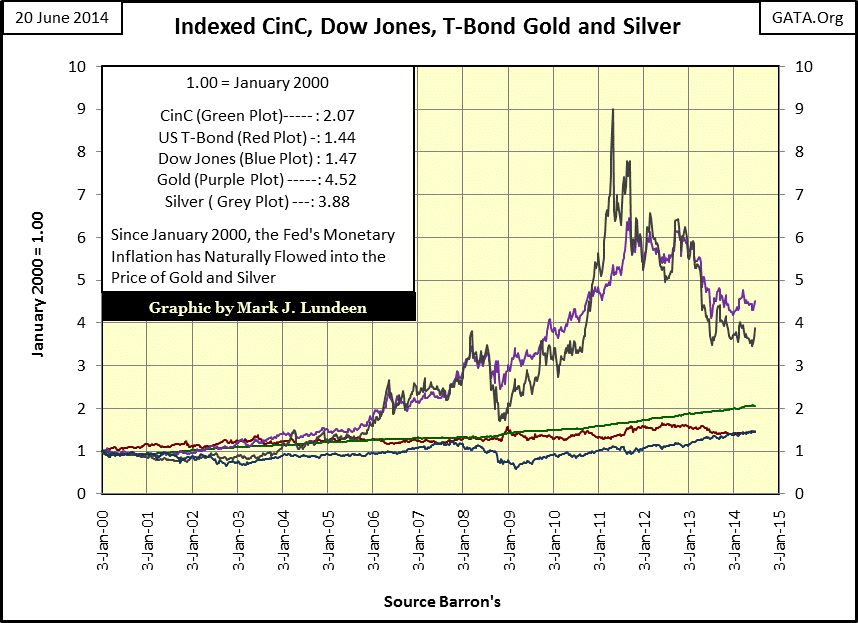
For all the money central banks have dumped into the stock market since 2000, the Dow Jones (Blue Plot) has only recently (late 2013) caught up to the capital gains in the US Treasury market (Red Plot), and both the Dow Jones and US Treasury bonds have gained significantly less than the rate of CinC expansion (Green Plot). That isn’t much of a bull market, but it’s the only bull market CNBC reports on.
Now let’s look at the bull markets almost everyone has been ignoring since 2001: gold and silver. No doubt about it; the old monetary metals have been in the dog house for the past few years. However, we should note that their current lows are far above the lows of their most recent correction in 2008; in addition, over the past year the bears have failed to drive precious metals prices decisively below the lows of last summer. Both gold and silver have seen some excitement this week. By Christmas I expect the market will stop worrying about gold and silver trending toward their lows of 2008, and will begin wondering when the highs of 2011 will be taken out. In a world where lying to the public has become Washington’s “policy” of choice, the old monetary metals are looking pretty good right now.


