More On Gold Sentiment


 Mark Hulbert on the HGNSI
As an addendum to Dan Popescu’s article on the state of gold sentiment, we want to show an update of the indicators we follow. Coincidendally, Mark Hulbert has also just published an update on his HGNSI measure (Hulbert Gold Newsletter Sentiment Index). The Index measures the percentage newsletter writers recommend to allocate to gold-related investments on average – either on the long or the short side. As it turns out, the current level of the HGNSI stands at nearly minus 47%, which happens to be the second-highest bearish sentiment expression in 30 years (the highest was recorded in June 2013).
Mark Hulbert notes:
“[...] the average recommended gold market exposure level among a subset of short-term gold market timers tracked by the Hulbert Financial Digest (as measured by the Hulbert Gold Newsletter Sentiment Index, or HGNSI). This average currently stands at minus 46.9%, which means that the average short-term gold timer is now allocating nearly half his clients’ gold-oriented portfolios to going short.
That is an aggressively bearish posture, which is unlikely to be profitable according to contrarian analysis.
There’s been only one time in the past 30 years when the HGNSI got any lower than it is today. That came in June 2013, when the HGNSI fell to minus 56.7%. As you can see from the accompanying chart, gold soon — within a matter of a couple weeks — began a rally that, by late August, had tacked more than $200 on to the price of an ounce of gold.
Notice that gold’s 2013 summer rally didn’t begin immediately after the HGNSI dropped to the levels we’re seeing today. That’s hardly a criticism, of course, since no trading system can pick the market’s turning points with pinpoint accuracy. Nevertheless, according to the econometric tests to which I have subjected the 30 years’ worth of my sentiment data, the gold market performs appreciably better following low HGNSI readings rather than it does high ones. Contrarian analysis hasn’t always worked, needless to say, but it’s more successful than it is a failure.”
There are of course good reasons for gold timers to be bearish. For one thing, gold has been mired in a descending triangle over the past year or so. From a technical perspective, such triangles are likely to be continuation patterns. Note however that the 1999/2000 low was also made after a descending triangle had formed in the course of about a year, so this pattern does not always resolve bearishly.
Gold fundamentals have recently worsened a bit though. The most obvious headwind is the continued strength in the US dollar, but this isn’t the only indicator that has turned more bearish lately (others are e.g. the flattening US yield curve, general weakness in commodities, the continued strength in risk assets and the associated faith in the omniscience of central bankers). Credit spreads on the other hand are still a supportive factor. However, no-one is going to ring a bell when the low is eventually made, and it seems likely that the news will mostly be bad for gold when it happens. Sentiment is definitely extremely subdued. Here is the chart of the HGNSI:
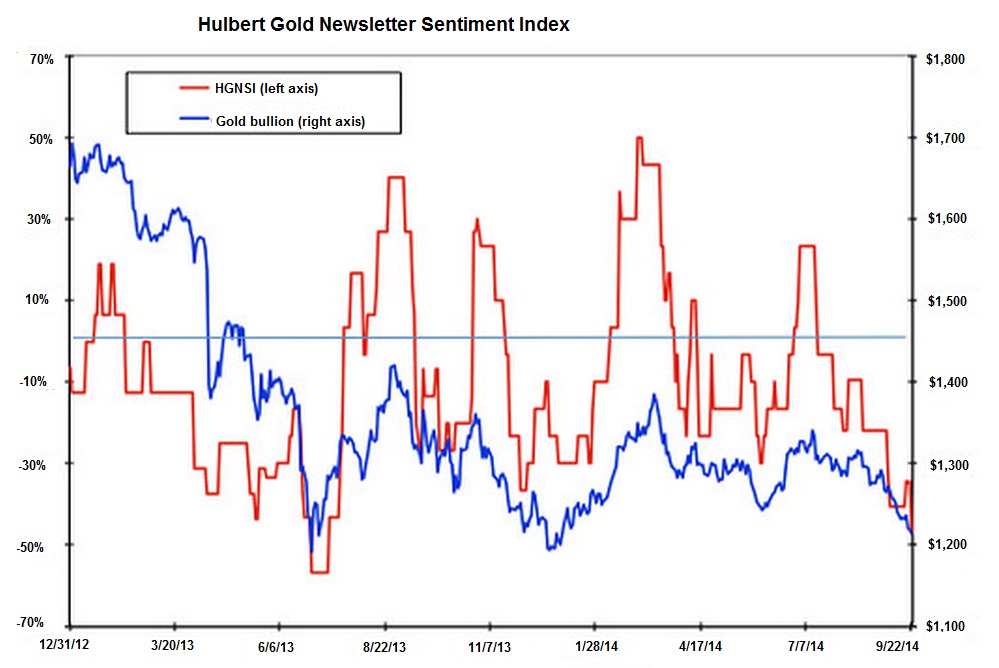
The HGNSI is now at minus 46.9%, the second worst reading in the past 30 years – click to enlarge.
A similar picture is indicated by Sentimentrader’s industry group sentiment table, which shows that gold and energy stocks are currently at the maximum bearish level they can reach by this measure:
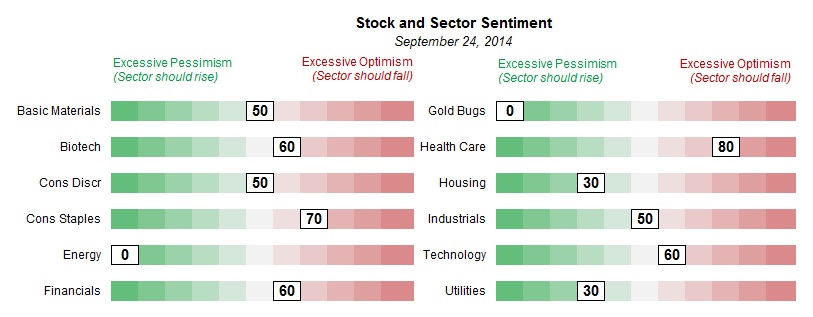
Sentiment on stocks in various industry groups – gold and energy are currently stuck at “zero bullish sentiment” – click to enlarge.
Other Sentiment and Positioning Measures
The next chart shows an update of the discounts to net asset value of closed end bullion funds, as well as Rydex precious metals assets and cumulative cash flows compared to the gold price.
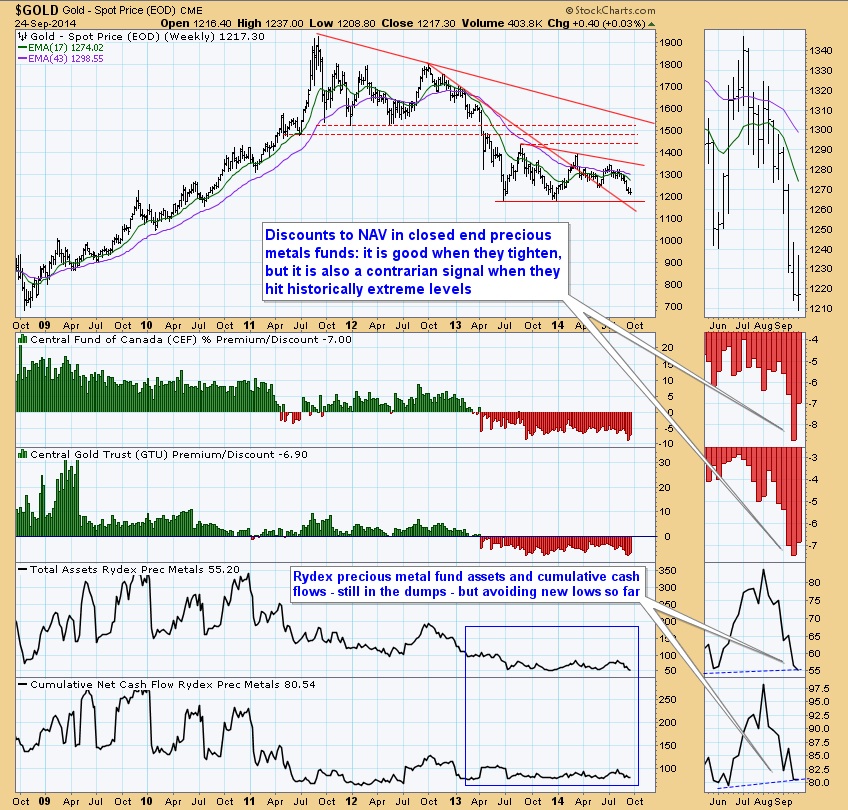
The discounts to NAV of CEF and GTU (closed end bullion funds). It is worth noting that both CEF and GTU have recently reflected even greater bearish sentiment than at the 2013 lows. By contrast, Rydex precious metals assets and cumulative cash flows still rest at slightly higher lows, which is partly due to gold stocks still diverging somewhat from gold – click to enlarge.
The positions of commercial hedgers and small speculators in gold futures continue to reflect the effects of the ongoing downtrend, but with regard to these data it must be kept in mind that these positions could still worsen markedly in a long term bear market. These positions are only extreme compared to those of recent years.
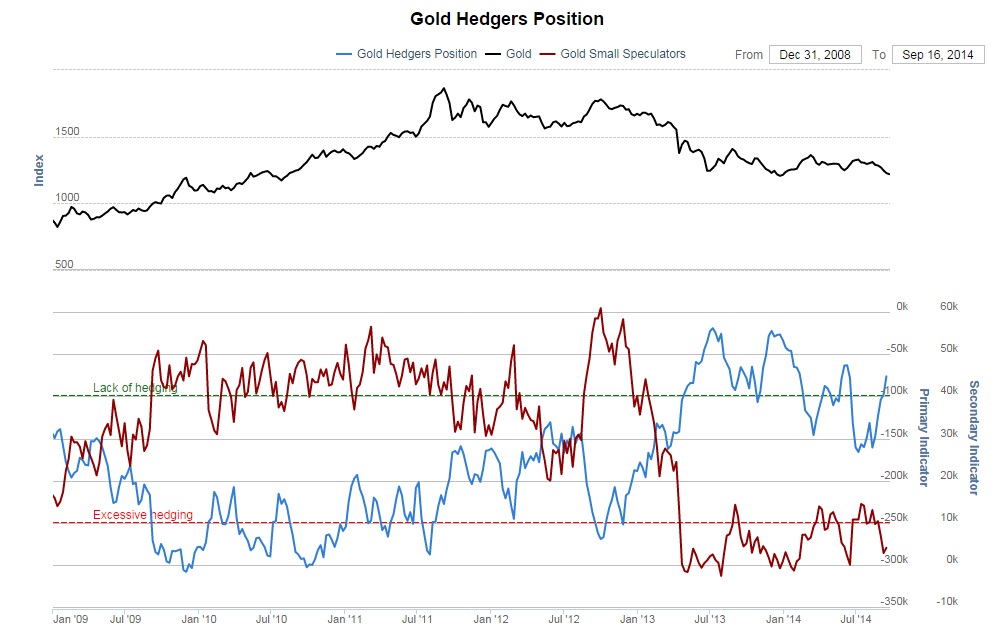
Hedgers and small speculators in gold futures – click to enlarge.
Relative Prices and Ratios
Gold stocks have weakened significantly in recent weeks, not only on an absolute basis, but also relative to gold. However, they still diverge from gold relative to the situation at the May low. Moreover, after briefly correcting against commodities, gold has recently begun to rise again versus the CCI. This is usually a subtle sign of declining economic confidence, akin to credit spreads.
Below are charts showing gold and the HUI, a comparison of GDXJ, HUI and the HUI-gold ratio, as well as gold versus commodities (gold-CCI ratio). GDXJ is still slightly diverging from the HUI as well (its divergence with GDX, which is not shown, looks similar).
A rising gold-CCI ratio is usually positive for gold mining margins, even if the nominal gold price is weak. However, when bearish sentiment becomes very pronounced, the market tends not to care much about this. Readers can easily ascertain that on an anecdotal level, a lot of bearish sentiment is in evidence as well. On average, the major financial news services (MarketWatch, Bloomberg, Reuters, etc.) publish between one to two bearish articles on gold every day recently, which is quite a density even by the standards of the past two years.
It can probably be taken as a given that the vast majority of market observers and participants expects the descending triangle to result in a break of support. Note in this context that silver has clearly broken through its long term support shelf already, which has presumably cemented the negative views on gold.
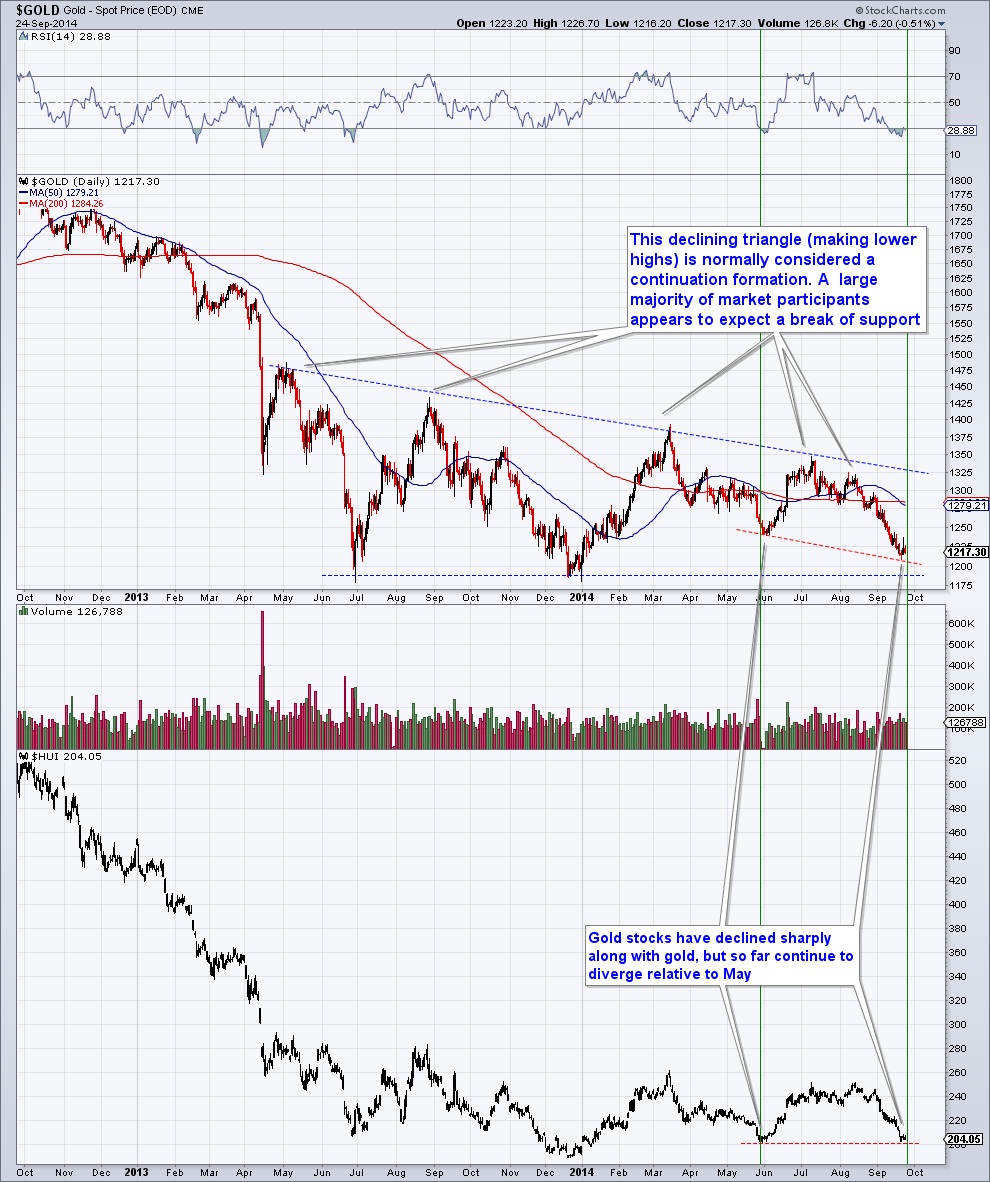
The descending triangle in gold and gold’s slight medium term divergence with the HUI index – click to enlarge.
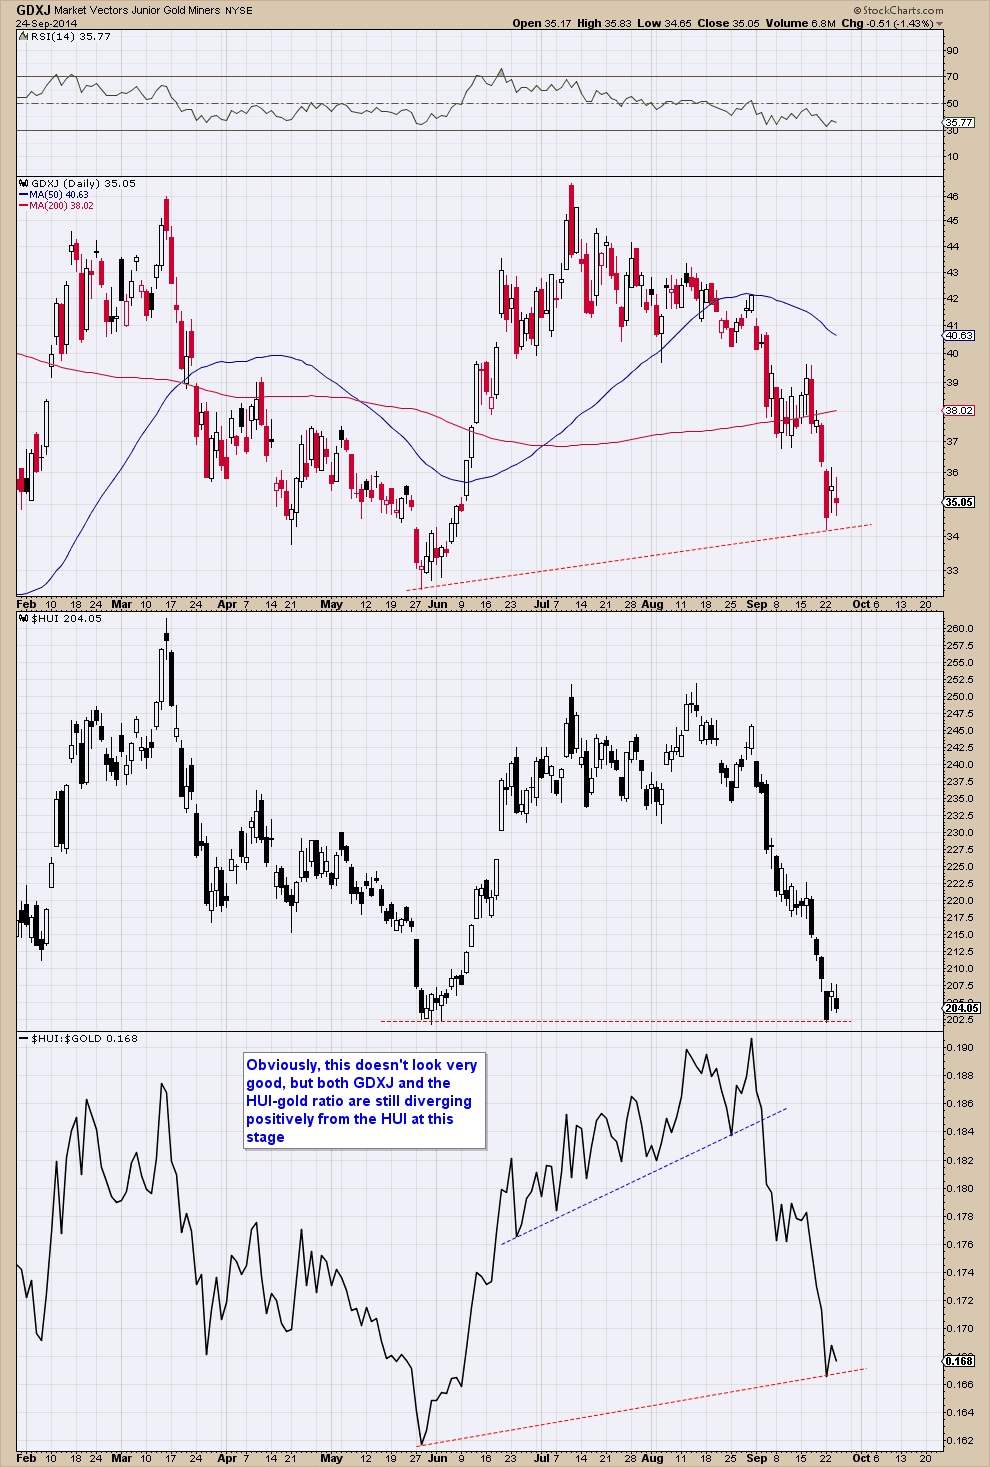
GDXJ, the HUI and the HUI-gold ratio. GDXJ has been stronger than the HUI, which in turn has been stronger than gold (on a medium term basis, not in the short term) – hence they all continue to diverge from each other for now – click to enlarge.
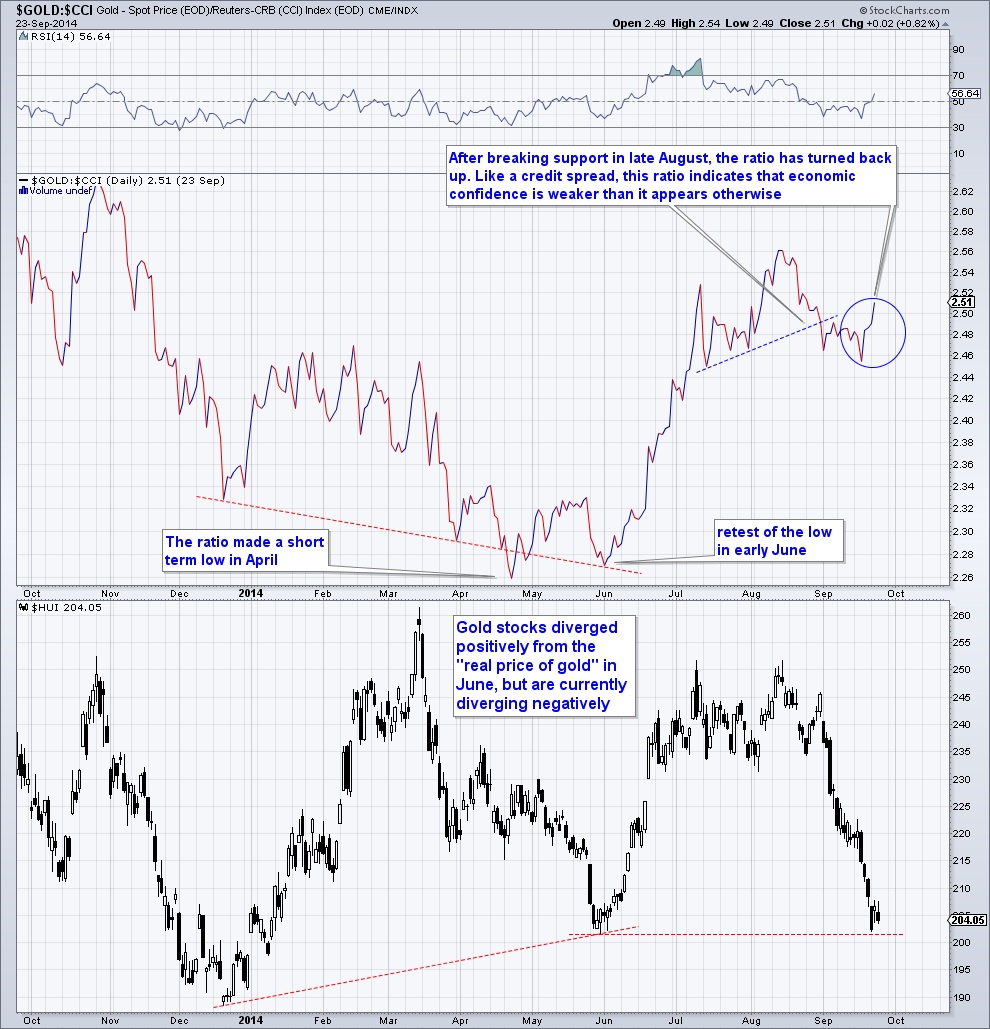
The gold-CCI ratio: after a one month long correction, gold has resumed its uptrend relative to commodities (in this case it means it is falling more slowly). However, after diverging positively from the ratio in June, gold stocks are currently diverging negatively from it – click to enlarge.
Gold and the US Dollar
After resisting the headwind from a rising dollar for quite some time, gold has finally succumbed, not least because the dollar’s uptrend has become quite relentless. The dollar index has in fact broken above a long term resistance level, so this is a serious problem for gold at the moment (gold continues to look a lot stronger denominated in foreign currencies). However, in spite of this, the dollar-gold ratio has not moved very far above its previous peak yet. In other words, gold has not been as weak as one would have expected based on dollar strength alone. This confirms that the dollar is far from the only factor influencing the gold price, even though it is obviously a pretty important one.

The US dollar index and its ratio to gold. The dollar’s recent strength has been relentless. Bullish sentiment on the dollar is accordingly quite skewed as well. However, foreign exchange trends have a tendency to be relentless once they get underway, so one should probably not read too much into current high bullish sentiment and overbought conditions, even though they argue at least for a short term reaction. See also the current bullish sentiment readings on the dollar mentioned below – click to enlarge.
Conclusions
Gold looks technically quite weak, and whether the slight divergences that are still in evidence at the moment are meaningful remains to be seen. However, since sentiment has reached extremes in both gold and the dollar, a short term trend change is likely quite close.
Note here that an average of the most important sentiment surveys shows the bullish consensus on the US dollar to be at 87% at present, which is in fact a record high. Investors are even more bullish on the dollar today than they were at its highs in 2000 and 2001.
The comparable statistic for gold is at 18% bulls, which is not a record low, but definitely among the lowest readings on record (most of the lowest bullish sentiment readings in gold were produced in 1998/99 and 2013).
Once a rebound gets underway, its technical quality and the evolution of the fundamental and sentiment backdrop will have to be assessed to see whether it is just another short term blip or something more. As Dan Popescu noted, it is certainly possible that gold violates the support levels of 2013 (given that it is only a little over 30 dollars above them), but such a break is not likely to be sustained in the short term in light of the current sentiment backdrop.
Charts by: Mark Hulbert, Sentimentrader, StockCharts
********
Courtesy of http://www.acting-man.com/


