Mr Bear Has A Purpose In Life; It’s Called Market Hygiene
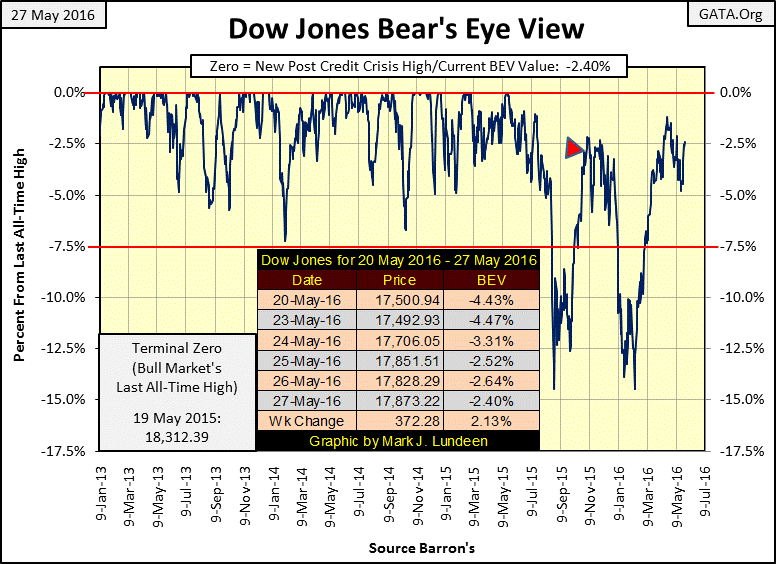
The Dow Jones Index had a good week. Early on it was at risk of declining below its BEV -5% line in the Bear’s Eye View chart below. That didn’t happen; instead, at the end of the week the Dow closed above its BEV -2.5% line. For a week in the market this isn’t anything to complain about; in fact one could take this as a sign of market strength. However, when looking at the Dow Jones BEV chart below, it’s becoming an embarrassment that given so many opportunities in the past year, the Dow Jones has yet to make a new all-time high. Until it does, this is a stock market that deserves no respect.
The current market advance began in March 2009. Since then the Dow Jones Index has seen seven years pass by with an advance of 180%. Even if the Dow Jones sees a new all-time high in the coming weeks or months, I wonder exactly what the bulls expect the stock market can do for them in the coming year. For the big bulls who manage “monetary policy” at the FOMC, they’ll be happy if they can keep the market from crashing before the coming November elections. It’s the little retail investor bulls I feel sorry for. These are the people who can’t find the courage to buy at the bottoms, and never have the insight to sell near the tops.
I placed a little Red Triangle on the BEV plot for October 2015. We’ll come back to that in a little bit.
Okay, the Dow Jones is within 2.5% of making a new all-time high. In the late 1990s (or from 2006-07), there would be some excitement somewhere on Wall Street over such a happy situation. But in May 2016 I can’t find any. If this was a real bull market, new NYSE 52Wk Highs is where I’d expect to find some excitement. However since the market’s February lows, the NYSE has rarely seen its daily 52Wk Highs break above 200.
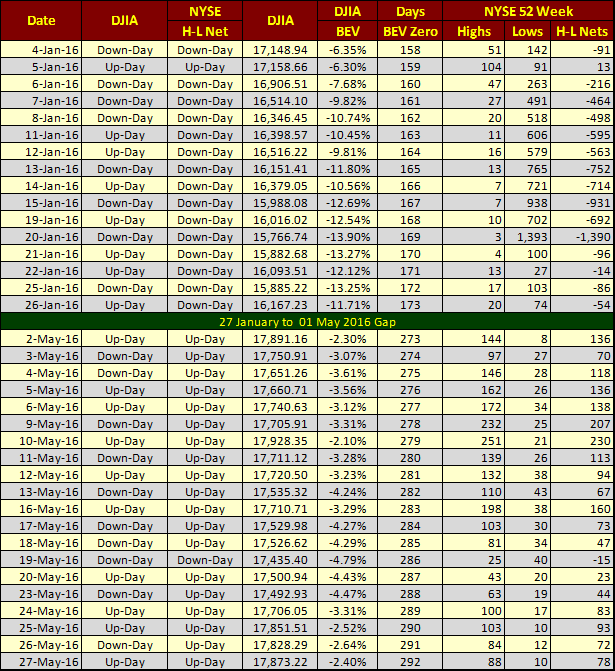
Look at the 52Wk Lows in the table below for January 20th. With the Dow Jones’s BEV plot breaking below -13%, the NYSE saw 1,390 new 52Wk Lows, and the days leading up to January 20th all saw their 52Wk Lows in the high triple digits. Mr Bear and his cleanup crew were getting some real work done in restoring market values back down to their economic reality. But the “policy makers” put an end to that on January 21st.
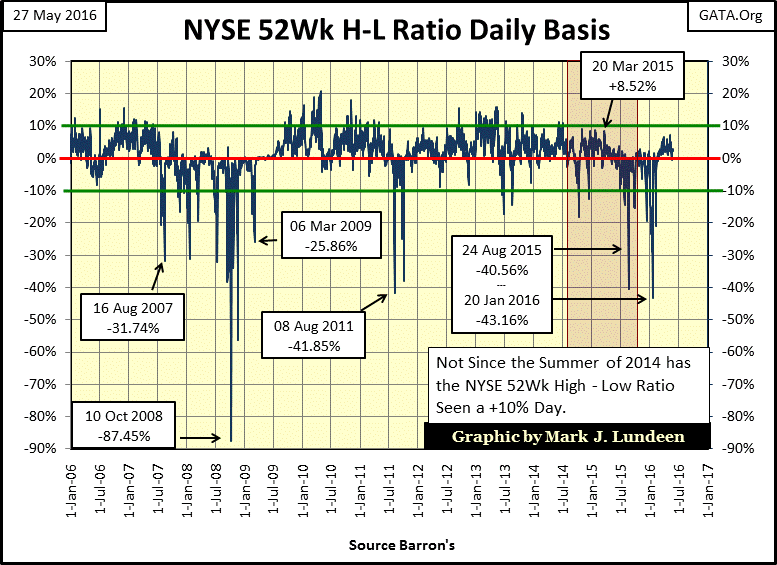
As you can see in the NYSE 52Wk H-L Ratio in the chart below, last January (last August too) saw a significant -40% decline. Seeing how the NYSE 52Wk H-L Ratio hasn’t seen a +10% day since the summer of 2014, and then having two -40% declines in less than six months, we should have seen more enthusiasm in the 3,100 listing trading daily at the NYSE; more 52Wk Highs on the stock market’s latest rebound.
Rather we see this; on April 20th the current advance in the Dow Jones came within 1.18% of making a new all-time high, yet on that day the NYSE could only generate 133 new 52Wk Highs; what’s with that?. It hasn’t gotten any better since then. If this market was left to its own devices, and didn’t have its valuations constantly “stabilized” by the FOMC, I’d have something to write about.
So you’ll have to excuse me if I believe this is a market that wants to go down, and would be much lower had the “policy makers” allowed nature to take its course. But then it’s an election year, and we all know how that goes.
So much for the stock market, here’s something interesting: electric power consumption (EP)’s BEV Plot for its 52Wk Moving Average has broken below its lows of August 2013 (next chart). EP hasn’t seen a new BEV Zero (new all-time high) since August 2008. Economic demand for electric power during the entire eight year Obama Presidency has been subpar, and so actual economic growth must have been too. Washington’s statisticians can lie all they want about “economic growth” or “full employment” but demand for EP is on the decline because business is going out of business in Obama’s America. Since last October it’s only gotten worse; from then to this week economic demand for electrical power has plunged.
As a bear on the markets and economy, I can’t help myself if when each week I download data from Barron’s, I mentally project bearish trends ever downward. All too frequently in the weeks and months following my prognostications I’m thankfully my totally incorrect predictions were never published. For example, at the time I had expected the August 2013 plunged in EP to go much deeper. Instead, in the chart below we see EP’s lows of August 2013 were followed by a recovery that didn’t terminate until October 2015. But EP’s current decline is something not seen since 2008-09; a sustained decline in demand for electrical power with no indication of a reversal. Will EP reverse upwards as it always has since December 2009? Or will it break below its lows of seven years ago and go deep into new lows? The bear within me says the latter is the case, but looking at EP’s BEV plot below, I may be wrong.
Go back to my above Dow Jones BEV Chart and note the Red Triangle on the plot. It identifies the October 2015 top in EP seen below. Everyone blames the January market decline on the Fed raising their Fed Funds rate twenty five basis points last December, and I’m sure that was a factor for the worst January in decades. But I find it fascinating that in the above BEV Plot for the Dow Jones, its August – November 2015 advance took place under a context of rising demand for EP, and its November 2015-Febuary 2016 double-digit correction occurred as EP was in a decline that continues to this day.
Looking at the economy, and the companies that trade in the NYSE from the perspective of their demand for electrical power, one has to wonder how the stock market has risen off its lows of February as corporate America is turning off the lights of its factories and floor space. If EP continues its current decline, how much longer can the stock market maintain its current lofty levels?
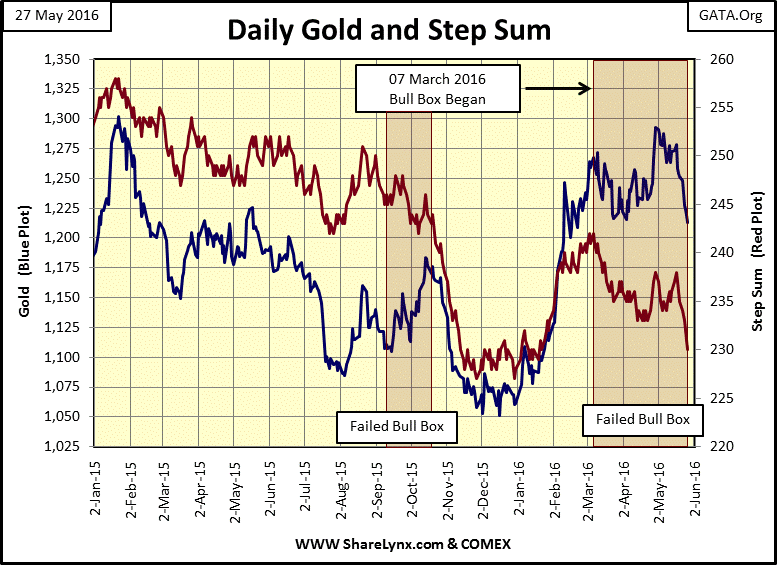
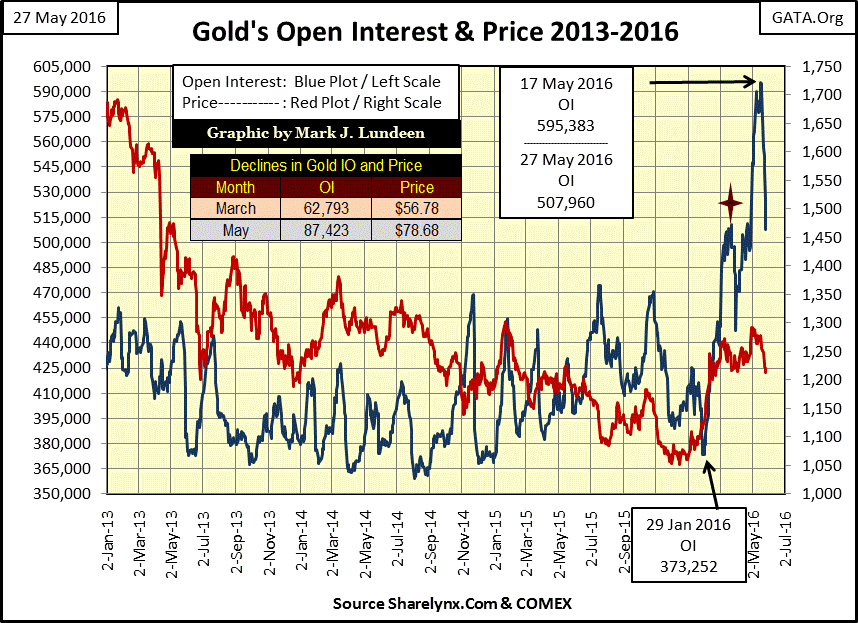
Last week I said that if the price of gold declined below its lows of April ($1215) I’d declare the bull box below as having failed. Well damn it, gold closed the week at $1212 and so a bull box in the gold market failed for the second time in less than a year.
What is going on here? As is painfully evident in the chart below, it’s the same old stuff; the big Wall Street bears are cheating once again in full view of their government regulators at the CFTC. They’ve done the same market maneuver twice in the past few months: run up COMEX gold open interest (OI) with promises to deliver tens-of-millions of ounces of gold they don’t have. As they do this they also take a significant long position. At the peak in OI, when the price of gold slows its advance, they used these long positions to flood the market with sell-at-market orders, intending to ignite a selling panic in the gold market.
Seeing not one, but two step-sum bull boxes failing in the past year is a bit traumatic for me. This isn’t supposed to happen! But the gold bull within me takes considerable comfort from what he sees in the chart above. The plunge in OI (Blue Plot) seen just last March (Red Star) and now again in May has had remarkably little effect on the price of gold (Red Plot). Nothing like the price decline the gold market saw in April / June 2013.
Have no doubt about it, these plunges in OI were and are vicious attacks on the price of gold. But when we consider that the price of gold at its lows of last December was only $1,050, the big bears on Wall Street can’t be happy that after causing a collapse of 87,423 contracts in COMEX gold open interest in past ten trading days, gold closed the week well above its lows of last December: at $1,212.
The question to ask now is whether the big bears currently have the ammo required to drive the price of gold below $1,200, or will they once again have to drive COMEX gold open interest up to still higher levels than what we saw just ten trading days ago to start the process yet again for the third time since the beginning of 2016.
For your information, here’s gold’s and silver’s step sum table. Gold’s 15 count is at a -5. As you can see it takes a lot of down days to make that happen. From an extreme in the 15 count such as a -5, we can expect a nice rebound in the coming weeks; hopefully one that will take gold back up to, then above its highs of late April.
I realize after all I said above, things look pretty bad. But keep in mind that for all the big-bad bear’s huffing and puffing, he hasn’t blown down the gold bull’s house just yet. In fact the old play book used by the big bears isn’t working as well as it has in the past.
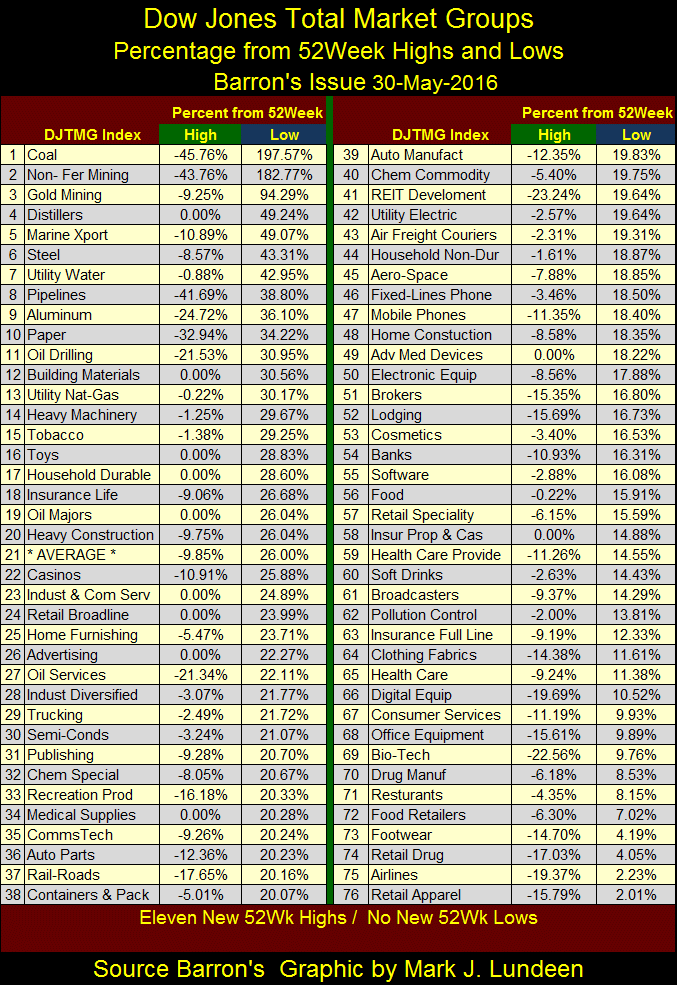
Here’s the Dow Jones Total Market Group (DJTMG) 52Wk High & Low table. I have to note that last week Dow Jones expanded their DJTMG dataset from 108 to 155 market groups. But you’ll note that my data below still remains at 76 groups, and I can promise you this will not change. The data I have with these 76 groups goes back to 1988, and 76 groups is a sufficient broad sample to provide an excellent insight to the market and the economy. As all I expect from the DJTMG’s is to provide a historical perspective of the market and economy, and as I’m now an old geezer who doesn’t expect to be around long enough to see the new groups properly age; I just ignore them. Just keep in mind that what I use is not all of what Barron’s publishes, and hasn’t been for years. Still it’s good data.
Coal, Non-Ferrous & Gold Mining continue holding on to the top three spots in the DJTMG. Coal and Non Ferrous Mining have advanced more than gold, but I think they’re just dead-cat bounces that won’t continue. Coal’s problem is that the Obama administration used the EPA to force their electrical utility customers to use natural gas. How do the coal miners recover from something like that? And as the base metal miners’ major market was China, and with China now at risk of going into a recession, I don’t know how much longer this trend will continue. Of the top three groups, I only like the Gold Miners for the reasons I’ve been covering for years. Everything else doesn’t interest me, but who knows what the future may bring to them?
At the top of all sustained bull market advances it’s just a fact of life that * THE * most successful investment portfolios contain items that were purchased not because they promised great returns, but in retrospect proved to be dicey ill-considered promotions that for a short period of time caught the fancy of the masses.
In the mid-1980s, it was finding the next corporative- victim of a “leveraged buyout” (LBO) before it broke into the news. In the 1990s it was the digital revolution with the internet being the new market place for commerce and the then new phenomena of cell phones. The mid 2000s introduced a revolution in credit and derivatives that allowed even the chronically unemployed access to quarter-million dollar, 30 year mortgages.
The current dicey promotion of near zero to negative yielding junk-grade debt (government bonds or otherwise) isn’t catching the fancy of the masses as they would have before 2007. The frenzy people had for internet stocks or flipping single family homes is missing in the current bubble inflating financial markets. Much of that has to do with the fact that the baby-boomers are not just wiser to the ways of Wall Street, but are also decades older. Their children have not taken the plunge into the markets because for the most part they are either burdened with school loans for degrees that haven’t delivered the promised economic returns, or are employed in low paying jobs, or both. No matter, the “policy makers” have for the fourth time since 1982, incited an apparent feeding frenzy with fiduciaries of other people’s money for debt that doesn’t offer a return.
I say an “apparent feeding frenzy” as I’m sure anyone so stupid as to actually believe it’s a good investment paying a government an annual 1-2% of principle for the privilege of lending it money, would ever be allowed to manage a pension fund or the reserves of an insurance company. Due to central bank intervention into the bond market, I suspect most fiduciaries have little choice but to purchase wildly overvalued junk-grade bonds, leaving most of the purchasing of negative rate bonds to the central banks themselves.
We live in a bizarre period of market history. Politicians, and their banker friends, hide behind their central banks’ god-like “policies”, “policies” that have destroyed the free market’s ability to discover true market prices. Valuations for stocks and bonds in today’s markets have no connection to economic reality; they’re simply what “policy” requires them to be. Angela Merkel; Germany’s chancellor tells it like it is:
“In some ways it’s a battle of the politicians against the markets. That’s how I do see it. But I’m determined to win this battle.”
- Angela Merkel: Germany’s Chancellor, May 2010. On the Euro Bailout of Greece.
“The primacy of politics over markets must be enforced.”
- Angela Merkel, Germany’s chancellor during the Greece Debt Debacle, 2011.
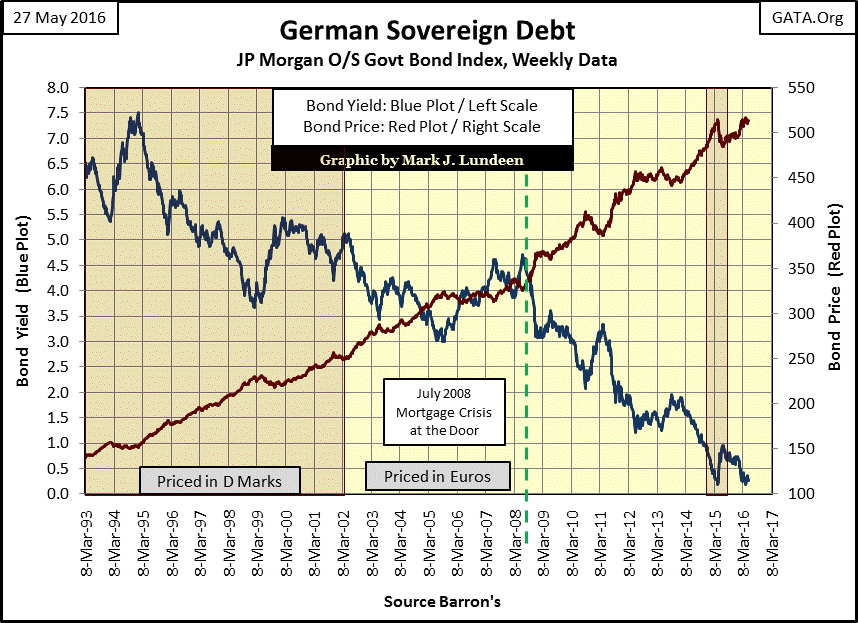
It’s true that Ms. Merkel was discussing the Greek debt crisis of a few years ago. But should the market demand that Germany’s sovereign bonds once again yield the 4.5% last seen in the summer of 2008, and not their current 0.26%, she would once again demand: “The primacy of politics over markets must be enforced.”
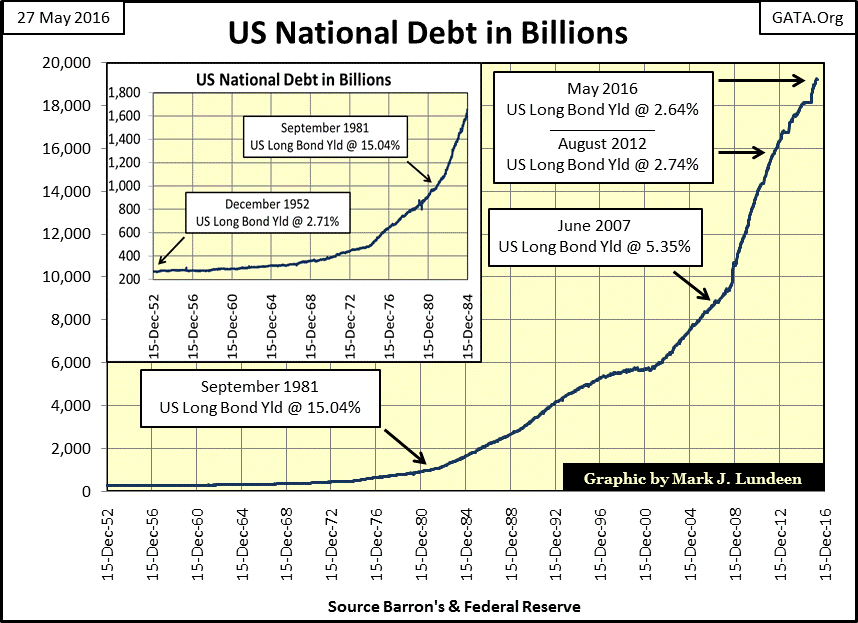
It’s this delusion that politics can veto market reality over the long term is what brought such economic devastation to the now defunct Soviet Union and Maoist China, as well as today’s Venezuela and Detroit Michigan. The United States too is infected with this political mental disorder. Seeing how long bond yields in May 2016 are actually lower than they were in December 1952 is proof of that.
Mr Bear has a purpose in life; it’s called market hygiene. If an asset is worthless, he is going to make its owner write it off as a total loss. If an asset is overpriced, he’s going to deflate its valuation until it finds its free market price.
The “policy makers” may believe that they can continue to create debt obligations by the trillions for the foreseeable future, but at some point in our unforeseeable future Mr Bear is going to put an end to all that! In the past I’ve predicted that before the next bear market terminates, the US Treasury, and everybody else who has taken on more debt than they can service will be forced into default by Mr Bear. I can’t say when this will happen, only that it will happen. Importantly; because all money currently circulating in the global markets is backed on debt, when sovereigns eventually default on their bonds the world will experience a historic deflation that will leave no one untouched. But all things come to an end, even massive deflationary bear markets, and that’s when you will be glad you have some gold and silver bullion.
Mark J. Lundeen


