Platinum False Break Low


Platinum has been trending down quite strongly in recent times however I think that move is now done with a low at US$1086 and a bear market rally is already in its infancy. Let’s investigate using the daily and weekly charts.
PLATINUM DAILY CHART
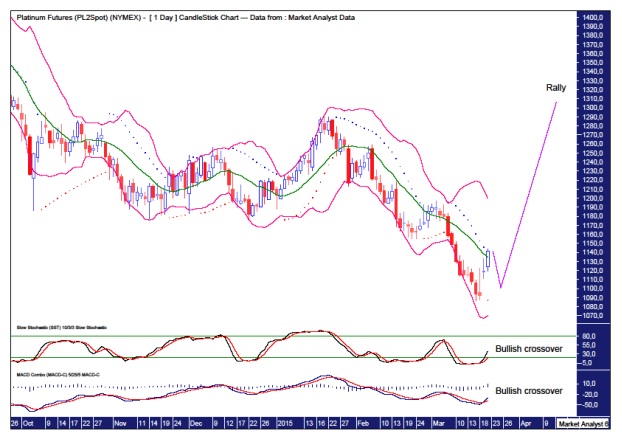
The Stochastic and Moving Average Convergence Divergence (MACD) indicators are both showing a bullish crossover.
The Bollinger Bands show price has left the lower band and is now at the middle band.
The Parabolic Stop and Reverse (PSAR) indicator now has a bullish bias after price busted the dots on the upside. I think price can come back down to test the dots that are now on the downside and represent support. Then, provided this support holds, price can launch even higher.
While all of these indicators are bullish they don’t tell us how significant this rally will be. The move up the last few days does look a bit more impulsive than recent rallies so that is one clue that things may be different this time.
Personally, I do expect a significant bear market rally now so let’s go to the weekly chart to see just how significant.
PLATINUM WEEKLY CHART

The lower horizontal line pertains to the previous swing low level which was the December 2014 low at US$1175. The move below this line looks to be setting up a false break low. The bullish weekly reversal candle lends credibility to that.
This recent low was accompanied by bullish divergences in the Relative Strength Indicator (RSI), Stochastic, Moving Average Convergence Divergence (MACD) and Momentum indicators. Nice.
So how high is this rally likely to trade?
I have drawn a downtrend line connecting the February 2013 and July 2014 highs. While this trend line may provide resistance, I expect price to break above it in a fake out move before the final rally high is made.
The higher horizontal line pertains to the July 2014 high at US$1523 and I doubt this rally will overcome that level.
I have added Fibonacci retracement levels of the move down from July 2014 high to recent low and I am targeting the 76.4% level at US$1420 to see in the final rally high. Perhaps a touch higher even.
And once that rally high is in place I expect the downtrend to resume.
********
My website is www.thevoodooanalyst.com
© 2014 Copyright The Voodoo Analyst - All Rights Reserved
Disclaimer: The above is a matter of opinion provided for general information purposes only and is not intended as investment advice. Information and analysis above are derived from sources and utilising methods believed to be reliable, but we cannot accept responsibility for any losses you may incur as a result of this analysis. Individuals should consult with their personal financial advisors. Put simply, it is JUST MY OPINION.


