The Red Line Is Bending


Last week the theme was that – just like a pressure cooker with the relief valve tied down – mounting pressure in the markets were closing up to the red line where an explosion becomes imminent. While it is impossible to name the exact day when it could happen, developments last week show that the red line is bending – the day of resolution cannot be far off. The FOMC decision to keep rates unchanged was a classic example of the old saying, “Buy the rumour sell the fact”. It took a day for the thought to sink in that if the economy was so weak that the Fed were compelled to reconsider their often stated intention to raise rates, then perhaps the DJIA and the US dollar are a little too strong for comfort. This week will reveal to what extent this statement really applies. On the other hand, increased uncertainty about what lies ahead, as contained in the Fed’s decision, was good for silver and gold. Now to wait and see whether these early trends really represent a new tipping point.
In the run up to Thursday, the consensus had become that increasing rates would be a disaster for a still fragile economy, but that the Fed had to maintain credibility by at least announcing a token increase – either a minute 0.1% increase or else a clear signal that whatever the increase is, it definitely will not be followed by other increases soon, if ever. Markets liked this majority view and reasserted the trends that were in place before uncertainty about what the decision would be took hold. Then afterwards reality intruded to bring home the fact that the Fed was willing to place its own credibility on the altar rather than risk triggering a major recession if they were to increase rates even minimally. Now it remains to be seen whether the main media will maintain their worn out message that green shoots are still there and growing, if a little slowly, or will they recognise and discuss the more sombre view of the fragile economy as implied by the Fed.
So far the markets appear to have taken little notice of the flood of migrants from the east and south into Europe. Perhaps it is viewed like a wave at the beach that rolls in and breaks to run out onto the sand and then retreats again to leave things much as they were before. What if it should be not a single wave, but a tsunami – a sustained flood that is being catapulted inland by a mass of water coming from over the horizon, causing massive damage as it continues to roll on its way? If that were to be, then the disruption it causes to economies and markets will be more severe than an equity bubble bursting in Shanghai; or a minor increase in rates.
The Chinese economy is still relatively sound and the US will still off-load full ship’s containers in its western ports; but can the European economy survive a sustained inflow of migrants and, once they are settled, also of their families and their friends – as well as absorb the cost to government of accommodating these new ‘citizens’? The migrants have already shown they have little regard for other’s property, laws and rules of behaviour; they travel not as desperate seekers of safety, more like an invading army demanding recognition and tribute. If they are perceived as being so successful, as is happening, the wave will not break and recede, but become a full blown never ending tsunami from Syria, Afghanistan, Iraq and also places in Africa. A far greater problem than the US itself experiences on its southern border and, as Europe suffers from the migrant problem, having a greater impact even on the US.
Euro-Dollar Chart

Euro-dollar, last = $1.1302 (www.investing.com)
The recent volatility continued last week, but still with an overall rising trend to sit on or above the support at the bottom of bull channel KL ($1.1288). While not the extreme bullish reaction when the Chinese stock market shocked US markets, it is clear that so far the euro is building a bullish base against the dollar.
By now the break above the steep bear channel, VW ($1.1065), is well established and it would come as a surprise if the dollar could rally strongly enough to force the euro below channel VW, let alone below the shallower bull channel, YZ ($1.0920).
Dow Jones Industrial Average (DJIA)
Initially, during the first gradual and mildly volatile part of the move lower, the DJIA held steadily above support along trend line L (17025); then, reacting to the shock out of the Shanghai stock market, the DJIA fell steeply to break clean through the support at line L, to spike lower and break below support at lines B (16600) and R (16397). As often happens in reaction to a shock, the spike reversed quickly, but was unable to recover and hold above line B. It is now resting on support of line R, but, if selling now continues ‘after the fact’, the bear trend should resume.

Dow Jones Industrial Index, last = 16390 (money.cnn.com)
Gold PM fix - Dollars

Gold price – London PM fix, last = $1141.50 (www.kitco.com)
The jump in the price of gold to marginally above line B ($1160) when the wheels fell off the Chinese stock market was not allowed to hold. Heavy selling quickly had the price briefly below the psychologically important $1100 level, then held close to that level until confirmation by the FOMC Thursday that the US economy was weak and fragile renewed interest in gold.
The price had recovered into bull channel KL ($1117) after the brief dip lower, then jumped on Thursday to firm further on Friday, breaking just above steep wedge ZR ($1121) again. The small break is bullish, but it is not something new and gold has to break clear above line B and extend higher to inspire any real confidence.
Gold PM fix - Euro

Euro gold price – PM fix in Euro, last = €1000.6 (www.kitco.com)
The euro price of gold had also now dipped marginally below major support at the bottom of triangle AS (€984) – for the third time in the history of the chart – then recovered quickly. On the two previous occasions, the recovery after a small and brief break below line S was followed by a good rally and it now remains to be seen whether the price will again set off on a new rally.
Gold’s jump was accompanied by a firmer euro, which meant that the response of the euro price of gold was muted and it is still holding below key resistance at line L (€1012), the bottom of its main bull channel. The euro price is still vulnerable and a break back into channel KL is needed to turn bullish, which would require the gold price to outperform the euro currency against the US dollar by a good margin. It will be very good for gold if that could happen, but is not certain. Perhaps, if silver could take a strong lead, gold may follow at a good clip.
Silver Daily Fix Chart
The price of silver moved right into the end of the steep pennant FZ ( F: $14.61, Z: $14.38) before the FOMC message sparked a rally that has now taken silver to just above the pennant. This happened at what is leg 7 of the pennant – different from the typical five legs that form in a narrowing chart formation – but something that is often seen on charts of the precious metals and of forex.
The presumption has always been that these extended chart formations develop where a market is being manipulated. It might not surprise to see similar extended patterns also in charts of stock and bond markets!
The price of silver has to extend above the resistance at line D($16.00) before one can feel more confident and comfortable that the bull has really returned. Until then it would be a positive for silver as long as support at either line F or line Z can hold.

Silver daily fix, last = $15.26 (www.kitco.com)
U.S. 10-year Treasury Note
Following the recovery after the brief spike break below bear channel VW (2.190%) and also below the 2% level, in response to the collapse in the China stock market, the yield has held in a tight consolidation mostly above line W. On Friday the yield again dipped just below the channel to have a bullish bias again, but is still some distance above 2%, which is where selling increases – probably the target for any concerned holders of bonds where they are happy to take profit.
The rally on Friday could well be sellers of equities on Wall Street who seek safety in the traditional safe haven – just as others now seek safety in precious metals. If a switch to safe haven assets continue this week, the US 10-year bond may join gold and silver in a continuation of the rally that was a feature late last week. But if the overhang of bonds out of China, actively disposing of these, is considered, any further rally in the bond market could be of short duration – more so if the 10-year yield were to approach the 2% level.
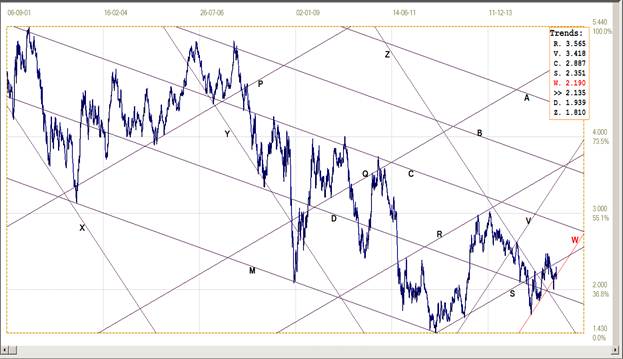
U.S. 10-year Treasury note, last = 2.135% (www.investing.com)
West Texas Intermediate crude. Daily close
The latest official EIA price from Cushing is for 14 September. After breaking below the previous firm support at line D ($44.84), the decline extended much lower, to spike down for a test of support at the top of the steep bear channel, UV ($34.18) at $38.50. Support there held and the price reversed just as steeply to break clear above line D, but still well short of resistance at lines Y ($52.39) and S ($53.48).
The new bearish move has broken below support at line D, but is holding just above the level of the recent double bottom around $43.40. A bullish bias remains in place while steep bull channel FG ($41.67) holds, but a definite break above lines Y and D is needed to turn bullish again.

West Texas Intermediate – Daily close, last = $44.07 (14 September)
©2015 daan joubert, Rights Reserved
chartsym (at) gmail(dot)com


