Signs Of Desperation


In the cartoons of my time, a steam pot that was going to blow showed clear signs of the impending explosion – the steam puffs coming out, the shaking and rattling and the circumference increasing. Much the same signs can be seen in the markets – volatile directionless oscillations, intra-day breakdowns that almost miraculously recover later in the afternoon. Almost all significant market action is tightly bound in a narrow range, as if two sumo wrestlers are standing chest to chest, stomach to stomach, straining heavily to gain the upper hand. Desperate efforts, even for gold and silver, despite the fact that they both have broken from major patterns.
It is not only the markets discussed in this report; look at the dollar index and in particular at the dollar-yen locked in a tight range, with only the euro displaying some volatility, but also still range bound. The Dax spent 3 weeks hardly moving, until breaking steeply lower last week – which could be a warning for other stock markets that are still tightly range bound, such as the DJIA. Some, like the euro and the yield on the US 10-year Treasury note, have broken below trend lines, but have not extended the breaks in order to remain in their comfort zones.
The proverbial quiet before the storm? October, the traditional stormy season is on us. Will it prove again that this is the time when key markets experience the strong winds that bring big changes to the financial landscape; ice storms and floods and tornados that bring hardship and privation to many, but hardly touch others. Will it turn out to be a case of, “Beware the Ides of October”?
Euro-Dollar Chart
The steep spike in the value of the euro in reaction to a sell-off in the Chinese stock market clearly shows the nervousness in the forex market. Since then the euro has settled in a tight range around the lower end of the spike, more tightly wound than it has been for quite some time, but still with good volatility.
In a one on one contact sport such as boxing or karate, one often sees opponents spending the opening minutes hardly touching each other, dancing and feinting as if ready to attack, trying to spot a pattern in the other’s reactions to the feints. This is the impression one gets from the euro-dollar behaviour over the past few weeks.
Greece was a major handicap for the euro, but now they have had an election and the agreed to solution is ready to be implemented in due course. Claims are being made of Greece getting on top of its problems in about 4 years, but these so much like election promises – good on the ear, but light on substance. Nevertheless, as the obvious problems in Europe – Catalonia aside – are no longer simmering focus could again move the US economy and this time it could be the dollar that gets sold off. For that to happen, the euro has top recover from the small break below support from line L ($1.1355) and then hold to bull channel KL.

Euro-dollar, last = $1.1195 (www.investing.com)
Dow Jones Industrial Average (DJIA)

Dow Jones Industrial Index, last = 16412 (money.cnn.com)
Initially, during the first gradual and mildly volatile part of the move lower, the DJIA held steadily above support along trend line L (17136); then the Shanghai sell-off spilled over into New York and the DJIA also fell steeply to break clean through the support at line L, spiking lower to break clear below the support at line B (16542). As so often happens in reaction to a shock, the spike reversed as quickly again, but here it was unable on two occasions to recover and hold above support at line B.
The consolidation just below and around line B could be evidence that the bears are not yet in control, but that desperate efforts to re-ignite the bull markets are really offering opportunities to off-load stock into a strong buyer climate. The question of which direction the next clear move begs an answer which could go either way – but if the message from the Dax is a warning, the bear will have its way.
Gold PM fix - Dollars

Gold price – London PM fix, last = $1146.65 (www.kitco.com)
The jump in the price of gold to now break well above the aged pennant at line R ($1116) still has to clear resistance at line B ($1160) before the new rally can have credibility. The previous attempt did break above line B, but then failed to hold. The new attempt would have the springboard of support along line L ($1122) behind it, which could make a difference.
It is widely accepted that the gold price cannot turn bull while there is ample gold available to satisfy demand for bullion. The large number of open contracts on FND compared to the relatively low decline in the Comex stock of registered gold, seems to be evidence that many speculators set up as if to want delivery, but then settle for what is likely to be a cash premium rather than the metal itself. This and other signs of difficulties with supply warns that the day of reckoning could be close.
Gold PM fix - Euro
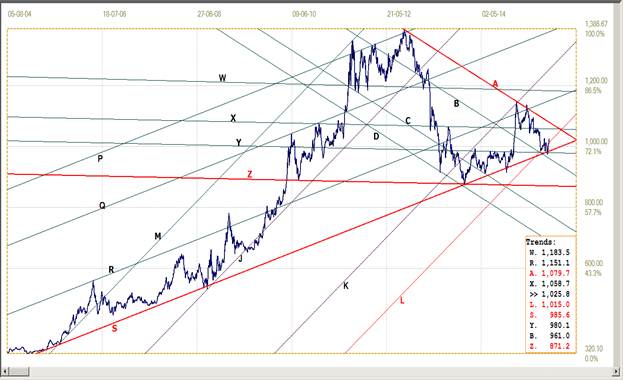
Euro gold price – PM fix in Euro, last = €1025.8 (www.kitco.com)
The euro price of gold dipped only briefly and marginally below major support at the bottom of triangle AS (€986) and – as it had done on two previous occasions - recovered quickly. The recovery has now broken back into bull channel KL (€1015) and could still emulate what had happened after the previous breaks below line S – starting off on a good rally, which now could take it higher to challenge substantial resistance at line X (€1058).
There are still much nervousness about the situation in the Ukraine. Social unrest has moved off the front pages and so too has the confrontation between the central government and eastern Ukraine, but the latter might have new troubles fomenting behind the scenes. The Ukraine might become a flash point to replace Greece as an albatross around Europe’s neck – and that of the euro – much to the advantage of the euro price of gold.
Silver Daily Fix Chart
The price of silver has made practically no headway during the two weeks it had broken above the long term pennant FZ ( F: $14.47, Z: $14.36), despite the price of gold enjoying a bit of a rally to mostly hold above the $1130 level. It reinforces my original contention that silver presents a greater threat than gold for the fragile status quo in the major markets. Silver already had to complete 7 legs before what may be the final break above the pennant, against the more common 5 legs in the case of gold. Strange behaviour in narrowing chart formations has long been seen in my study as a sign of intervention in the markets – largely because 7 legs in a narrowing chart formation is almost exclusively associated with the precious metals and forex; both of these frequently if not consistently targets for manipulation.
The price of silver has to extend above the resistance at line D($16.02) before one can feel more confident and comfortable that the bull has really returned. Until then it would be a positive for silver as long as support at either line F or line Z can hold.
Silver daily fix, last = $14.99 (www.kitco.com)
U.S. 10-year Treasury Note
Apart from the steep spike lower when the Chinese stock market fell out of bed, the yield on the US 10-year Treasury note has held clear of the 2.0% level that appears to be the level where profit taking kicks in. Sellers recently triggered a brief sell-off, but the yield was immediately pulled back into the tight consolidation range a little above the 2.0% level.
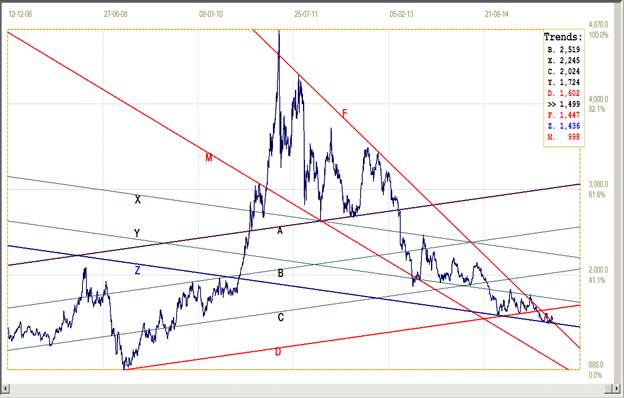
The yield has again broken just below the steep bear channel VW (2.205%), but is holding close to the consolidation range; the yield has to rally lower and preferably below 2%, for the bond market to turn really bullish. This week could reveal what the market intends doing – keeping in mind that should there be a sell-off on Wall Street, the bond market may again spike bullish in a flight to safety. This might be of short duration again, as happened after the previous recent spike lower.
U.S. 10-year Treasury note, last = 2.166% (www.investing.com)
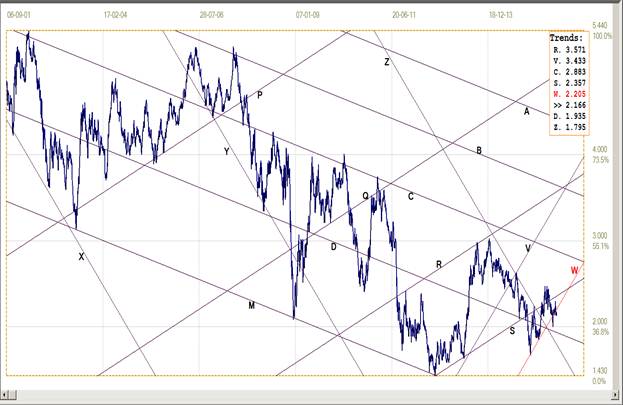
West Texas Intermediate crude. Daily close
The latest official EIA price from Cushing is for 21 September. After breaking below the previous firm support at line D ($44.89), the decline extended much lower, to spike down for a test of support at the top of steep bear channel, VW at $38.50. Support there held and the price reversed just as steeply to break clear above line D, but still well short of resistance at line Y ($52.39).
Despite a brief break below support at line D, the price of crude is settled above the support of this trend line that has played a role in halting the steep bear trend from above $100/bbl down to about $44.00, and again not long after. The price of crude is holding within bull channel FG ($42.92) and this has bullish potential, but support of line G is still untested, except when the price dipper steeply lower to reach line T ($39.41) and give a goodbye kiss to the steep line W at $38.50.
Here too, as on so many of the charts, the tight range bound behaviour of the price is seen as evidence of strongly opposed market forces trying to set the direction of the market.

West Texas Intermediate – Daily close, last = $46.67 (21 September)
©2015 daan joubert, Rights Reserved
chartsym (at) gmail(dot)com


