Silver Leads World Asset Classes Post-Fed


 On Wednesday, the US Federal Reserve Board unanimously voted to raise interest rates for its overnight lending facility by 0.25%. This puts the target range set by the Central Bank to between 0.25 - 0.50%, with some leeway for rates to fluctuate within this zone.
The move was largely anticipated by the futures market, which began pricing in a near-certain interest rate hike in November. In theory, other world markets should not have reacted with much volatility following the decision, because the rate increase should have been priced in for related assets.
Yet interestingly, an analysis of major asset classes since the decision reveals some distinct price movements. While three days’ worth of trading certainly does not constitute a long-term trend, when viewed within the context of emerging patterns already present in major international markets, this type of analysis can provide valuable clues as to the developing shifts in underlying fundamentals.
Silver, seemingly forgotten after almost five years of declines, emerged as the leader after the rate decision, in major divergence with the rest of the commodity sector and even superior to the traditional safe-havens.
Major Asset Classes: Post-Fed Reaction

Our chart above plots six major asset classes from Wednesday, December 16, the day of the Fed decision, through Friday, December 18. Over that timespan, we note the following:
- Silver: the strongest performing asset class, finishing up 2.4%. Note the rise into mid-day Wednesday was mostly held through the end of the week, as silver anticipated the Fed move correctly. Divergence from the rest of the commodity group.
- US 20+ Year Treasury Bonds: the second-best performer by end-week, up nearly 1.5%. It should be remembered that rising prices mean lower yields on these long-term bonds, in stark contrast to the rising yields (Fed-controlled) on the short-end of the spectrum. This is noteworthy as it shows funds forced out of the short maturity were partially redirected toward long maturity bonds, a safe-haven paper to paper transfer.
- Gold: the historical standard of safety assets, finishing third of the group, up about 0.5%.
- US Dollar: coming in just behind gold, at plus 0.35% when compared to a basket of international currencies that comprise the Dollar Index.
- Commodities: selling off over 1% for the three-day period, this includes an average of major world commodities including energy, precious and industrial metals, and agriculture.
- US Stocks: the weakest of the group, as represented by the S&P 500, falling nearly 1.9% for the three days. Note that stocks actually rose after the Fed decision, only to reverse course starting Thursday. From the post-Fed high to the Friday low, a loss of 3.4%.
Silver as a Safe Haven
The broad selling amongst most commodities and stocks shows a fear reaction against economic growth assets after the Fed meeting. Conversely, we see a flight to safety as the typical safe-haven assets of the US Dollar, US Bonds, and gold all rose.
The critical outlier to note is that silver price moved higher with the safe-haven assets.As someone who has studied the silver market daily over the last decade, I will confirm that such a movement is not typical in commodity sell-offs. Indeed, when looking at silver's bear markets in 2008 and 2011-present, it can be noted that moves lower in silver have a high correlation with moves lower in industrial commodities. This makes sense when you recall that over 80% of the silver market is still used for industrial fabrication, as mentioned in our fundamental silver review here (LINK: https://www.silver-phoenix500.com/article/higher-silver-prices-fundament...).
So what caused silver's strength this week? The precious metal acted as a flight-to-safety asset, in stark contrast to its performance over the last five years.
Is this a sign of an emerging trend change in silver?
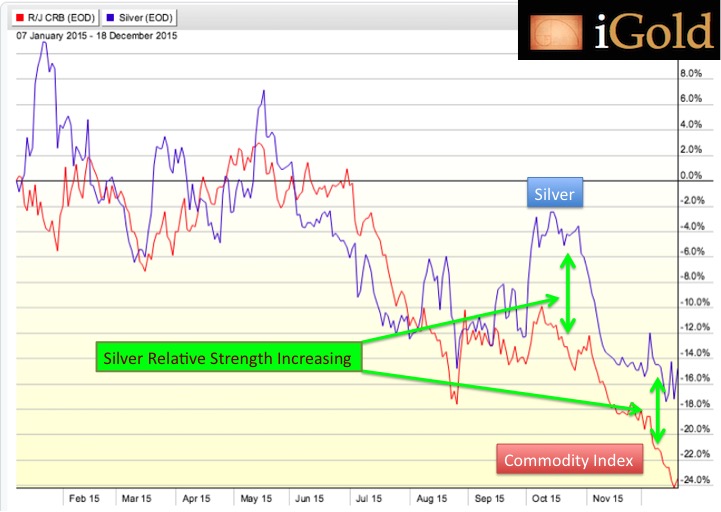
Above we can see further indication of growing divergence between silver and the rest of the commodities as shown by the green arrows, since late-September. The post-Fed leadership by silver -- in contrast to stocks and commodities -- is the latest signal that a shift is occurring in the silver market that is unique to the safe haven aspect of the historically-monetary metal.
An Update on Silver's Bottom Formation
We can see over the last several years that the decline in silver has been losing momentum.

Above is an updated chart on the specific bottoming formation we have been following for some time, which is grinding its way ever closer to a resolution: a bottoming wedge, a pattern in which both the highs and the lows are still falling, yet the lows are falling at a lesser slope than the highs -- indicating that buyers are emerging at increasingly higher levels relative to sellers at each downturn.
When we see this formation after a prolonged bear market, it represents a bottoming pattern. While we do not predict that prices will immediately skyrocket as some analysts claim, following a break of this bottom pattern at some point in the next 4-12 months, we would expect a sizable bounce, followed by a retest and period of consolidation, which will eventually emerge into a new trend of rising prices. Once we have this confirmation, we can begin to look at predictions for an eventual re-challenge of the $50 level over the years ahead.
Interest rates, having bottomed at 0% for the last 7 years, are now rising again. As discussed in our last article, throughout history rising interest rates correspond to rising precious metals prices. The outperformance in silver after the Fed meeting, and the lows forming on longer term patterns for both gold and silver, are giving us early indicator signals that the bear markets are entering their final phases. Those investors who have held on this long or who are still accumulating should be encouraged by the price action after the historic Fed rate hike, and the likelihood that this represents the first hint of strength re-emerging in the precious metals sector.
We monitor these emerging trend changes weekly with our free video updates.
*****

Christopher Aaron began his career as an intelligence analyst for the CIA and Department of Defense. He served two tours to Afghanistan and Iraq between 2006 - 2009, conducting pattern-of-life mapping for military leaders.
Mapping shares similarities with technical analysis of the financial markets because both involve the interpretation of repeating patterns found in human nature. He is the founder of iGold Advisor, providing independent research and analytics on all aspects of the precious metals markets.
He speaks regularly on the cyclical patterns found within the financial markets and on international policy. He has been featured in the New York Times and NPR news amongst other financial publications.
More from Gold-Eagle


