S&P500 Fell 15% Below Last Year's All Time High - Correction Or New Bear Market?


In our opinion, no speculative positions are justified.
Our intraday outlook is now neutral, and our short-term outlook is neutral. Our medium-term outlook remains bearish, as the S&P 500 index extends its lower highs, lower lows sequence. However, we decided to change our long-term outlook to neutral, following recent move down below medium-term lows.
Intraday outlook (next 24 hours): neutral
Short-term outlook (next 1-2 weeks): neutral
Medium-term outlook (next 1-3 months): bearish
Long-term outlook (next year): neutral
The US stock market indexes lost between 0.3% and 1.6% on Wednesday, following relatively volatile trading session, as investors reacted to Asian stock markets' sell-off, accompanied by further oil prices decline, among others. The S&P500 index extended its short-term downtrend, before bouncing off and retracing some of its intraday decline. The broad stock market index reached the lowest since early 2014, as it got closer to the level of 1,800. Yesterday's session low of 1,812.29 was 15.1% below last year's May all-time high of 2,134.72. Is this a correction following multi-year bull market or the new bear market? The nearest important level of support remains at around 1,800-1,820, marked by previous local lows. On the other hand, resistance level is at 1,870-1,900, marked by previous support level. There have been no confirmed positive signals so far. However, we still can see oversold conditions accompanied by an increased volatility which may lead to an upward correction or downtrend reversal at some point:

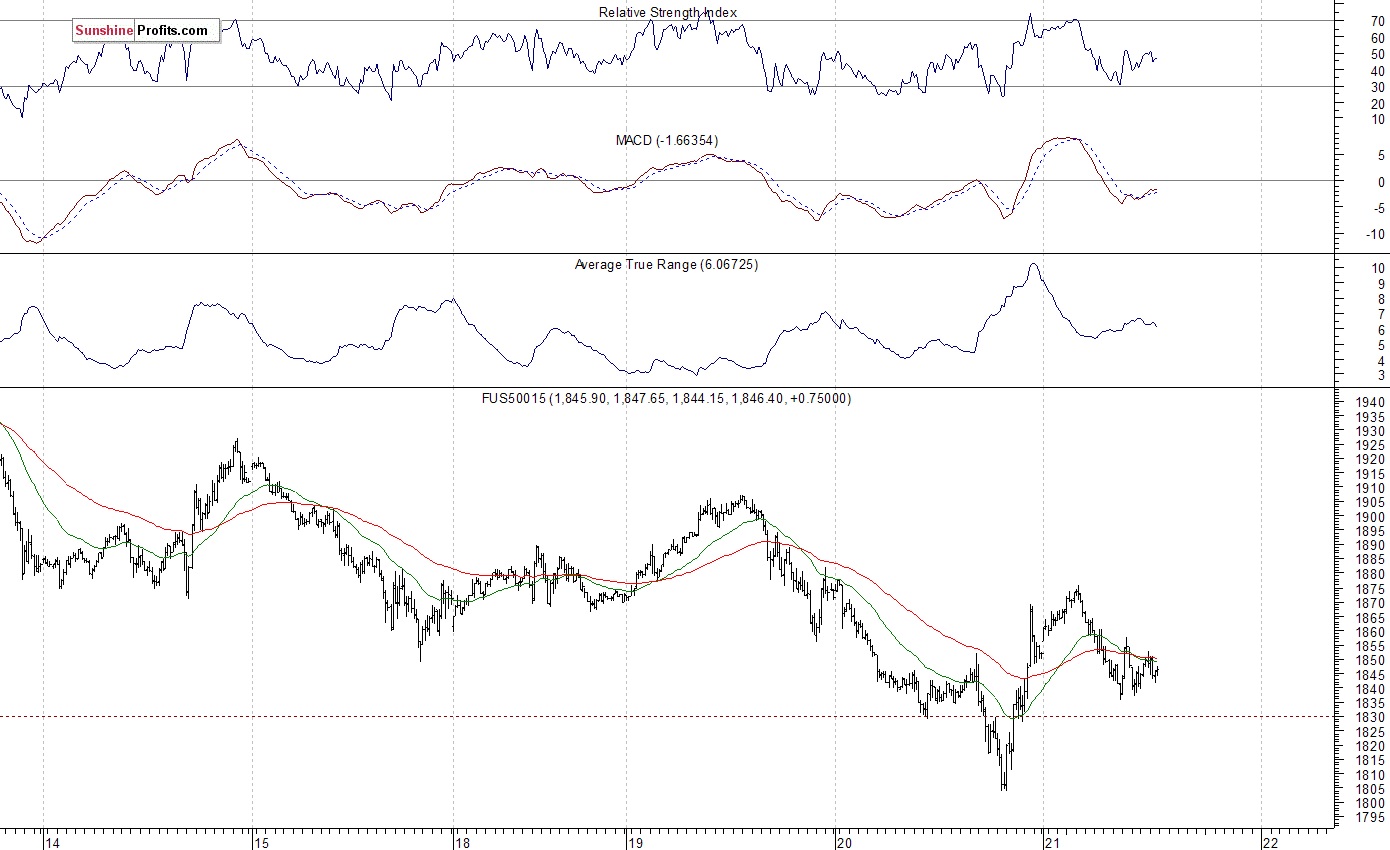
Expectations before the opening of today's trading session are negative, with index futures currently down %. The European stock market indexes have gained % so far. Investors will now wait for some economic data announcements: Initial Claims, Philadelphia Fed number at 8:30 a.m., Crude Inventories at 10:30 a.m. The S&P 500 futures contract trades within an intraday consolidation, following yesterday's rebound and a meaningful retrace of that rebound. The nearest important level of resistance is at around 1,835-1,840, and resistance level is at 1,870, marked by local high, as we can see on the 15-minute chart:
The technology Nasdaq 100 futures contract fluctuates along the level of 4,100, as it retraces yesterday's bounce. The nearest important level of support is at around 4,080-4,090. On the other hand, resistance level is at 4,150-4,170, among others. There have been no confirmed short-term positive signals so far. For now, it looks like an upward correction following recent sell-off. The next important level of support remains at around 3,980-4,000, as the 15-minute chart shows:

Concluding, the broad stock market accelerated its short-term downtrend yesterday. The S&P 500 index reached the lowest since early 2014, as it got closer to 1,800 mark. Overall, it is one of the most bearish beginnings of a new year in history so far. Will it continue even lower? We can see short-term oversold conditions. However, there have been no confirmed positive signals so far. Our speculative long position (1,891.68, S&P 500 index) has been closed at the stop-loss level of 1,840 (S&P 500 index) on Wednesday, as the futures contract broke slightly below the level of 1,835 ahead of the cash market's opening (it currently trades around 5 points lower than the cash market). We prefer to be out of the market, avoiding low risk/reward ratio trades. We will let you know when we think it is safe to get back in the market.
********
Courtesy of SunshineProfits.com


