Stock and Bond Expert Makes Case For PMC Ounce and Gold – National Debt A Key Price Driver
 share
share
 share
share
 share
share
 share
share
 share
share
Macroeconomic and geopolitical conditions have investors bewildered. Events which are unfolding look like they may crush the valuations of several asset classes which had enriched investors over the past decade. To help give us some direction at such a time, Neptune-GBX is pleased to share the insights from a market veteran and visionary who forecast the financial crisis of 2008 early on. Our friend Nick Krsnich, who currently leads JMN Investment Management, applied his proprietary models to produce an exhaustive study of the performance of the PMC Ounce and gold in various market conditions going back to the 1980’s.

The good news for PMC Ounce investors is that an expanding national debt is very supportive of a higher price for this asset. This is just one of the conclusions Nick came to and backs-up with hard data. Below is his complete report. Nick’s biography is at the end. He has also agreed to share his email to respond to questions our readers may have: Nick can be reached at [email protected]
PMC Ounce ® & CSPM™
In this paper we evaluate Neptune-GBX’s ® PMC Ounce ® (PMC) as a CSPM™ 4th asset class. The Common-Sense Pricing Model (CSPM™) model is a modified version of the Capital Asset Pricing Model (CAPM). Very simplified, the CAPM determines the portfolio mix of assets resulting in the highest return profile within a range of risk. See Appendix C detailing differences in CSPM™ vs CAPM models. For this analysis, CSPM™ begins with three asset classes: (1) Equities represented by the S&P, (2) Longer-Term Bonds represented by ten-year Treasury Bonds, and (3) Shorter-Term Bonds represented by the six-month Treasury Bills.
PMC Ounce®
The PMC Ounce® (Precious Metals Composite) is Neptune-GPX’s dynamic physical precious investment asset that provides the same diversified and weighted allocation of precious metals that comprise the PMC Index. Each PMC Ounce is 100% backed with physical gold, silver, platinum, and palladium bullion. Metals storage is on an insured basis at a non-bank bullion depository and allocated in the owner’s name. Verification of the investor’s bullion holdings provided to the account holder directly from the depository, an entity independent from Neptune Global. Providing maximum investment flexibility, Neptune Global offers investors the option to convert their holdings of PMC Ounces into metal for delivery. The PMC Ounce is a measured unit of trade backed 100% by physical bullion, not a fabricated bullion round. Contact Neptune Global for delivery program details and complete information on the PMC Ounce. The PMC Ounce® is comprised of (by weight/content): 93.75% silver, 3.50% gold, 1.75% palladium and 1.00% platinum; the composition by value using today’s pricing is 54% gold, 20% palladium, 18% silver, and 8% platinum.
Viewing PMC Ounce, National Debt Ratios, and Inflation from 1980 to 2023 (Exhibit 1) we recognize that a long-term correlation exists, but how about the trends over various times, both standard intervals and stress periods, where investors need to change portfolio allocations? Just as price/earnings ratio studies might determine current stock return expectations, we need to form a value “metric” for PMC based on today’s economic environment. Let us see if “traditional thinking” linking metals to market stress situations, represented by National Debt/Gross Domestic Product (GDP) and the Producer Price Inflation Index, are correlated to the degree necessary to justify addition to our portfolio. We “smoothed” the National Debt data using a 2-year change calculation favoring correlation results yet reflective of the United States debt negotiations.
Exhibit 1
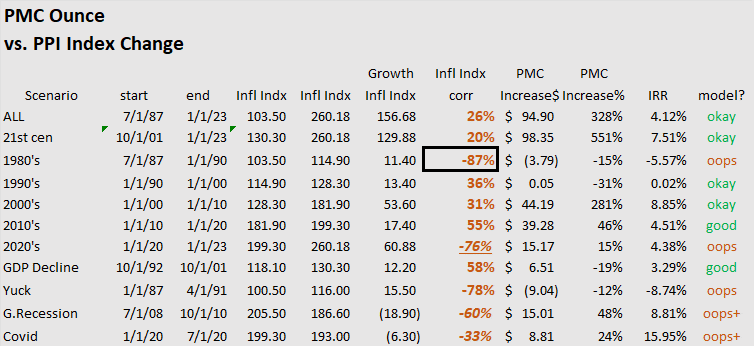
PMC’s correlation to National Debt/GDP looks encouraging (Exhibit 2) accordingly we set PMC strategy/limits based on this relationship. If you are wondering how PMC to the PPI Inflation Index faired (not as good) see Appendix A (Exhibit 3). Debt/GDP and Inflation data are unscaled data histories, so the absolute level of positive or negative correlation are not directly comparable, but rather directionally important in relation to hedge gains or losses. Also, we compare (correlate) data based on the quarterly rate of change (%) of investments and economic benchmarks. PMC Ounce and Gold (Appendix B) closely compare in terms of returns, standard deviation, and correlation (99%); readers can use Gold interchangeably when determining allocation to existing portfolios.
Modern monetary theorists will tell you that the National Debt is irrelevant and a new evolution, so opinions vary; in our traditional view uncontrolled spending expands the Fed’s balance sheet diluting the dollar and increases interest expense. US Dollar weakness bodes well for metals. The Congressional Budget Office’s estimate of Gross Federal Debt increases from 2023’s $32 Trillion to $45 Trillion by 2030. It’s likely that the Debt to GDP ratio will be 1.3X to 1.35X in 2030 (even with liberal GDP growth – Appendix C), the highest in history; Many indicators are mixed regarding the strength or weakness of the economy, but our appetite for spending seems to be without limit.
Exhibit 2
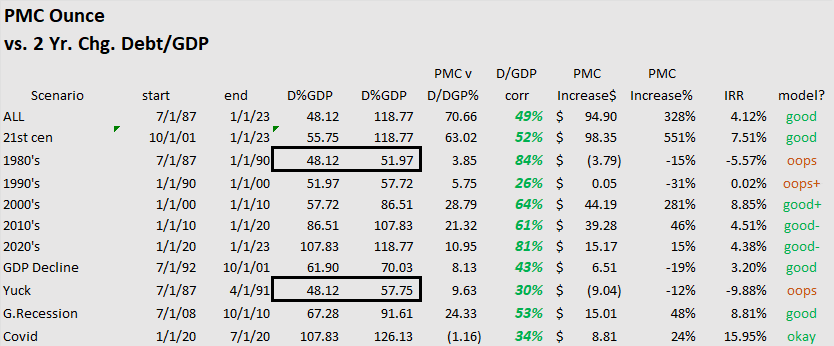
Periods of significant Debt/GDP growth and PMC price increases are favorably correlated. Not every period reflects a strong “hedge”, “oops” grades signify poor performance associated with declines or small Debt/GDP percentage increases in the prior century. Highly correlated (“good”) periods include:
-The Great Recession and COVID emergency resulted in heavy government spending and PMC performed strongly.
-The 21st Century. Whether wars, economic swoons, or epidemics the United States has put on an unprecedented amount of debt. PMC had its largest increase in the first decade yet subsequent periods have also gained.
-Overall. Including the 20th Century data, we still see positive correlation.
Exhibit 2 is a good visual for performance in “headline” scenarios but for optimization we need a better “stress gauge” to determine PMC portfolio allocation.
The model’s largest determinants of economic strain (“Stress”) are currently the expected change in inflation and the expected change in Debt/GDP. The “trip switch” for economic pressure involves both science and art. CSPM™ studied drastic historical price declines, national debt and inflation volatility, inverted yields curves and high levels of unemployment and the favorable performance of assets during those periods. CSPM™ evaluates 169 one-year change periods from 1980 to 2023. 25% of periods (43/169) were determined maximum “Stress” by either:
- a 2.5X increase in inflation or a greater than 10% growth in the Debt/GDP. (currency/economic growth risk)
- A Stock Market quarterly decline of 10% (equity risk).
- CCC Bond decline of 10% (credit risk).
PMC and long-term bonds perform well in our economic downturn cases. There is no perfect hedge, yet history suggests a negative correlation to equities, in extreme scenarios. Prior to integrating PMC to the CSPM™ these results suggest that the addition will be favorable to the return/risk profile. Based on our expectation for continued higher inflation and government spending, we see our “stress gauge” in the 80th percentile (100% being a “Stress” period; 50% and below considered “Normal”). This stress reading added to the CSPM™ (see below) dictates both the maximum allocation for metals and those associated with varying investor risk levels.
CSPM™
PMC’s correlation, variance (risk), and allocation to other asset classes such as stocks is determined by CSPM™ “optimization.” Setting risk limits is in the eye of the beholder. Surely there are Bond, Stock, and Metals “bulls” that consider their markets less risky (or defensive) due to comfort within their favored spaces. We abide by the notion that lower standard deviation and lower risk are synonymous and applied to all investment sectors.
Exhibit 4 details quarterly returns (average, maximum, minimum, and median) and standard deviations since 1980 to date, 2001 to date, current expected returns, risk statistics, and portfolio limits utilized by CSPM™.
Exhibit 4
The current expected cash return/risk (5.0%/.4%) is the result of 15 months of Federal Reserve interest rate increases. Contemporary investors have not experienced a non-zero interest rate scenario and the associated higher returns required to take on risk in other asset classes. When contrasting market classes, the standard deviation (risk) of both Stocks and Metals limits their current allocation; and higher cash returns are attractive. PMC does offer lower correlation to equities (8.6%) and, if stress scenarios ensue, inclusion strengthens our portfolio (per our previous analysis).
CSPM™ Return expectations and Sharpe Ratios currently decline as risk increases; today’s environment seems skewed to “risk off.” The culprit, high equity valuations. Equities are the preferred class in CSPM™ combining long-term current income and price appreciation. It is a category with the largest historical return performance and hence the highest potential allocation, going as high as 70% (in risk category 6) when valuation cooperates. All correlations utilize an equity benchmark.
Risk/return statistics and allocation for 1 through 6 risk classes follow. Standard deviation targets match the risk categories increasing from 1% to 6%. Longer-term bonds (specifically higher in credit quality) have gained share as interest rates have climbed significantly over the last 15 months; in most cases longer-term bonds have low or negative correlation which increases allocation. The differing methodologies of CAPM and CSPM™ appear in Appendix C. Notice that the lifetime, current, and stress expected returns are significantly different (Exhibit 4).
Exhibit 5
PMC allocation ranges from 0% to 9% in current CSPM™ analysis. PMC allocation can go as high as 15% as our “Stress Gauge” moves toward 100%. Versus CSPM™ allocations without “metals”, returns and Sharpe Ratios improve as PMC’s expected returns are higher than equities in both current and stressed scenarios.
Appendix A – Inflation Correlation
Debt/GDP and Inflation data history is unscaled, so the absolute level of positive or negative correlation are not directly comparable. What we can say, directionally PMC and inflation correlations are less favorable than those versus Debt/GDP. Does that mean we should discard inflation analysis? Of course not. The relationships between Debt/GDP and Inflation have time lags. High negative correlation results from a “run-up” in metals pricing or a time delay from the root cause of inflation. In fact, we use an inflation volatility measure in calculating our economic stress matrix presented in this paper.
Exhibit 6
Appendix B – PMC Ounce v. Gold
The PMC Ounce® (Precious Metals Composite) is a dynamic physical precious investment asset that provides the same diversified and weighted allocation of precious metals that comprise the PMC Index. The PMC Ounce trades in real time and allows an investor to capture and combine the value associated with each metal’s characteristics as a store of wealth, inflation hedge, currency hedge and unique industrial applications. The PMC Ounce was awarded a US Patent based on its innovation as a physical precious metal’s investment. PMC Ounce® is comprised of (by weight/content): 93.75% silver, 3.50% gold, 1.75% palladium and 1.00% platinum; the composition by value using today’s pricing is 54% gold, 20% palladium, 18% silver, and 8% platinum.
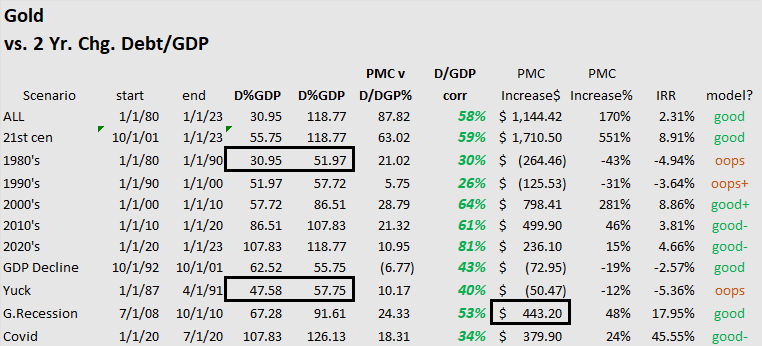
The statistics for PMC and Gold to (Exhibit 7) are similar (99%). Not surprising as the value weighted gold component of PMC is considerable. Gold’s positive correlation profile to Debt/GDP (Exhibit 8) is comparable to PMC’s (Exhibit 2). PMC’s standard deviation is less than Gold 7.4% to 8.5%.
Exhibit 7
Appendix C – Data, Definitions, & Notes
Neptune-GBX Neptune Global ®- is a full-service precious metals dealer serving individual investors, the wealth management industry, broker dealers and institutional investors. The firm’s platform of investment bullion includes all forms of traditional physical precious metals in conjunction with innovative physical precious metal investment assets which provide unparalleled diversification, transparency, and liquidity. Neptune Global market leadership includes being the recipient of a US Patent for the PMC Ounce (Precious Metals Composite). While dynamic offerings such as the PMC Ounce provide investors with the conveniences and benefits associated with mutual funds and ETFs, all of Neptune Global product offerings remain true to the firm’s core convictions related to the time-tested value ascribed to physical precious metals ownership.
PMC Index ® – The Precious Metals Composite Index is a fixed-weight index comprised of the four primary precious metals and expressed as an ounce. The weighting design of the four fractional ounce component metals index represents a diversified investment in the precious metals in terms of dollar allocation. The PMC Index factors in the spot market prices for each weighted component metal and thereby provides a consolidated view of the price changes across the precious metal’s spectrum.
Capital Asset Pricing Model (CAPM) – Investopedia – describes the relationship between systematic risk, or the general perils of investing, and expected return for assets, particularly stocks.1 It is a finance model that establishes a linear relationship between the required return on an investment and risk. The model is based on the relationship between an asset’s beta, the risk-free rate (typically the Treasury bill rate), and the equity risk premium, or the expected return on the market minus the risk-free rate. The expected return formula for CAPM is:
Expected Return = Risk Free Rate + Beta * (Risk Premium to Risk-Free Rate)
Common Sense Pricing Model (CSPM™) -The Common-Sense Pricing Model (CSPM™) model is a modified version of the Capital Asset Pricing Model (CAPM). Very simplified, the CAPM determines the portfolio mix of assets resulting in the highest return/risk profile within a range of risk. One difference in CSPM™ vs CAPM model is, in the calculation of returns and risk, CSPM™ limits or increases category investments based on comparison to all asset classes and not just the “risk-free” asset class. The CAPM skews allocation looking solely at a six-month treasury asset. Decisions skew to overallocation to “risk” assets as the “risk-free” asset approaches zero and under-allocation as interest rates rise significantly. The expected return formula for CSPM™ is:
Maximum Of:
Expected Return = Alternative Asset Yield + Beta * (Risk Premium to Alternative) or
Expected Return = Risk Free Rate + Beta * (Risk Premium to Risk-Free Rate)
For fixed income assets with low or zero betas the expected return is the current yield. For assets added to the model (like PMC) we compute an additional expected return by comparing yields, betas, and risk premiums to equities. As the model grows the expected return on equities is “fine-tuned” so when we compare the maximum expected return (or lowest acceptable equity price) to observed returns (or prices), we have our value opinion.
The second CSPM™ significant difference to CAPM is risk “buckets” and expected returns are not linear (risk down and returns up) as history reflects idiosyncratic valuation, risk, and economic volatility periods, so we need to adjust allocations accordingly. Why? CAPM does not pick alternate assets that perform well in “stress” scenarios because often their overall history is a combination of lower return and higher risk.
As CSPM™ introduces new assets: (1) the returns, risk, and current valuation may be “rich” or “cheap” to its valuation history and to the valuation history to all assets in the model, (2) and the current economic scenario incorporates higher or lower volatility (“stress”).
The CSPM™ seeks an improved process to capture how wealth managers make asset allocation decisions as they look at history, adjust for the current market, and “hedge” for stressed markets.
Exhibit 9
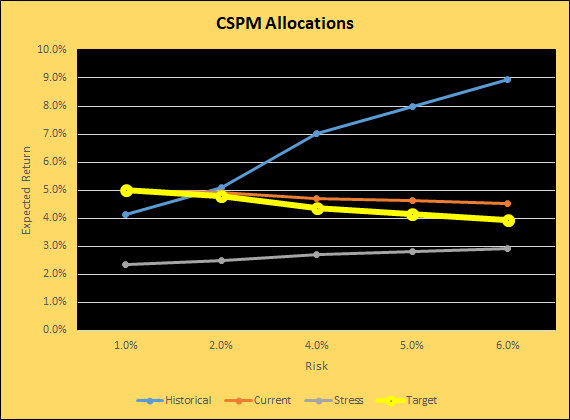
Exhibit 9 shows historical, current, and stress expected risk return profiles. The historical trendline shows the traditional equity centric risk/return profile. The current trendline is flat, reflecting overvaluation in equity markets and high cash returns. The stress line is what we hope to achieve in worst case economic scenarios. The “target” profile is our optimal portfolio.
Producer Price Index Data – US Bureau of Labor Statistics, Producer Price Index by Commodity, From Federal Reserve Bank of St. Louis. 1982 = 100.
National Debt to Gross Domestic Product – US Office of Management and Budget, Federal Reserve Bank of St. Louis. Correlations use a 2-year change in Public Debt to Gross Domestic Product. The Congressional Budget Office (CBO) Baseline of Projections of Federal Debt follows.
Exhibit 10

Assumptions – Correlations utilize quarter-end data for the 1980 to 2023 period. Long-Term Bonds indexed on 10 Year Treasuries, Short-Term Bonds by six-month Treasury Bills, and Equities by ^GSPC equity index. CSPM™ allocations assume an increase in the Debt/GDP Ratio of 1.35 (higher than the CBO forecast) and an annualized inflation rate of 4%. Regressions and correlations are performed on quarterly returns and quarterly economic index changes.
Courtesy of Neptune Global
*********
share
share
share
share
share
More from Gold-Eagle