The Strong Arm Of The Law


This week’s heading is a little strange to apply to the markets. Two, perhaps more decades ago, it would have been taken for granted that the strong arm of the law was a ‘given’ for civilised society in developed countries. The silver ‘fix’ on Thursday is final and blatant proof this perception no longer applies. It is not that a loophole exists in the legal framework of a new supposedly transparent mechanism designed for the silver ‘fix’, but that the loophole happened to be exploited in so brazenly a fashion. Do not hold your breath waiting for the Law to act.
The fix was at $13.58 while the low of the day’s range was above $14.0. the new mechanism for the fix allowed one member of the fixing team to submit apparently false sales volumes that resulted in the tentative or projected fix be adjusted lower and lower until purchases and sales balanced at a price 84 cents below the quoted live price. The only reasonable objective of the manipulator must have been to set an extremely low fix at which some OTC contract was to be settled. Once the day’s fix was in, the price returned to near its previous range, with not a sign of massive selling volumes. An unknown market player was really done in, probably by a large client of one of the banks doing the fix, receiving much less than he had expected.
Comments from a wide range of analysts have increasingly focused on manipulation of one market after another – including announcements of criminal investigation of various market. Gold and silver was immune for a long time, but recently there has been mention of regulators in Europe getting curious about these two markets, but then only in relation to the London fix; rightly so! What happens on Comex is from the official perspective still all above board. It seems it will have to be the market itself that brings that practice to an end. Perhaps sooner than we think!
Wall Street has found new life to show amazing ability to recover despite grim news about the true state of the economy – which is never reflected in the headlines and has to be sifted from the fine print details of the news releases, or by circumstantial evidence from other sources. One has to be very naive to believe that the repeated reversals higher after a steep decline, to leave spike lows on the DJIA, is a real vote of confidence in the future of the economy. All evidence shows it is intervention by a powerful force that wants a strong stock market to keep optimism and faith in the future high on Main Street.
Clear evidence of intervention is not limited to the precious metals and Wall Street. A strong dollar and low yields on Treasuries are equally as important to maintain the facade that all is well and that the future holds promise. The Fed was compelled to walk their talk when they raised interests late last year, but their bluff is going to be called in the run-up to the March FOMC meeting. Either they have to retreat by dropping rates to zero again, or they have to ensure that the statistics before then paint a more positive picture – in which case the disaster grows in magnitude.
Euro-Dollar Chart
Little new to be said, as the euro is still churning sideways against the US dollar. Considering the narrow range of changes in the various exchange rates – the USD-Yen in particular – it almost seems as if all the central banks have an agreement to devalue in step in order to avoid turbulence in the forex market. The euro remains within its new bull channel KL, (K: $1.1366, L: $1.07132) without testing support or resistance at the sides. The sideways drift is moving closer to the support at line L, but it is not expected to be tested this week; unless there is some event global central banks cannot control and suppress.
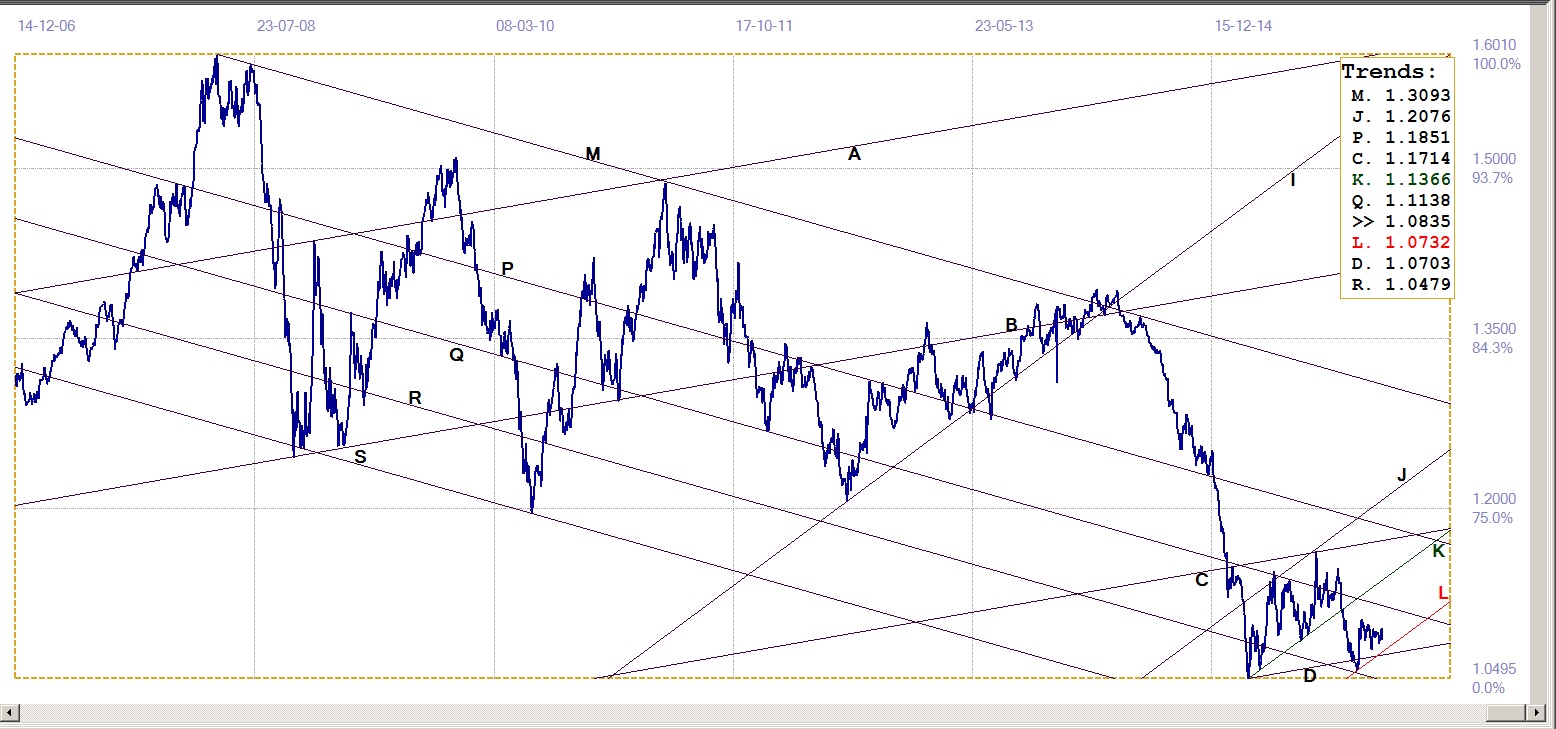
Euro-dollar, last = $1.0835 (www.investing.com)
Dow Jones Industrial Average (DJIA)
The 10% decline in the DJIA since the close of 2015 found support at the bottom of main bull channel XYZ (15798) last week, triggering a rally that closed right at the resistance along line K (16444) on Friday to end the week on a very positive note.
Line K is the top of beach channel JK; the previous time it acted as firm resistance soon resulted in a continuation of the rally, but only after a decline to find support at line W. The price of crude seemingly has become the psychological driver for the stock market and all eyes will be on the oil price before the open. There is thus a strong incentive to have a bullish WTI – largely confined to the US – despite the oil glut in the rest of the world as Iran gears up to join the oil producer community and also pursues higher revenues by increasing production as much as possible.
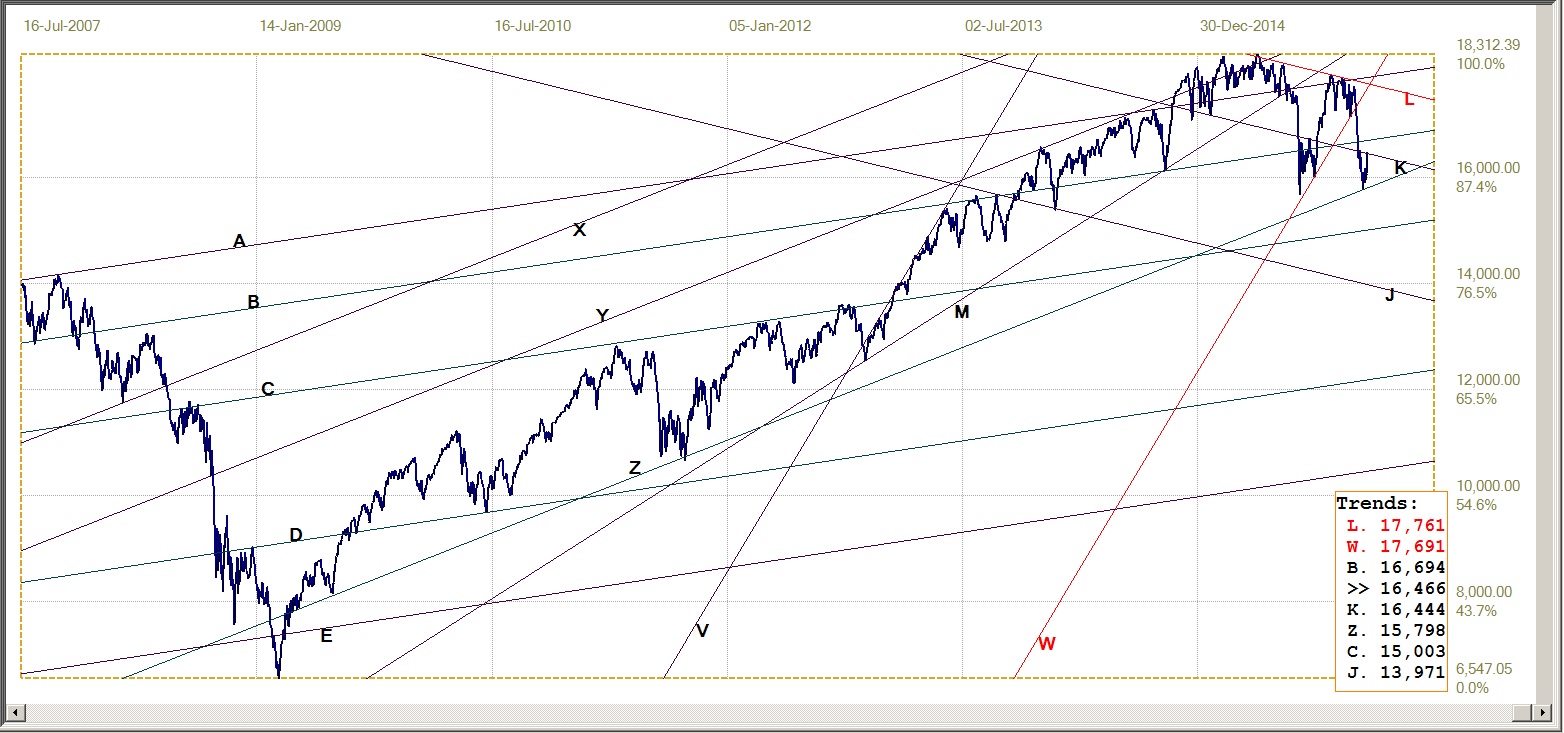
Dow Jones Industrial Index, last = 16466 (money.cnn.com)
Gold PM fix - Dollars
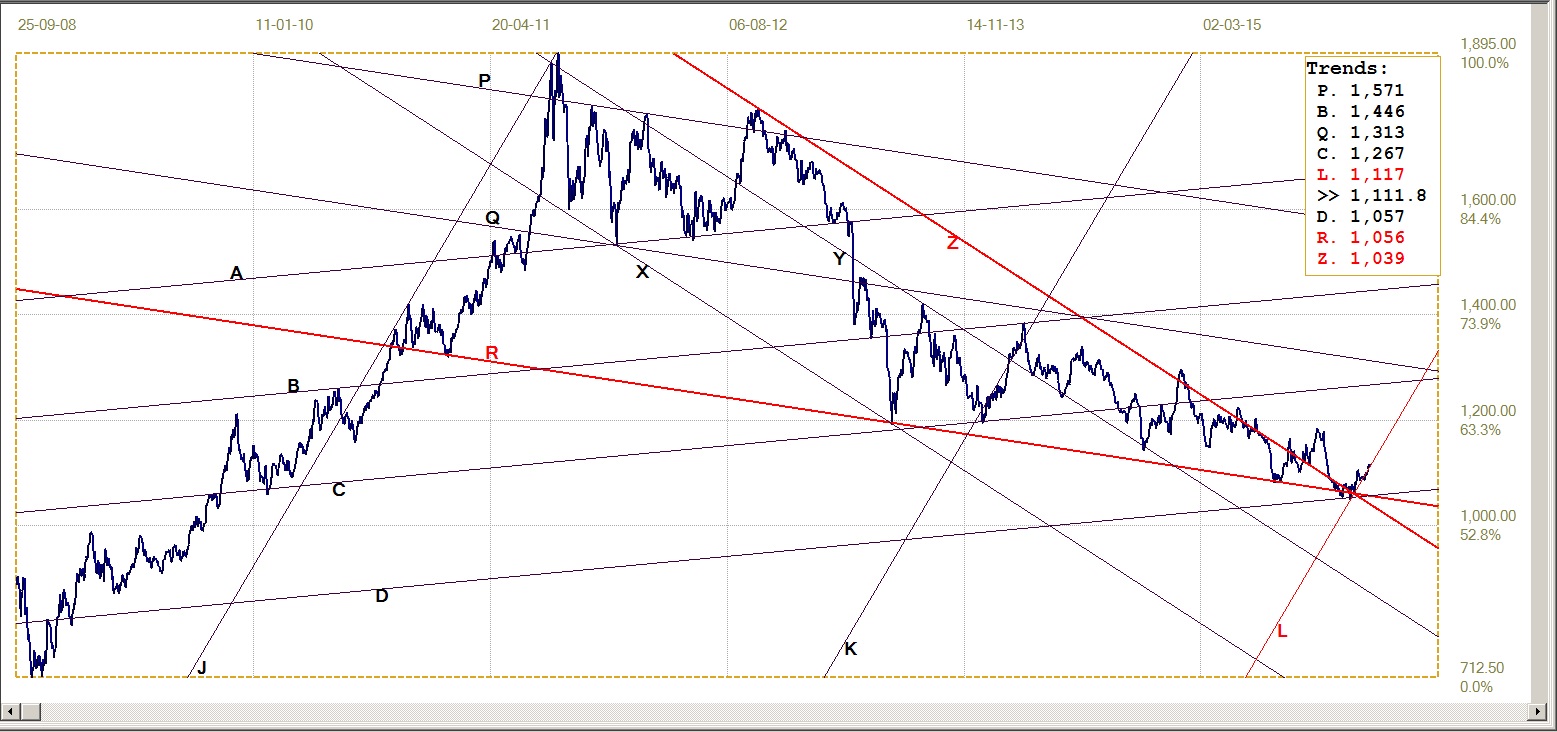
Gold price – London PM fix, last = $1111.8 (www.kitco.com)
Despite frequent, even persistent, waterfall attacks on the price of gold during the whole trading day, gold managed to move further away from the support at lines R ($1056) and Z ($1039) to extend the break higher made last week. Gold could not hold above support of line L ($1117), the bottom of the long term bull channel, but remained in touch for most of last week.
The trend is still bullish. However, a move back into bull channel KL that holds and extends higher will be very welcome to many readers as a sign that the market is finally improving.
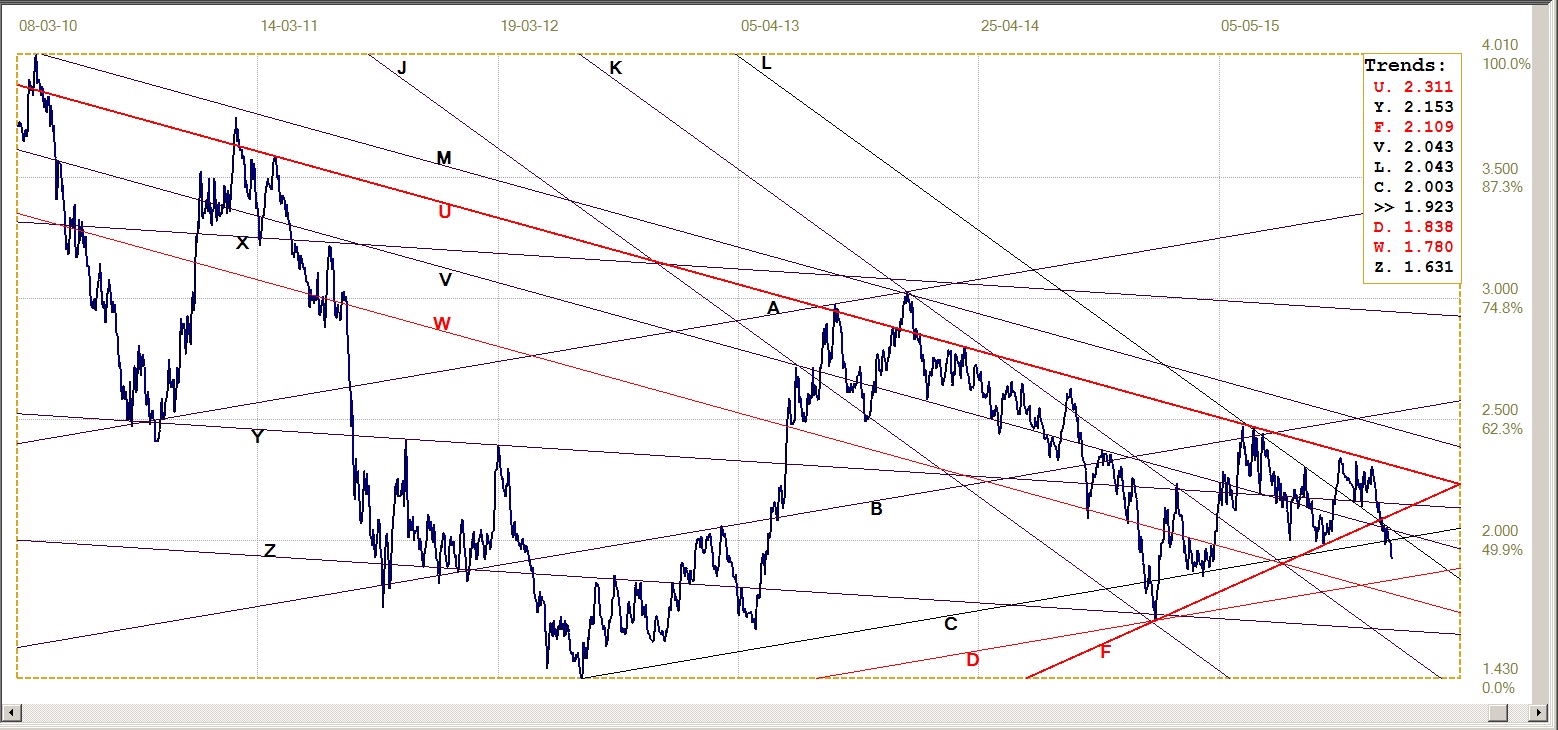
Gold PM fix - Euro
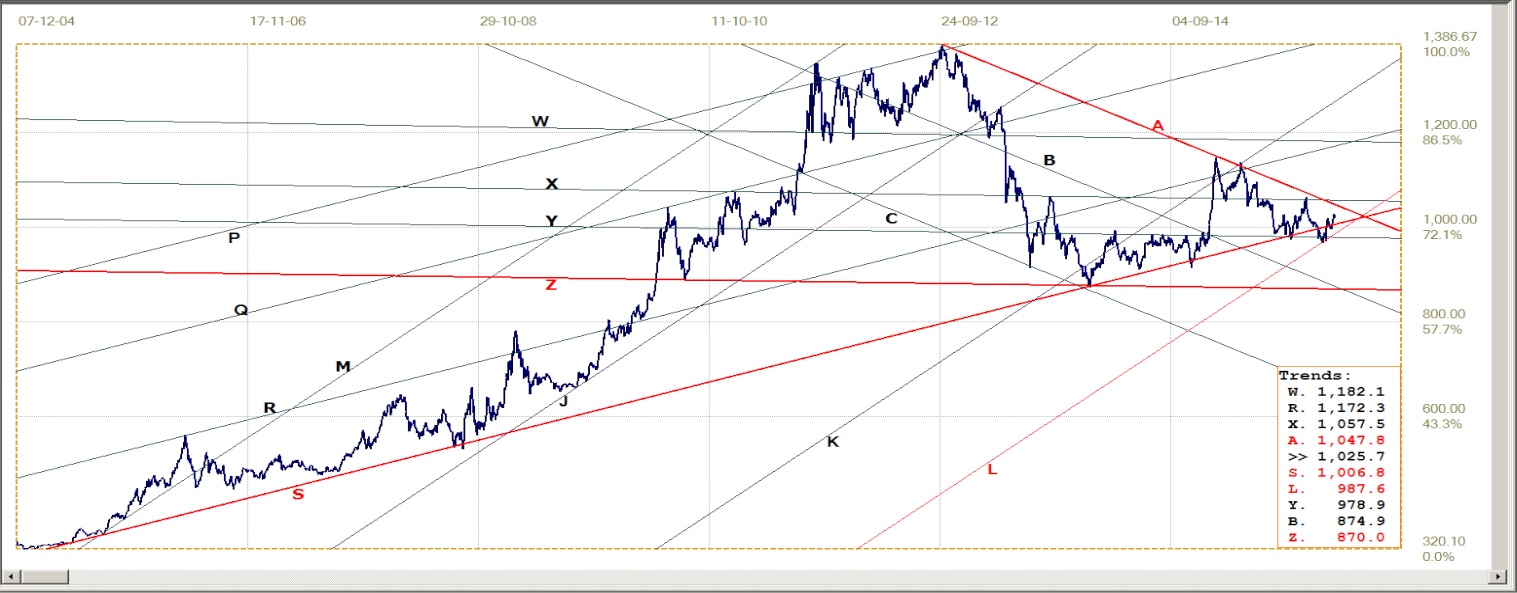
Euro gold price – PM fix in Euro, last = €1025.7 (www.kitco.com)
The sideways move of the euro against the US dollar, keeping to a tight range with not much volatility, enable the improving dollar price of gold to drag the euro price of the metal back into the long term triangle AS (A: €1048) S: €1007). The room to move sideways within the triangle is narrowing and there is not a long time before a definite break is forced.
The shape of the triangle predicts the break will be higher to resume the long term bull market. It seems likely that a break before the end of February will answer the question whether the triangle will fulfil its promise! That is, unless the euro price of gold copies the behaviour of silver and simply drifts sideways out of the pattern – a trend that will require close –co-operation between the euro and the price of gold!
Silver Daily Fix Chart
The range of decline in the price of silver since the high in 2011 is so wide that the scale of recent changes in the prices is highly compressed. Even the abnormal low fix on Thursday, at $13.58, hardly shows up on the chart. However, using the low as the anchor point for line L ($13.76) enables a channel ratio for channel JKL of 499:501, right at the most often seen 500:500 ratio of evenly divided channels.
This raises hopes that if the channel does hold firm, silver will have a limited down side at first, with prospects of soon increasing at a good rate, to extend clear above the $14.00 level where so much of recent action has taken place. In combination with a positive technical outlook for gold, this is the first time in quite a while that both metals show promise over the near term.
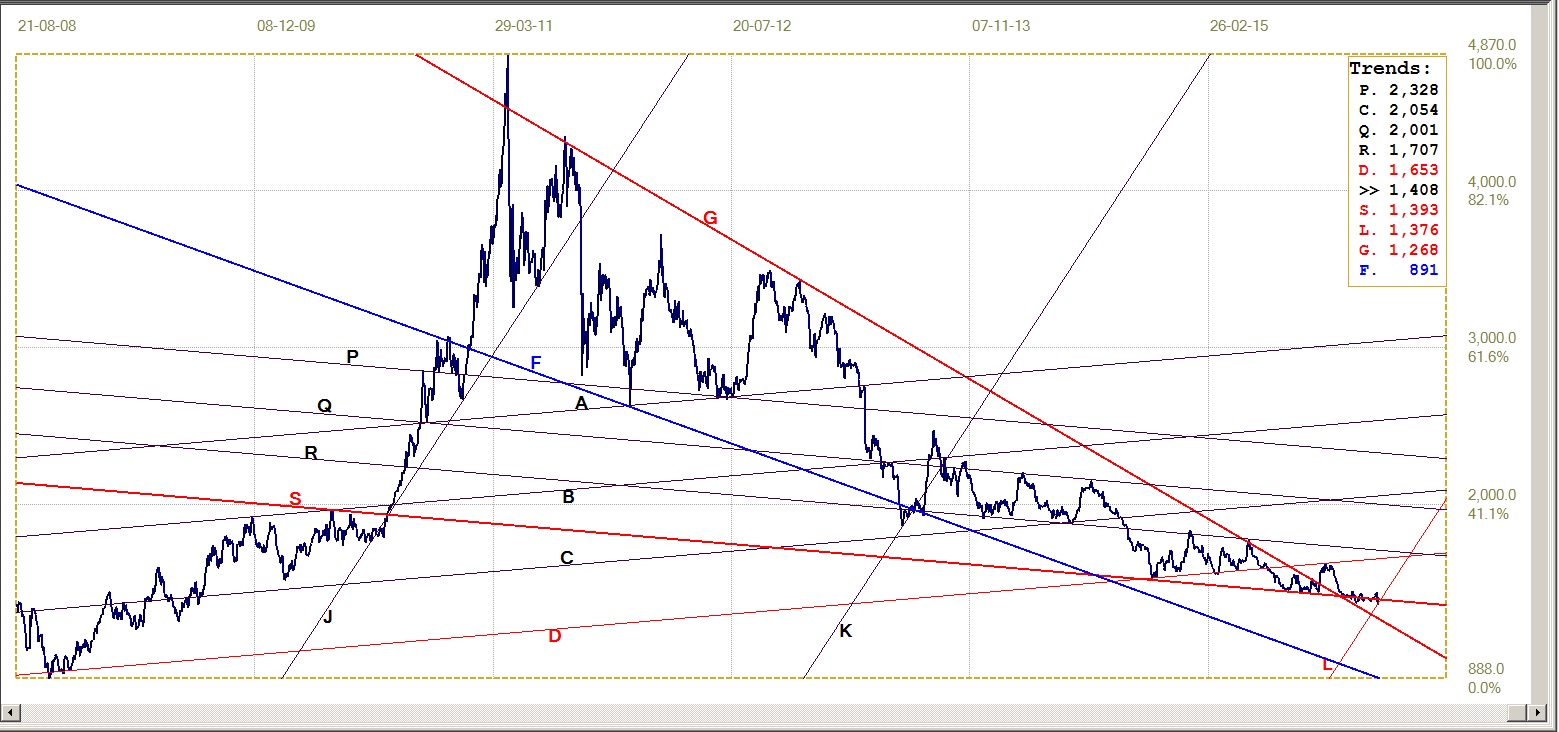
Silver daily fix, last = $14.08 (www.kitco.com)
U.S. 10-Year Treasury Note
The break below triangle NF (2.10%) has turned out to be more than a temporary aberration. As implied last week, the question now becomes whether China and the other large holders of Treasuries have ceased to off-load their reserves in quantity, or has the Fed decided to aggressively purchase bonds in order to get the mortgage rate low enough to stimulate the private properly market?
The break below triangle NF ended at market resistance at line C (2.003%). It held and the reversal tested support at line V (2.043%) before a new rally had the yield breaking clear below line C. This is the lowest the yield has been since H1 of 2015 and must have a positive effect on prospective home buyers.
U.S. 10-year Treasury note, last = 1.923% (www.investing.com)
West Texas Intermediate crude. Daily close
The sharp spike lower held and reversed just short of support at line F ($25.97) to turn bullish as fast as the price fell to below $20/bbl. Resistance at line Y ($39.49) is the first hurdle to cross if the bull market is to continue much higher, with line D ($45.68) as the strongest resistance to a sustained bull trend. However, it is to be expected that the psychological $40/bbl, just off the resistance at line Y could set an end to a recovery crude.
The supply demand relationship still seems heavily weighted towards supply; with Iran now having greater scope for re-activating their oil fields – kept alive by their under the table sales to China and others – to full capacity and the global economy in a down trend, this imbalance may not change very soon.
Should the presumed effect of the price of crude on Wall Street continue to apply, the DJIA has further upside potential should the price of oil continue to extend its rebound off the support near line F.
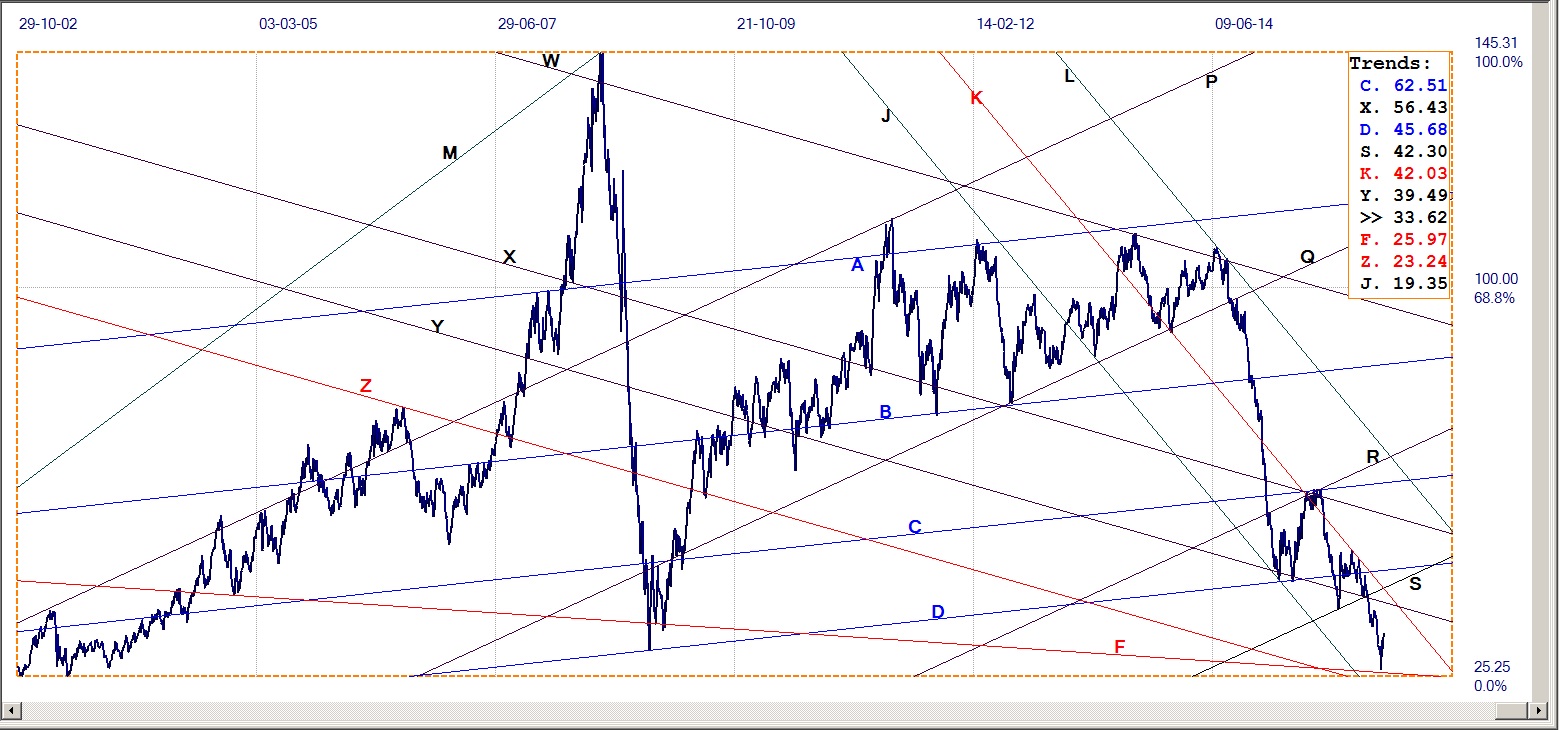
WTI crude – Daily close, last = $33.62 (Investing.com)
©2016 daan joubert, Rights Reserved
chartsym (at) gmail(dot)com


