Sure, There Is No Manipulation


When two opponents are locked in a quite evenly balanced bitter and struggle, the balance tends to sway first one way and then the other as either side manages to find and exploit an opportunity until the other counters it then pulls out all stops to regain any lost ground. Typically there is no clear victor and the result looks like a stalemate. Sometime, though, one side receives reinforcements to suddenly change a pending stalemate into victory. Wellington experienced that at the Waterloo. Wall Street can tell a similar tale.
The Prussian army under Blucher were allies of the British under Wellington when they ranged up against napoleon in Belgium in 1816. Blucher was handed a hiding by Napoleon in early June, partly because part of his forces was late in joining the main body. When Blucher received the news that the battle of Waterloo loomed, he sent his reinforcements marching to the battle and followed with the rest who had just suffered a defeat.
Late in the day, Wellington was giving way before the French advance when Blucher and his troops arrived on the scene and attacked the French right flank in the early evening. That cost Napoleon the battle. Two such fortune changing events that had happened on Friday can also be seen on the charts.
When bulls and bears are both committed to their views, but quite evenly matched, prices tend to oscillate up and down with now clear direction and that lasts either until the market closes or until one side receives strong reinforcement. This can be either fresh news that drastically change the outlook for the market or alternatively, when there is a sudden and large influx of support for one side.
In the absence of market changing news, it is most rare for a majority of the people on the sidelines to suddenly enter the market on the same side to determine what its outcome will be, be it bull or bear. Even then, the new rising or falling trend has a saw-toothed shape as the ebb and flow of the trading adjusts to the new trend. Over the years, in my experience, any continuous and consistent trend is the rare exception and it indicates not growing support for either the bulls or the bears, but the entrance into the market of an overwhelming force that simply takes out the bids or the offers, as the case might be, as soon as they are posted.
Examples of such forceful intervention on Wall Street during normal trading have become almost as common as the ‘waterfall attacks’ that are frequent occurrences on the gold and silver markets, driven by heavy and sustained selling of futures. On Friday, the situation was new, with potentially bearish news on Thursday and Friday with its usual ramping of prices on triple witching day – which surely also counts as a manipulation of the market as it is not based on proper price discovery.
The initial steep fear driven fall was soon stalled, to be followed by tentative recovery and then a volatile sideways trend with the usual bullish bias. The V-bottom at the intra-day low is also a feature often seen in the DJIA data – sign of a rapid change reacting to the early slide in prices or the effects of automated trading. In Friday’s trading the saw-tooth appearance of the trading activity until early during the afternoon is normal market behaviour as the price swings up and down under the strongly committed market forces of supply and demand.
Then the DJIA took off and sellers who had held back because of a stalemate in the market retreated to leave the bulls in command, so that for much of the rest of the day volume was on the low side. Later, volume picked up again as end of day and end of week squaring of positions took place as they always do, even on triple witch day. The lack of any corrections during the rally, with one brief and late exception, shows the effect of the equivalent of the Blucher triple witch Prussians entering Wall Street at the right time to make the most of triple witch. (Chart: MONEY-CNN). This is not normal market behaviour and presents the same picture seen on other than triple witch when other covert sources of intervention enter the market.


The second chart, from Kitco, shows a similar almost straight line and very steep bear trend on Friday’s hourly chart for silver, that lasted until near the end of the steep fall before some bargain buying is visible. The massive call option position on SLV with strikes from $16.50 and up has been widely discussed and late Thursday it still looked as if the calls would end in the money. Which they didn’t, of course, as I guess most experienced watchers of the PM market at least half expected.
The battle of control of the gold and silver markets that have been quite intense as from the mid-1990s and more so since 2011, is still continuing with no clear winner. Yes, the suppression of the price has been eminently successful since 2011, yet as happened after 2001, the near to medium trend in the price has turned around and it is now sideways to bullish, no longer bearish all the time.
There is still strong if demand for the metals, yet the real buyers must be happy to get what they need at a low price; no sense in rocking the boat. Speculative and investment bulls are largely impotent, because they are fragmented and cannot get a bull market going while the paper sellers market is not subject to any regulatory limits. We have to wait for the physical market to do that in a painful way.
While the PM physical market will become the factor that determines a fair price for gold and silver, with the shocks for the market that will entail, the stock market has the realities of the economy that at some point will over-ride all the attempts to keep Wall Street – and the DJIA in particular – near its extreme PE valuation. As has been discussed here often enough and will be again, working America is being impoverished in a systematic manner by the use of the manipulated CPI – doing so in a manner that keeps academic economists happy – that is also incorrectly being used by employers as a cost of living index to set wage and salary increases.
The result is that for some 20 years increases in the income of working households have lagged increases in real out of pocket costs and mounting household debt to cover the shortfall in disposable income. Of course, that means reduced ability to spend and with up to 80% of US households suffering a decline in net wealth, as was shown here in early April with a chart from Northman Trader , sooner or later that will compel Wall Street to adjust for a declining real economy. Since the process of impoverishment is continuing and unlike to be corrected without severe trauma to the economy, it is expected that Wall Street’s fall from its current lofty heights will not be brief in duration nor limited in extent. Time to go short and ride the position?
When that begins and builds momentum, it is unlikely that the Fed will again, as it did in early 2009, play a ‘Blucher at Waterloo’ role to come to the rescue of a much deteriorating situation.
Euro-Dollar
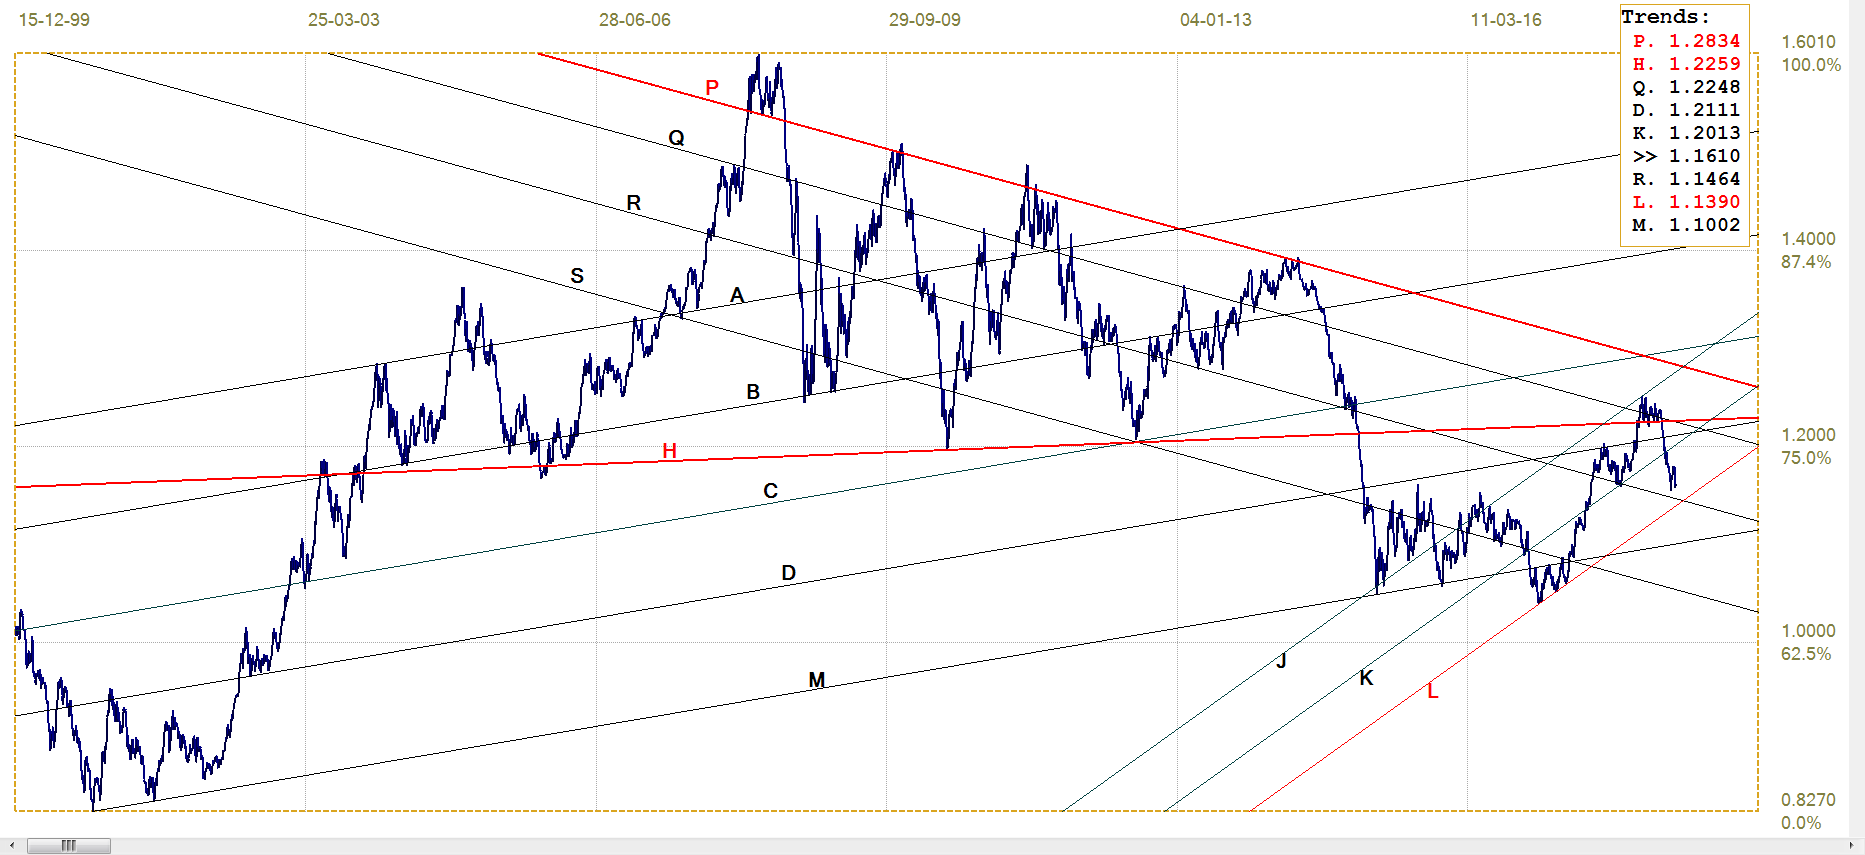
Euro-dollar, last = $1.1610 (www.investing.com)
The euro has also come under increased volatility – a combination of the way the dollar has been behaving and the increasing uncertainties in Europe. After the euro had rallied back above the $1.7 level following the sharp weakness that had taken it below $1.5 closer to line R ($1.1464), new weakness late last week had it briefly back below $1.6 and closing the week just above that level. It is still in bull channel KL ($1.1390) and holding quite well to be safe from a break below the bull channel to extend the new bear trend – at least so far.
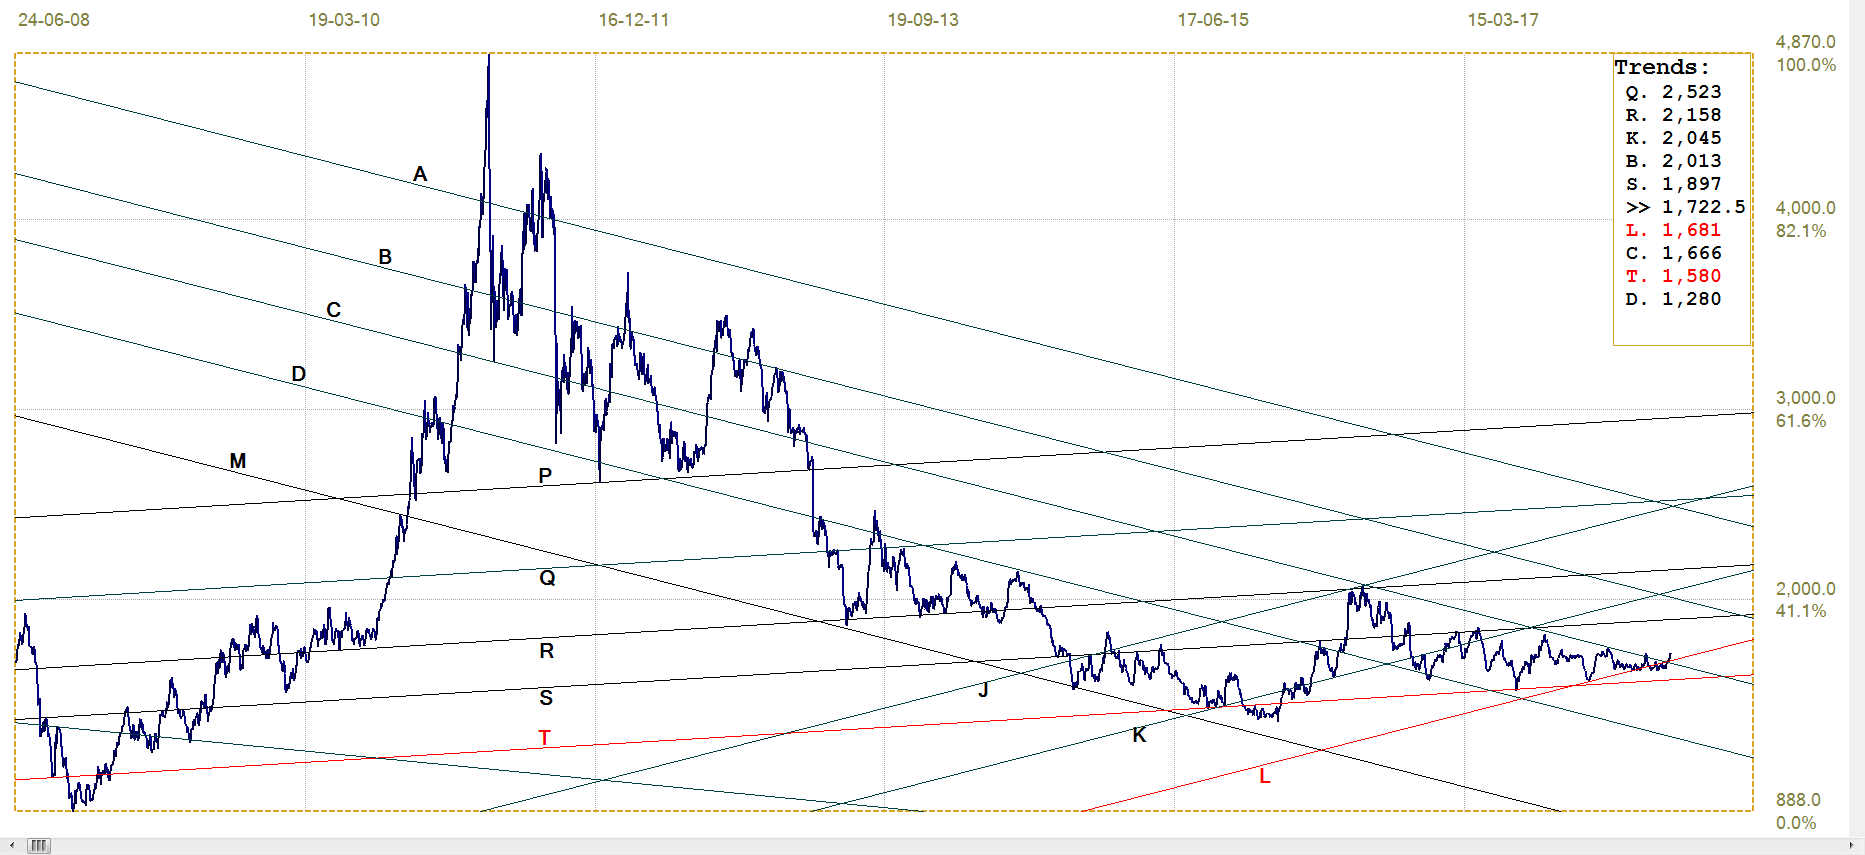
DJIA
Last week there was a break above line K (25 157) which was behaving much like a watershed trend line; a line that passes through the chart with only one or very few penetrations of the chart itself. Watershed line typically act as strong resistance and support when approached from either direction and the break higher reported last week was seen as an indication the bull trend would resume.
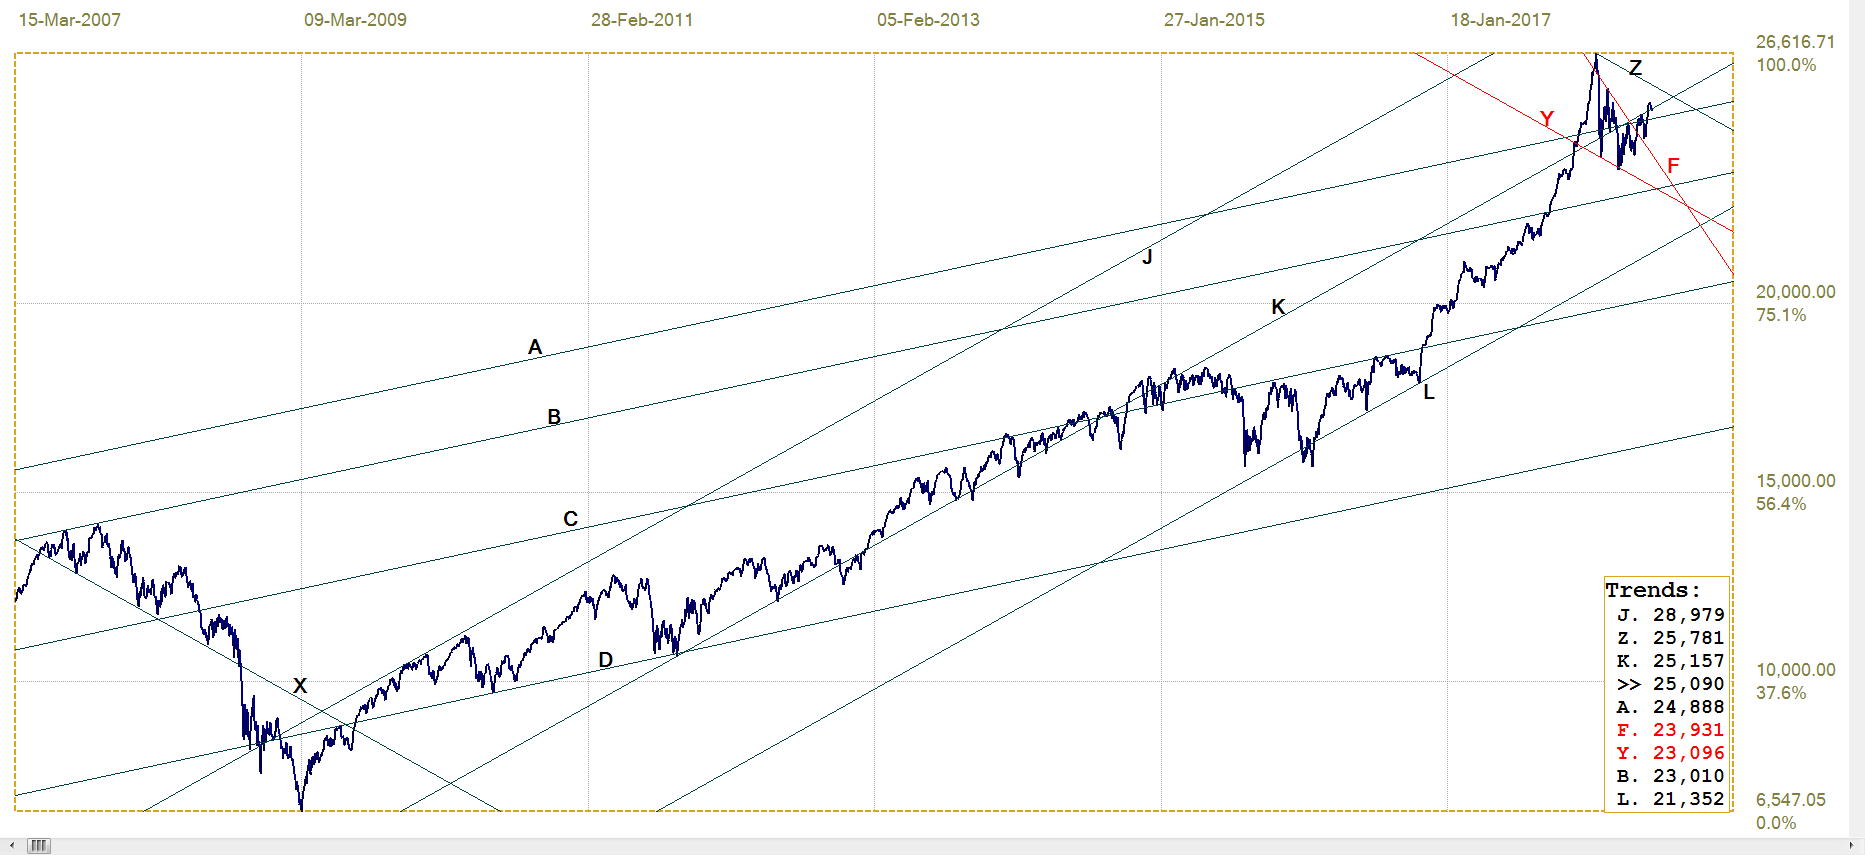
DJIA, last = 25090.48 (money.cnn.com)
It would appear from the early reaction on Wall Street on Friday that the reality of the rate increase coupled to the content of the IG report released on Thursday may have short circuited that bullish break. The DJIA closed back below line K and it remains to be seen whether the subsequent steep rally from near the day’s lows is an indication that the market has returned to its normal bullish mode or whether it was merely the ‘as usual’ triple witching ramping of prices. The market action on Monday should provide an early answer to this question.
Gold PM fix - Dollars
The support along line T ($1291) held to trigger a minor recovery – more a holding action rather than a bounce. Then the option expiration induced paper avalanche on Friday sent the price into the dustbin at the time of the London PM fix which is the data series being charted. The break is marginal and it is to be hoped that gold can now recover its momentum – but the end of the half year is almost on us and that too is a time when many OTC contracts and probably reporting deadlines become important to the powers that be.
July is a big delivery months for gold and Friday is First notice day so gold is not out of the woods as yet. As long as the price can recover above line T and then manage to hold the recovery, July should be a better month for the metal. The preliminary COMEX report for Friday noted that over 12 000 new gold contracts were added and one can assume that the shorts would prefer not to keep the price so very low as it had been on Friday; that could make this whole week look like a Black Friday for the bulls looking for a bargain.
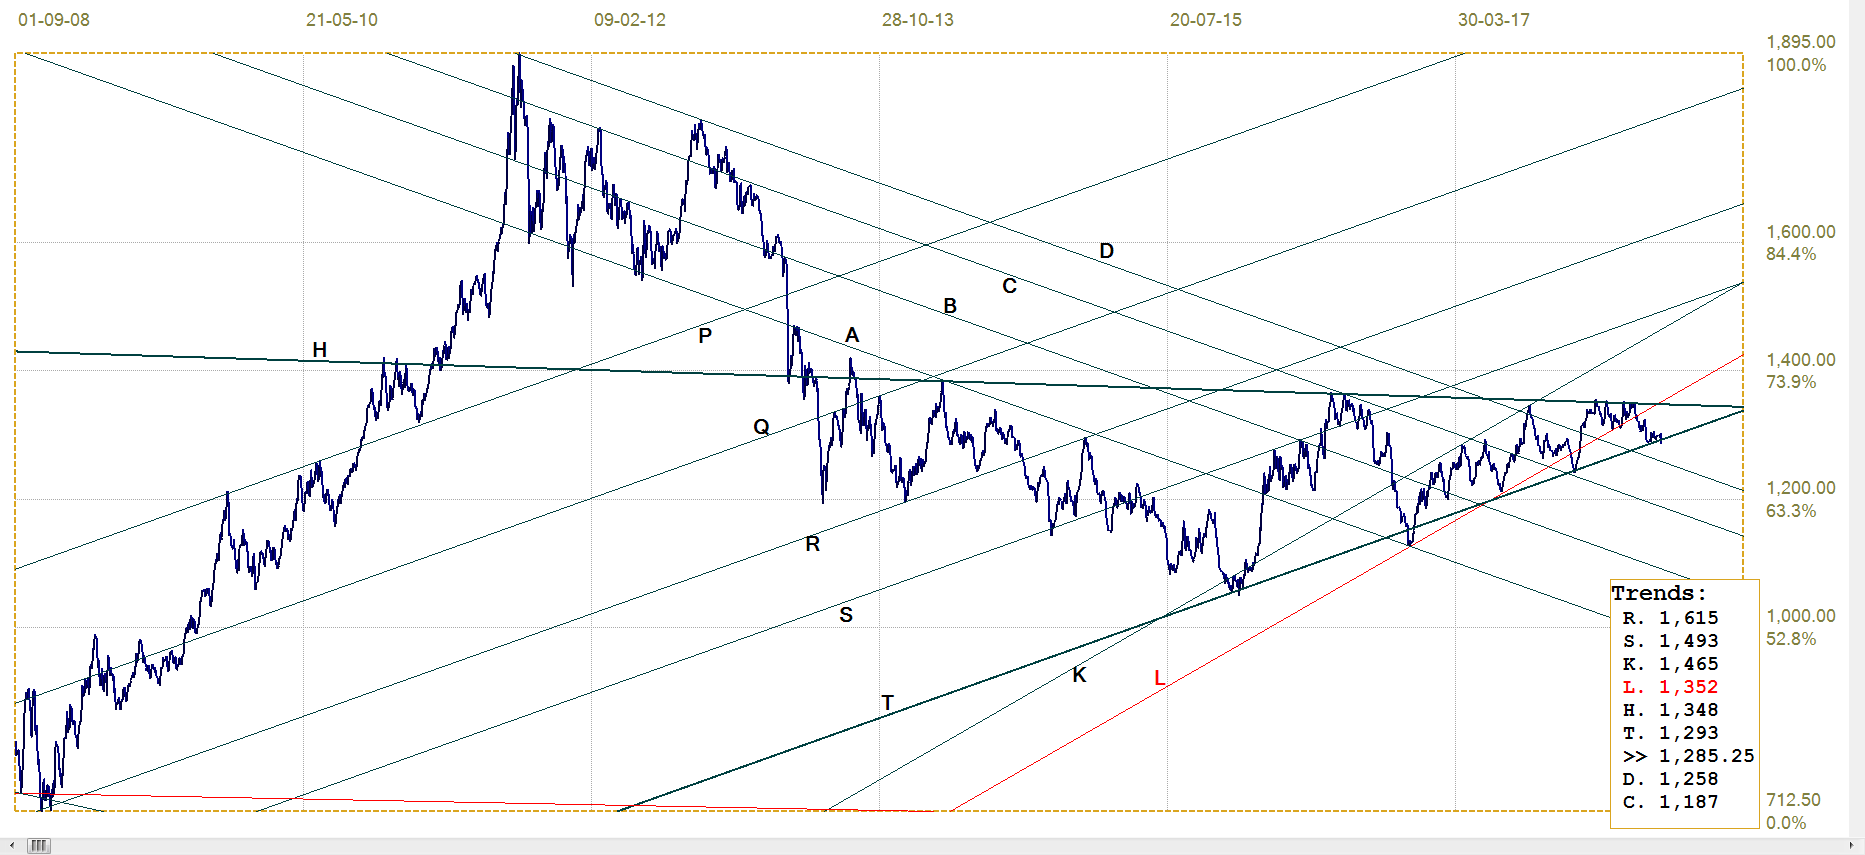
Gold price – London PM fix, last = $1285.25 (www.kitco.com )
Euro-gold PM fix
A week ago, the euro price of gold had already failed to hold the break back into bull channel KL (€1128), but at least the price then had not dropped back into the bear channel YZ (€1094). This week brought little change; the price has not tested the support at line Z, but the weaker trend in the euro towards the end of the week had helped the euro price to recover not too far from challenging the resistance at line L.
The sharply weaker gold price at the time of the PM fix on Friday countered some of the euro weakness and perhaps helped prevent a solid challenge on line L. Given that gold may well be kept low this whole week – if not as low as on Friday to stop too exuberant buying of futures and options – it largely will depend on what the euro does this week whether a recovery into bull channel KL is a possibility or not. With the euro now apparently range bound, the euro price of gold may also remain in a do nothing much range.
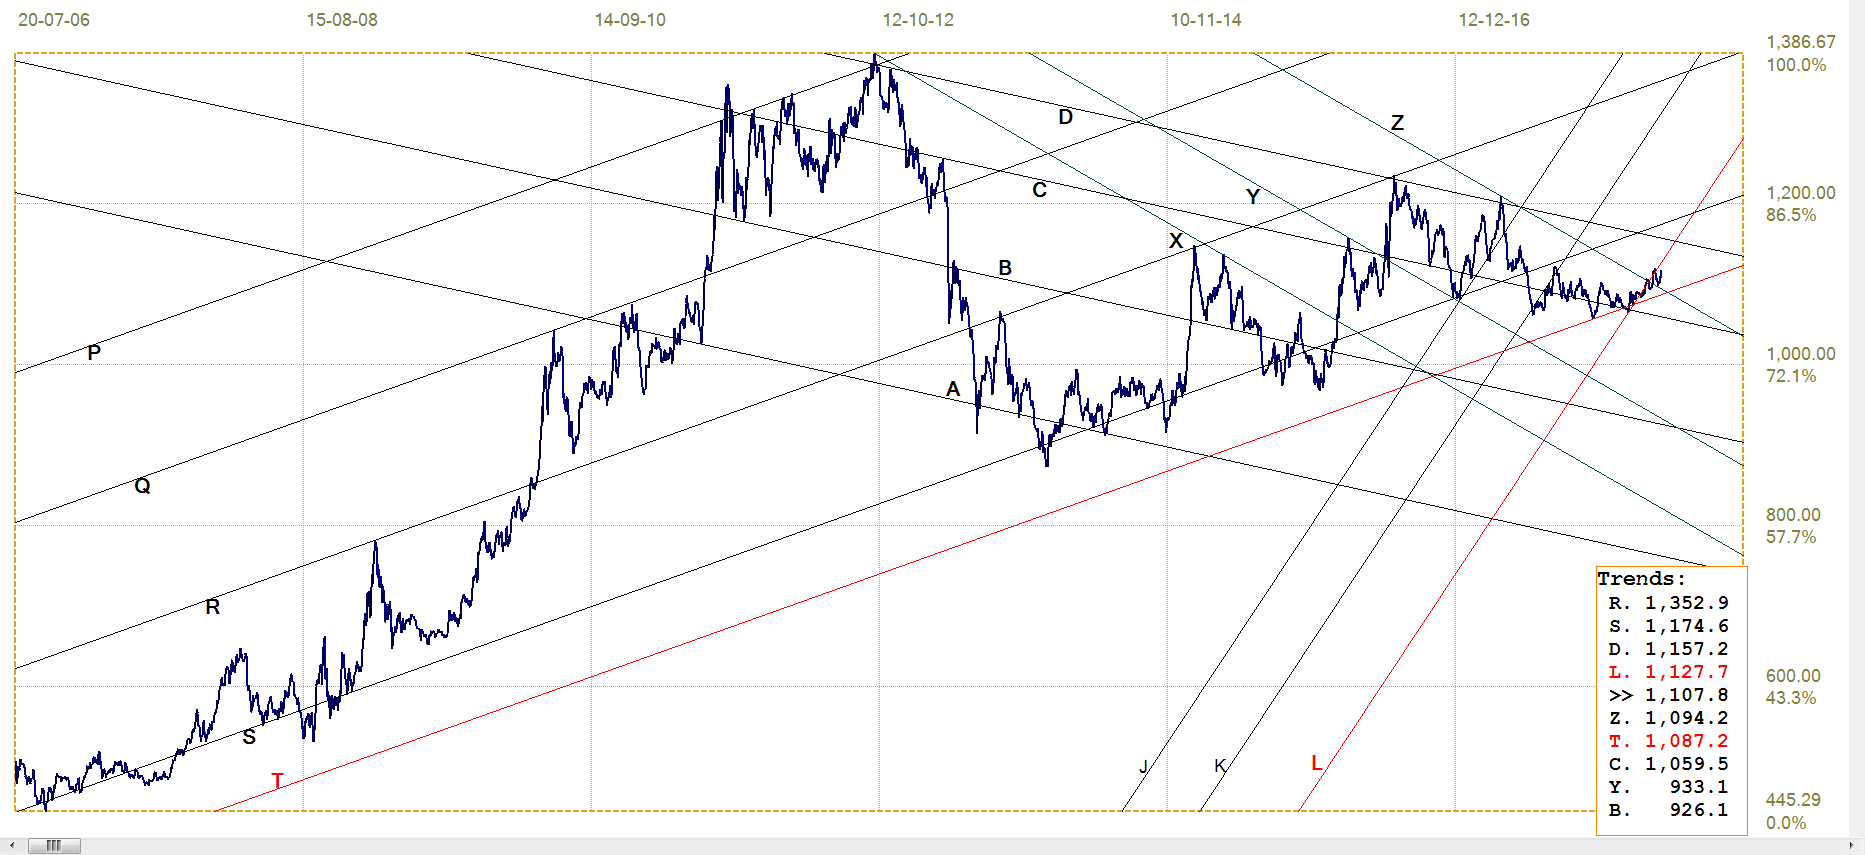
Euro gold price – PM fix in Euro, last = €1107.8 (www.kitco.com)
Silver Daily London Fix
‘Silver is back and well clear above the important $16.50 level across which it has been bouncing repeatedly for quite some time.’
That is how the comment set off last week, and it ended with ‘A definite and lasting break above line L ($16.76) is needed to rekindle optimism of a new bull trend for silver.’ Line L ($16.81) is edging higher and while an inviting target for quite some time, it was blasted out of the water when the price of silver also blew through the $17 level, to be fixed at $17.225 in London on Friday morning – before the bottom was removed from the silver market for the price to drop back below $16.50.
Perhaps things will change for the better after the month of June is history.
Silver daily London fix, last = $17.225 (www.kitco.com)
U.S. 10-year Treasury Note

U.S. 10-year Treasury note, last = 2.948% (www.investing.com )
The recent high volatility in what is said to be the largest single market in the world in terms of its total capitalisation is an indication of the degree of uncertainty that is prevalent among investors and analysts as well. Interest rates are said to move up by another two notches during the remainder of 2018 and, given the very low base where the increases had started, the effect on the market should be substantial.
The sharp breaks above line C (2.972%) and the psychological 3% have failed to hold, but the breaks higher and steep corrections reveal how strongly and probably almost in unison the market reacts to changing perceptions of what will happen. It means that if there happen to be some significant event – of a bearish rather than bullish nature – a lasting sell-off out of a market that is widely admitted to be quite over-bought is possible, with widespread effects in many other markets.
While line C holds, it can be expected that the Treasury market will remain in a ‘wait and see’ attitude, perhaps still with some volatility. There was a recovery from the break higher, but with more rate hikes expected, a new break above line C and repeated at the 3% level this time could break into and then hold in bear channel PQ (3.147%). The effects would not take long to snowball into other markets.
West Texas Intermediate crude. Daily close
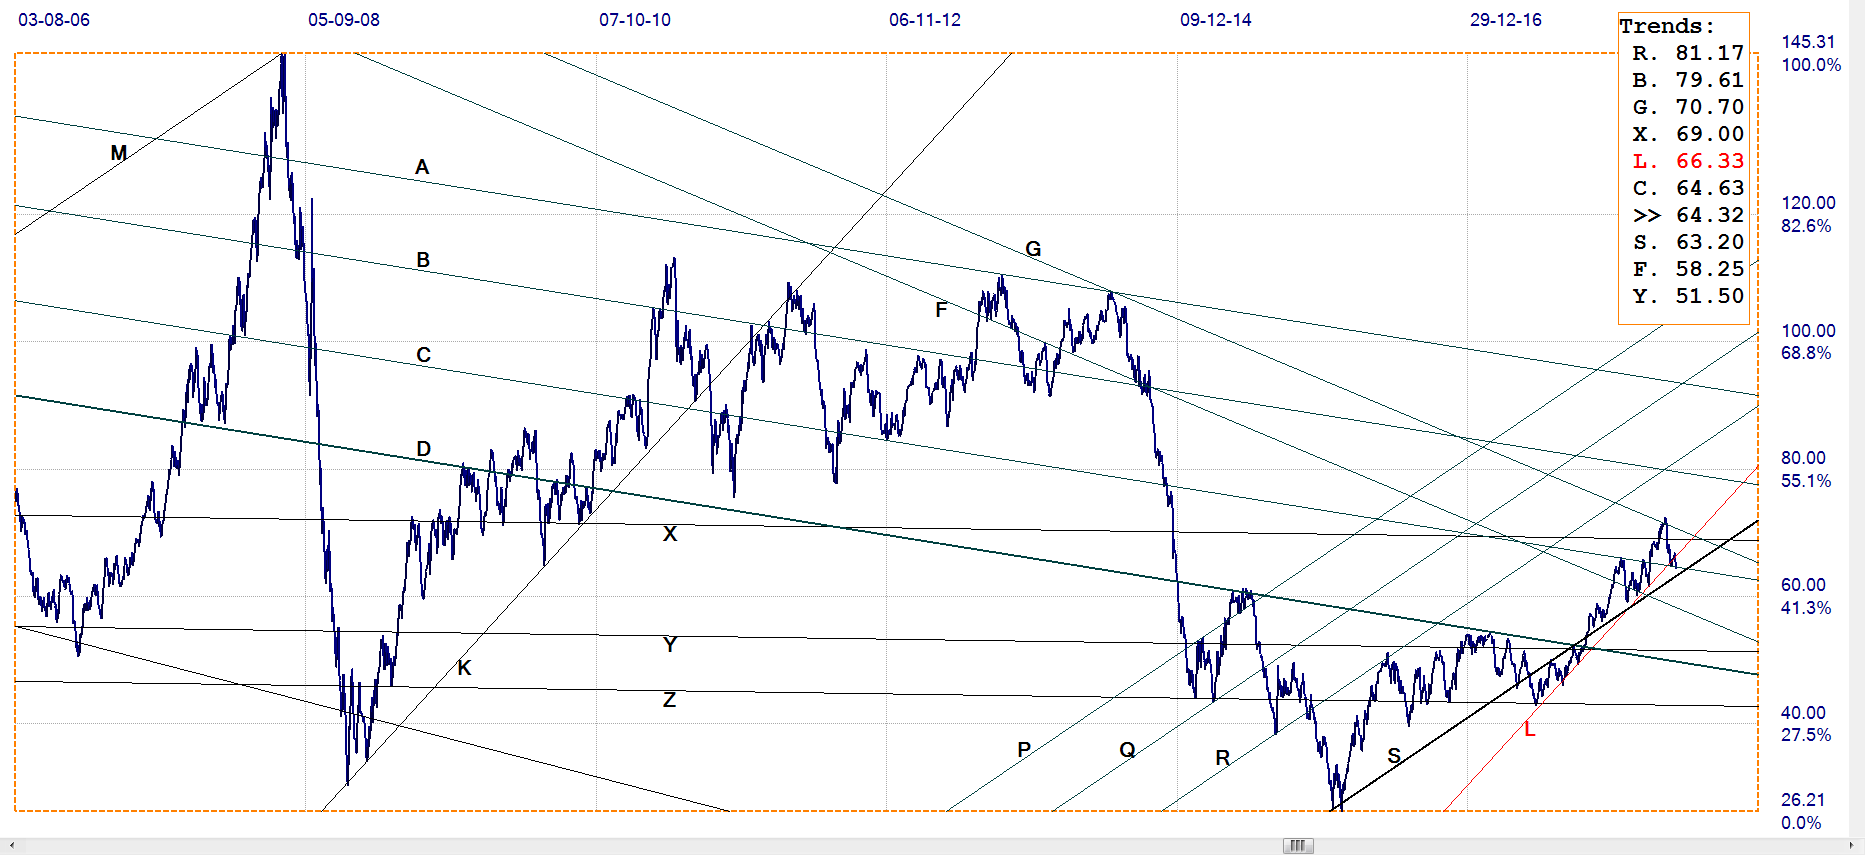
WTI crude – Daily close, last = $64.32 (www.investing.com )
The minor and break above the horizontal resistance at line X ($69.00) and then also at line G ($70.70), seemed the start of a bull trend. This was not to be, as the price reversed suddenly, to break back below lines G and X.
Support at line C ($64.63) then came into play and the price of crude has held to that support until now – still marginally below the very broad bull channel KL. Bull channel RS ($63.20) is also still intact and implies that the crude oil bull market is likely to break higher in due course, provided the channel holds.
For the time being it is likely to be a matter of wait and see what happens – there is ample room for now between lines C and S for the price to amble up and down without a clear trend.
*********


