Technical Analysis Of Major Markets


Gold
Daily Gold Compressed (b) Chart:

On the attached Daily Gold chart, showing our preferred compressed wave (b) triangle Option, it looks like wave .b. of –d- may have ended at yesterday’s early morning low of 1171.90.
We have a clear key daily reversal up also. If that is the case we should soon be rallying (post FOMC?) in an impulsive sequence in wave .c. of -d-. In yesterday’s End of Day Post we provided some projections for the end of wave .c. These projections are:
.c. = .a. = 1201.70;
.c. = 1.618.a. = 1220.00;
.c. = 2.168.a. = 1249.60.
For our compressed wave (b) triangle Option to remain valid wave -d-cannot trade above the wave -b- high of 1232.00, which would mean that if we reach the 2.618.a. projection, then something else is happening in gold., although that something else would be bullish.
In the overnight session, gold dropped to a low of 1182.10, but it looks like on the Intraday Chart that we have a 3 wave drop from 1189.80 to 1182.10. This is bullish and suggests to us that gold is going to rally above the 1189.80 high shortly. The FOMC meeting on Wednesday could set it in motion, but this is a triangle formation:
Remember that analysing legs of triangles is always a challenge, so we should always expect the unexpected.
No change to our current 17 long positions, risking to 1141.50!
Crude

Crude rallied to 60.80 in the overnight session. On the Intraday Chart it is difficult to try and make out the corrective wave patterns that we believe comprise wave ^c^.
This is typical of legs of triangles as they are made of at least a single, but usually multiple 3 wave patterns.
We can have up to 3 such patterns separated by !x! waves. For the time being we will continue to assume that we are in a complex wave ^c^, and we expect this leg to drop to around the 57.50, where we plan to take profits on our short positions.
Our updated wave *iv* triangle count is:
^a^ = 56.52;
^b^:
!a! = 61.58;
!b! = 56.86;
!c! = 61.81, if complete to complete all of wave ^b^. Note that !c!=!a!=61.90;
^c^ drop will be next, with waves ^d^ and ^e^ to go, to complete all of the wave *iv* triangle.
Wave ^c^ cannot drop below the wave ^a^ low of 56.52, for this current triangle pattern to remain valid.
We are short 5 positions, risking to 61.25, and taking profits at 57.50.
We are also short Suncor, risking to 33.50.

As you can see on the attached Weekly Suncor Chart, that we are nearing the lower red trend line of our multi-year wave b triangle.
We are probably a month or so from breaking that lower trend line, as we suspect that crude will need to complete its wave -iv- rally first. A break of the lower red trend line will see a major collapse in Suncor stock.
The collapse will likely be driven by falling crude prices in wave -v- and a dramatic increase in taxes, royalties and the suspension for all crude pipeline construction by the communist NDP provincial government that was recently elected in the Province of Alberta.
They have already announced a 20% increase in the corporate tax rate from 10% to 12% and have recently hired an anti-pipeline lobbyist from Vancouver to become the Chief of Staff for the Energy Minister, who is also against new oil sand development and pipeline construction. The new Energy Minister also wants to close all coal plants by 2020.
Our minimum target for Suncor is 13.10, which is a huge drop of over 50% from current levels.
S&P500
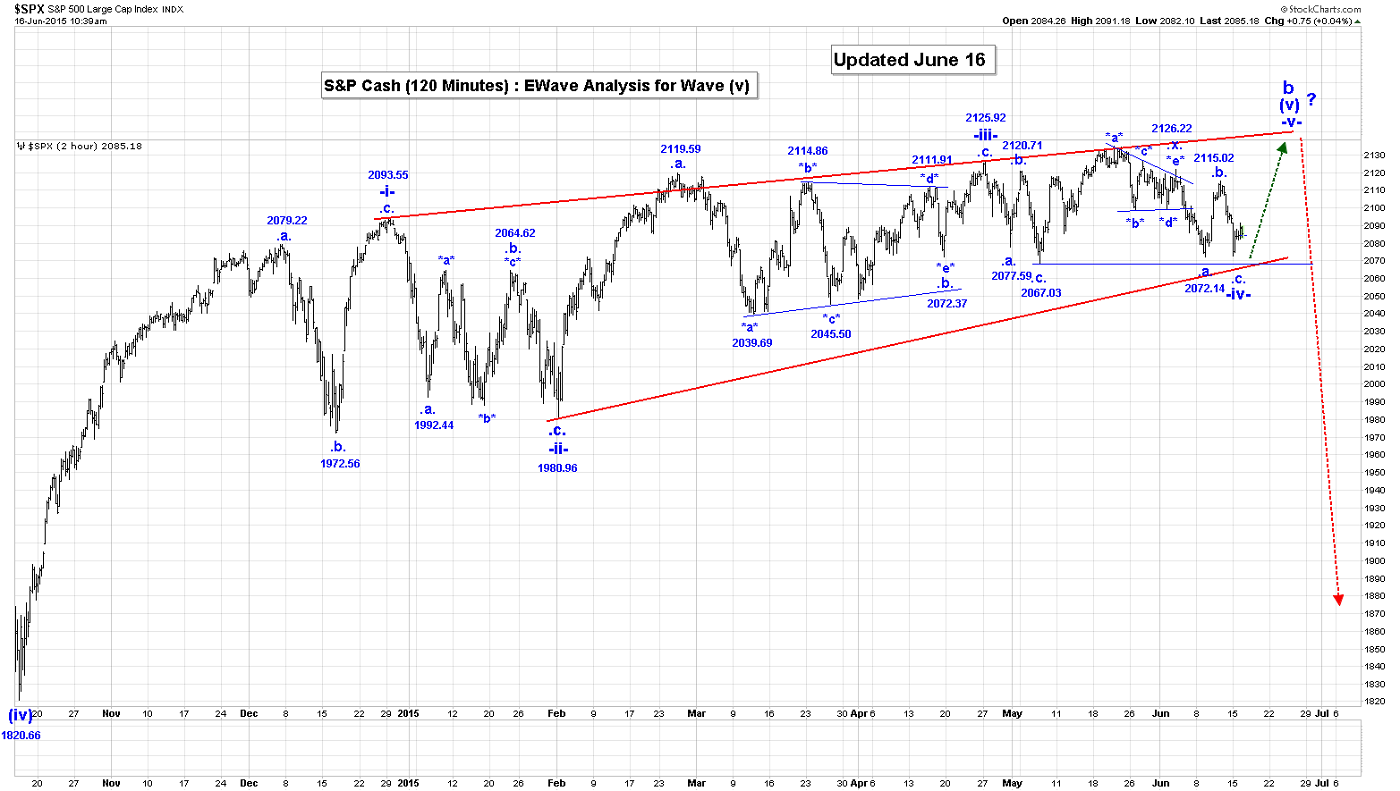
We expect as a minimum that the S&P will drop to our target of 2067.00. We plan to take very nice profits at that point.
This drop should complete wave -iv-. Upon completion of wave -iv- we still expect to see the S&P rally to an all-time new highs in wave -v-. Wave -v- will consist of at least one .a., .b., .c. pattern, but could have up to 3 such sequences.
Our current updated count for all of wave -iv- looks like:
.a. = 2077.59;
.b. = 2120.71;
.c. = 2067.03;
.x. = 2126.22;
.a. = 2072.14;
.b. = 2115.02, if complete;
.c. drop to go to at least the 2067.03 low to complete wave -iv-.
Once we drop below 2067.03, our current alternate will be eliminated. That alternate would be that wave -iv- ended as a failure at 2072.14 and that we are already working on wave -v- as follows:
.a. = 2115.02;
.b. drop is now;
.c. rally to at least the 2134.72 to complete all of wave -v-.
In the overnight session the S&P futures reached the 2062 level.
We are short 3 SP500 positions at 2115, with 2125 calls and will take profits on our shorts at 2067.
USDX
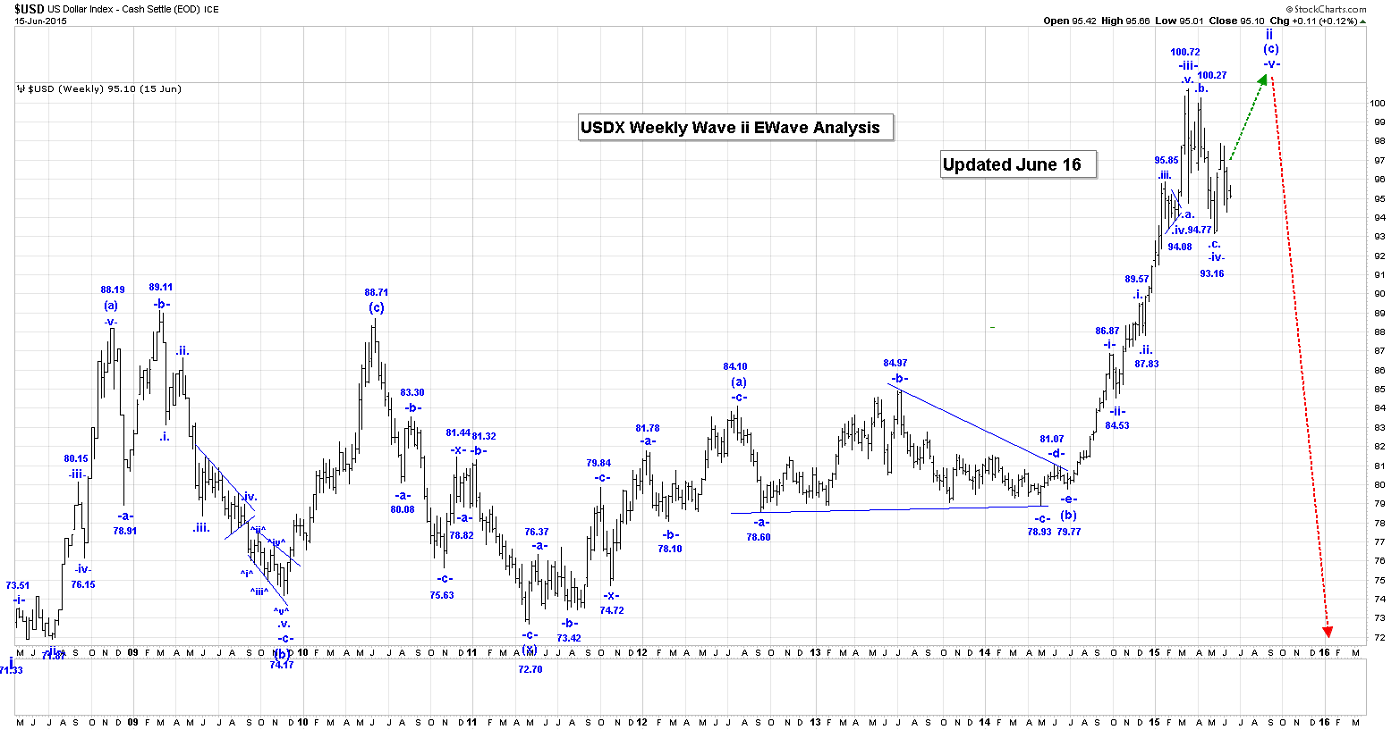
The USDX continued to churn in a narrow range. We reached a low of 94.81 in the overnight session.
We have modified our count for wave ^ii^ below, as it looks like wave !b! could be forming a bullish triangle. Our trading strategy remains unchanged also.
Our modified wave -iv- count looks like:
*a* = 94.88;
*b* = 100.27;
*c* = 93.16;
*x*:
^a^ = 95.94;
^b^ = 94.89;
^c^ = 97.87, to complete wave *x*;
*a* = 94.67;
*b* = 96.95;
*c*:
^i^ = 94.30;
^ii^:
!a! = 95.62;
!b! triangle is still underway
!c! rally to come to complete all of wave ^ii^.
Once we believe that wave !b! is complete we will be able to provide projections for the end of wave !c!.
Our wave ^ii^ retracements remains unchanged as:
50% = 96.10
61.8% = 96.50.
The minimum target for the second wave *c* is the bottom of the first wave *c* which is 93.16. Another projection is:
*c*=1.618*a* = 91.77
We will short 5 USDX positions at 96.40, risking to 96.96.
NG
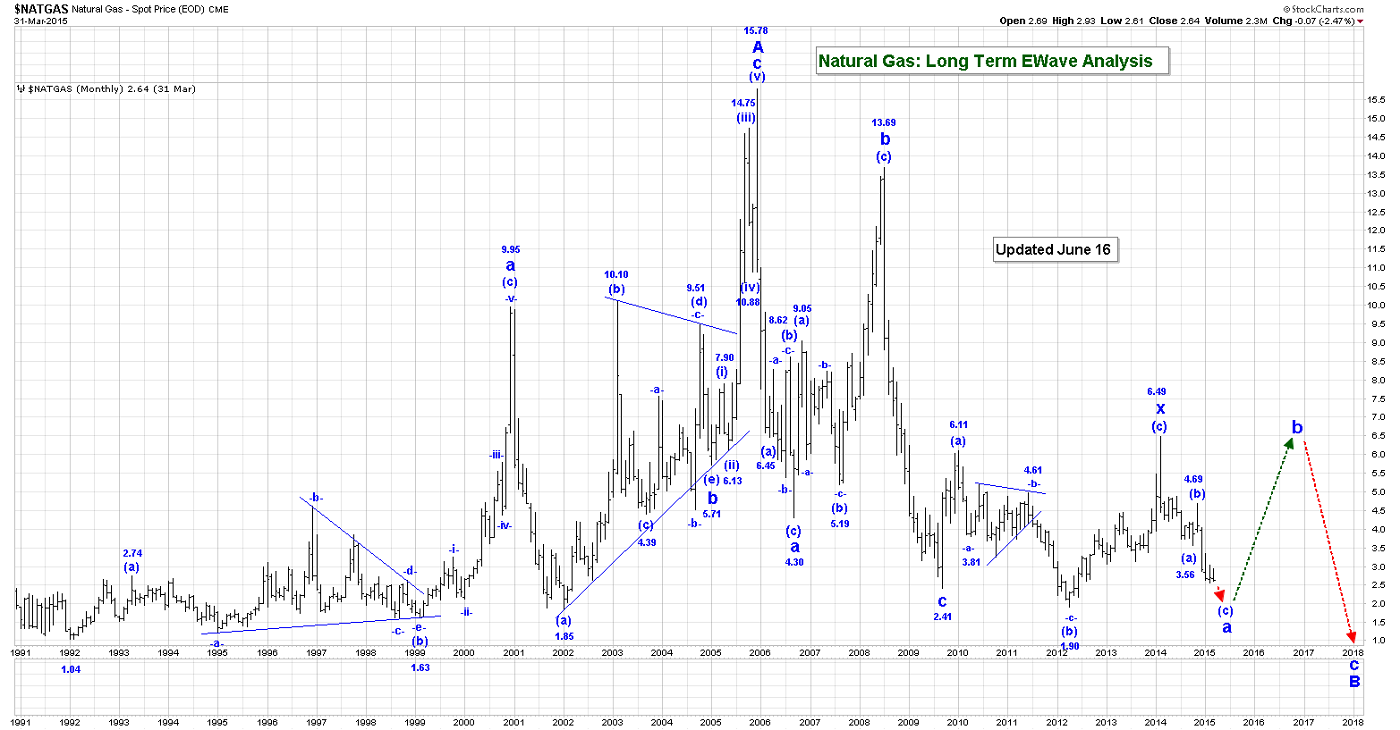
Our wave -iv- triangle would look like:
.a. = 3.11;
.b. = 2.56.
.c. is now and cannot rally above the wave .a. high of 3.11;
.d. and .e. to go, to complete all of wave -iv-.
There are likely not any trading opportunities for this market until this wave -iv- triangle plays itself out, so our comments to this market will remain brief until we see that opportunity present itself.
HUI/GDX

We suspect that wave(c) has finally ended at 18.42 and that wave (d) is now underway, or will be after the FOMC announcement tomorrow!!
Long GDX risking to 17.28.
NEWMONT

Newmont appears to be building an inverse head and shoulders pattern, following its key trend line breakout to the upside. A breakout above the neckline should launch the massive and much-awaited C-wave advance to new highs!
BARRICK

Barrick has also broken its key downtrend line. Some backing and filling is normal after these kinds of breakouts, but that appears to be almost complete, and long term investors should be significant accumulators of the stock in this price area, in preparation for an upcoming major C wave higher!
********
Email: [email protected]
Website: www.captainewave.com
Risk: CAPTAINEWAVE.COM IS AN IMPERSONAL ADVISORY SERVICE. AND THEREFORE, NO CONSIDERATION CAN OR IS MADE TOWARD YOUR FINANCIAL CIRCUMSTANCES. ALL MATERIAL PRESENTED WITHIN CAPTAINEWAVE.COM IS NOT TO BE REGARDED AS INVESTMENT ADVICE, BUT FOR GENERAL INFORMATIONAL PURPOSES ONLY. TRADING STOCKS DOES INVOLVE RISK, SO CAUTION MUST ALWAYS BE UTILIZED. WE CANNOT GUARANTEE PROFITS OR FREEDOM FROM LOSS. YOU ASSUME THE ENTIRE COST AND RISK OF ANY TRADING YOU CHOOSE TO UNDERTAKE. YOU ALSO AGREE TO BEAR COMPLETE RESPONSIBILITY FOR YOUR INVESTMENT RESEARCH AND DECISIONS AND ACKNOWLEDGE THAT CAPTAINEWAVE.COM HAS NOT AND WILL NOT MAKE ANY SPECIFIC RECOMMENDATIONS OR GIVE ADVICE TO YOU OR ANY OF ITS CLIENTS UPON WHICH THEY SHOULD RELY. CAPTAINEWAVE.COM SUGGESTS THAT THE CLIENT/MEMBER TEST ALL INFORMATION AND TRADING METHODOLOGIES PROVIDED AT OUR SITE THROUGH PAPER TRADING OR SOME OTHER FORM OF TESTING. CAPTAINEWAVE.COM, ITS OWNERS, OR ITS REPRESENTATIVES ARE NOT REGISTERED AS SECURITIES BROKER-DEALERS OR INVESTMENT ADVISORS EITHER WITH THE U.S. SECURITIES AND EXCHANGE COMMISSION OR WITH ANY STATE SECURITIES REGULATORY AUTHORITY. WE RECOMMEND CONSULTING WITH A REGISTERED INVESTMENT ADVISOR, BROKER-DEALER, AND/OR FINANCIAL ADVISOR. IF YOU CHOOSE TO INVEST WITH OR WITHOUT SEEKING ADVICE FROM SUCH AN ADVISOR OR ENTITY, THEN ANY CONSEQUENCES RESULTING FROM YOUR INVESTMENTS ARE YOUR SOLE RESPONSIBILITY.
ALL INFORMATION POSTED IS BELIEVED TO COME FROM RELIABLE SOURCES. CAPTAINEWAVE.COM DOES NOT WARRANT THE ACCURACY, CORRECTNESS, OR COMPLETENESS OF INFORMATION AVAILABLE FROM ITS SERVICE AND THEREFORE WILL NOT BE LIABLE FOR ANY LOSS INCURRED. DUE TO THE ELECTRONIC NATURE OF THE INTERNET, THE CAPTAINEWAVE.COM WEBSITE, ITS E-MAIL & DISTRIBUTION SERVICES AND ANY OTHER SUCH "ALERTS" COULD FAIL AT ANY GIVEN TIME. CAPTAINEWAVE.COM WILL NOT BE RESPONSIBLE FOR UNAVAILABILITY OF USE OF ITS WEBSITE, NOR UNDELIVERED E-MAILS, OR "ALERTS" DUE TO INTERNET BANDWIDTH PROBLEMS, EQUIPMENT FAILURE, OR ACTS OF GOD. CAPTAINEWAVE.COM DOES NOT WARRANT THAT THE TRANSMISSION OF E-MAILS, OR ANY "ALERT" WILL BE UNINTERRUPTED OR ERROR-FREE. CAPTAINEWAVE.COM WILL NOT BE LIABLE FOR THE ACTS OR OMISSIONS OF ANY THIRD PARTY WITH REGARDS TO CAPTAINEWAVE.COM DELAY OR NON-DELIVERY OF THE CAPTAINEWAVE.COM NIGHTLY EMAILS OR "ALERTS". FURTHER, WE DO NOT RECEIVE ANY FORM OF PAYMENT OR OTHER COMPENSATION FOR PUBLISHING INFORMATION, NEWS, RESEARCH OR ANY OTHER MATERIAL CONCERNING ANY SECURITIES ON OUR SITE OR PUBLISH ANY INFORMATION ON OUR SITE THAT IS INTENDED TO AFFECT OR INFLUENCE THE VALUE OF SECURITIES.
THERE IS NO GUARANTEE PAST PERFORMANCE WILL BE INDICATIVE OF FUTURE RESULTS. NO ASSURANCE CAN BE GIVEN THAT THE RECOMMENDATIONS OF CAPTAINEWAVE.COM WILL BE PROFITABLE OR WILL NOT BE SUBJECT TO LOSSES. ALL CLIENTS SHOULD UNDERSTAND THAT THE RESULTS OF A PARTICULAR PERIOD WILL NOT NECESSARILY BE INDICATIVE OF RESULTS IN FUTURE PERIODS. THE RESULTS LISTED AT THIS WEBSITE ARE BASED ON HYPOTHETICAL TRADES. PLAINLY SPEAKING, THESE TRADES WERE NOT ACTUALLY EXECUTED. HYPOTHETICAL OR SIMULATED PERFORMANCE RESULTS HAVE CERTAIN INHERENT LIMITATIONS. UNLIKE AN ACTUAL PERFORMANCE RECORD, SIMULATED TRADES DO NOT REPRESENT ACTUAL TRADING. ALSO, SINCE THE TRADES HAVE NOT ACTUALLY BEEN EXECUTED, THE RESULTS MAY HAVE OVER OR UNDER COMPENSATED FOR THE IMPACT, IF ANY, OF CERTAIN MARKET FACTORS SUCH AS LACK OF LIQUIDITY. YOU MAY HAVE DONE BETTER OR WORSE THAN THE RESULTS PORTRAYED. NO REPRESENTATION IS BEING MADE THAT ANY ACCOUNT WILL OR IS LIKELY TO ACHIEVE PROFITS OR LOSSES SIMILAR TO THOSE SHOWN. NO INDEPENDENT PARTY HAS AUDITED THE HYPOTHETICAL PERFORMANCE CONTAINED AT THIS WEBSITE, NOR HAS ANY INDEPENDENT PARTY UNDERTAKEN TO CONFIRM THAT THEY REFLECT THE TRADING METHOD UNDER THE ASSUMPTIONS OR CONDITIONS SPECIFIED HEREAFTER. WHILE THE RESULTS PRESENTED AT THIS WEBSITE ARE BASED UPON CERTAIN ASSUMPTIONS BELIEVED TO REFLECT ACTUAL TRADING CONDITIONS, THESE ASSUMPTIONS MAY NOT INCLUDE ALL VARIABLES THAT WILL AFFECT, OR HAVE IN THE PAST AFFECTED, THE EXECUTION OF TRADES INDICATED BY CAPTAINEWAVE.COM. THE HYPOTHETICAL RESULTS ON THIS WEBSITE ARE BASED ON THE ASSUMPTION THAT THE CLIENT BUY AND SELLS THE POSITIONS AT THE OPEN PRICE OF THE STOCK. THE SIMULATION ASSUMES PURCHASE AND SALE PRICES BELIEVED TO BE ATTAINABLE. IN ACTUAL TRADING, PRICES RECEIVED MAY OR MAY NOT BE THE SAME AS THE ASSUMED ORDER PRICES.


