Technical Analysis Of Major Markets


Gold

We had mentioned in both of yesterday’s Posts, that we did not see an impulsive wave structure on the Intraday Chart in the rally from the 1073.00 low to 1097ish high.
That suggested to us, unfortunately, that the 1073.0 low is going to be revisited again.
In the overnight session, gold reached a low of 1076.40, at the time that this Post was being written. The drop from the 1097ish area to the current low looks like an incomplete impulsive drop. This also suggests that gold is heading back to the 1073.00 low.
If we trade below the 1072.30, Daily Continuous Futures low, our current preferred analysis will be eliminated and our current alternate will become our preferred.
That current alternate suggests that gold is working on wave -v- of our second wave (c) of 4. Our second wave (c) is an ending diagonal triangle.
We are long 20 positions, with puts at 1085.00!
Crude
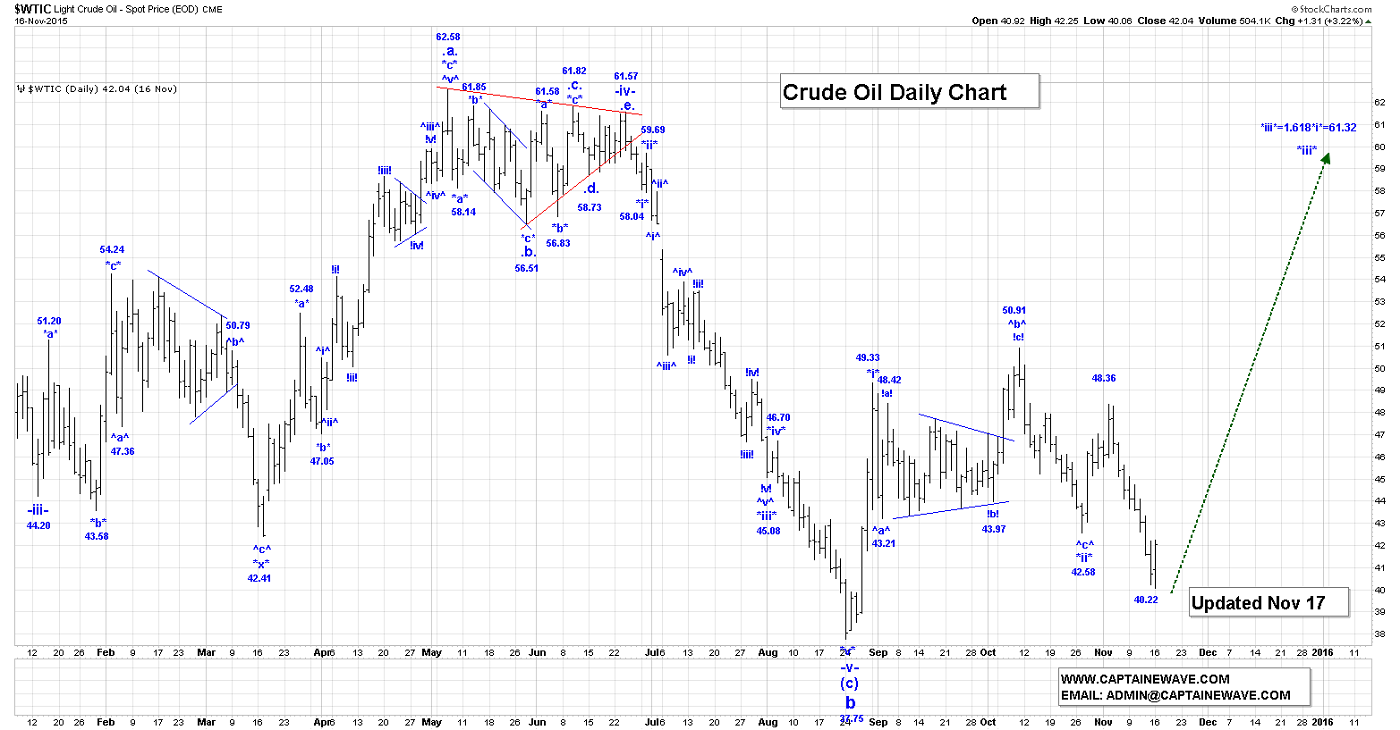
We saw a couple of very positive signs for the bulls in yesterday’s crude trading session. The rally from 40.06 to 42.25 looks to be impulsive on the Intraday Chart and we had a key daily reversal higher on the Daily Chart.
We continue to believe that all of wave *ii* is complete at the 40.06 low, although we still not have been able to identify the wave structure within that wave *ii* correction.
A drop now below the 40.06 low would suggest that crude is heading back to the 37.75 low.
In the overnight session, crude reached a low of 41.13, at the time that this Post was being written. On the Intraday Chart the drop from 42.25 to the current low of 41.13 looks corrective, which supports higher prices, after this correction ends.
Although it is a bit early to start with the labelling, it seems reasonable to assume that the corrective rally should retrace between 50 to 61.8% of the previous impulsive move. Those levels are:
50% = 41.15;
61.8% = 40.90.
We are now at roughly the 50% retracement level.
We are long 15 positions, with 42.00 puts, as stops!
S&P500
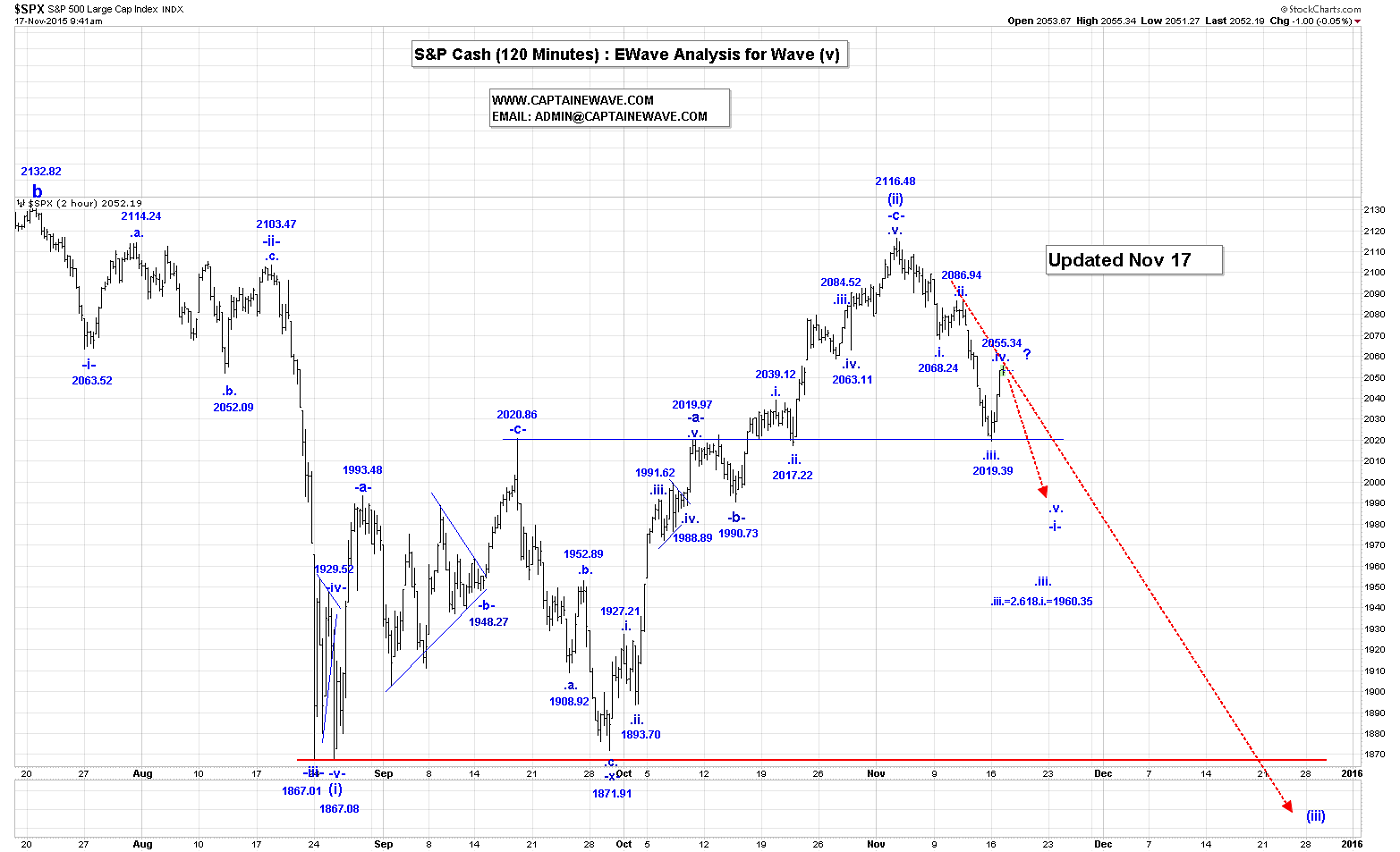
We are working on the assumption that the current rally is wave .iv., within our first impulsive sequence from the wave (ii) high of 2116.48.
We believe that all or most of wave .iv. is complete at yesterday’s high of 2053.22, which is 50% retracement of the entire wave .iii. drop. Our other option is that wave .iii. is subdividing and currently looks like:
^i^ = 2019.39;
^ii^ = 2053.22, if complete;
^iii^ drop is next.
Our current preferred count for wave (iii) is as follows:
-i- :
.i. = 2068.24;
.ii. = 2086.94;
.iii. = 2019.39;
.iv. = 2053.22, if complete;
.v. drop to go to complete all of wave –i- of (iii).
We will take profits on our short positions at the end of wave -i- and short again at the end of the wave -ii- rally.
We cannot rule the possibility that wave .iii. will extend and reach our .iii. = 2.618.i. projection which is 1960.35.
In the bigger picture our first projection for the end of wave (iii) is, (iii)=1.618(i) = 1686.51. Since wave (ii) was so deep the end of wave (ii) will likely reach the (iii)=2.618(i) projection which is 1420.44.
We are short 5 positions, risking to 2087.00!
USDX

The USDX reached 99.78, in the overnight session, at the time that this Post was being written.
We have adopted the idea that wave -iv- ended at 92.54 and the current rally is wave -v-, which is now heading to at least the wave -iii- high of 100.71. The current count for wave -v- looks like:
.i. = 96.64
.ii. = 93.83
.iii. rally is now. Our .iii.=1.618.i. projection is 100.50.
NatGas

NG drooped to a low of 2.290, at the time that this Post was being written, in the overnight session. A drop back to the 1.95 low, appears likely now, as we have failed to close above the upper trend line of our ending diagonal a triangle. It looks like wave (iii) is still underway.
We are flat, with no positions!
HUI/GDX:
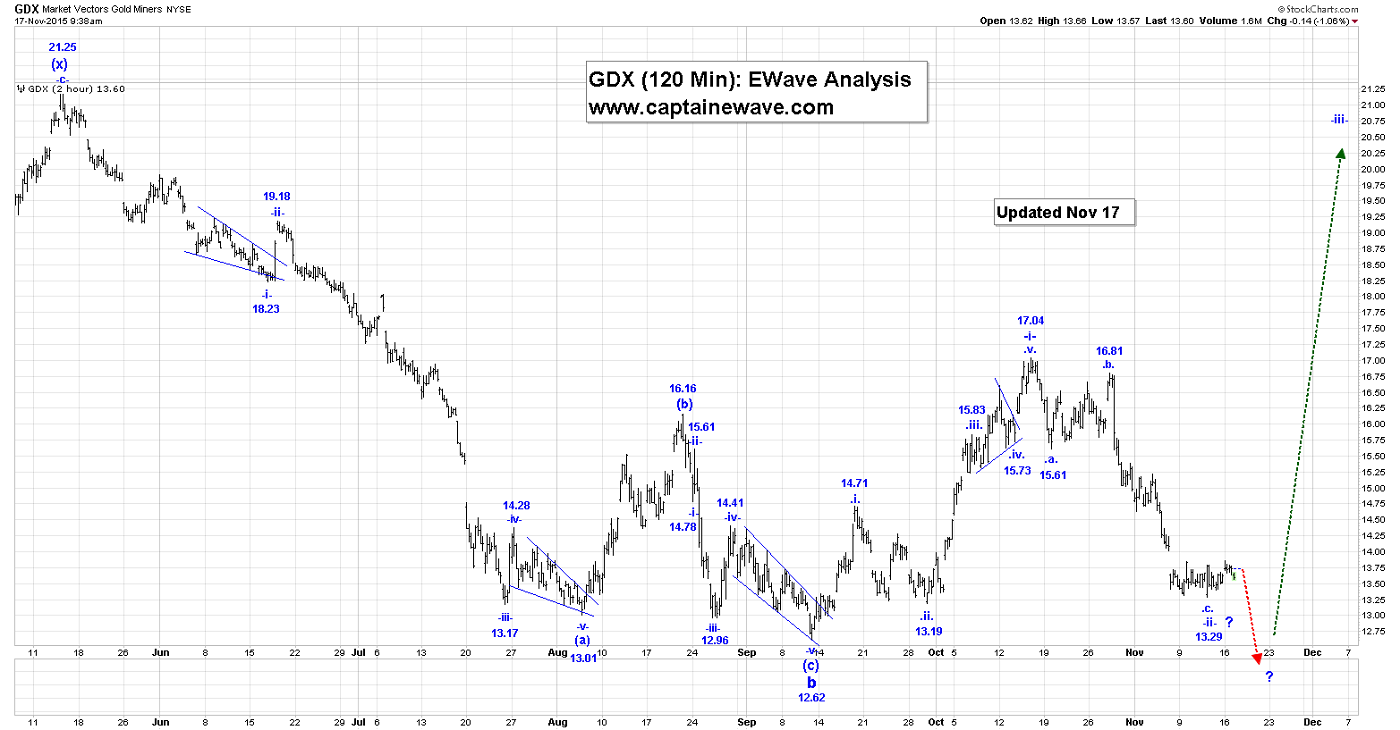
It is now very unlikely that the 13.29 low is the end of wave -ii- and we now expect that the GDX will drop below its current assumed wave B low of 12.62.
The HUI and XAU remain within their respective ending diagonal triangles and we will post those updated charts in our End of Day Post today!
Our current, but unlikely to remain correct count, is :
-i-:
.i. = 14.71;
.ii. = 13.19;
.iii. = 15.83;
.iv. triangle = 15.73
.v. = 17.04, to complete all of wave -i-;
-ii-:
.a. = 15.61
.b. = 16.81
.c. = 13.29, if complete to complete all of wave -ii-.
-iii- rally is next.
KINROSS

Kinross continues to trade within the basing channel, and the breakout to begin our C wave higher remains elusive, but the bullish implications are unchanged.
CLAUDE RESOURCES

Claude continues to “plod” higher, in the up channel, towards our 98 cent target. It’s our bell weather gold stock, and it continues to outperform the sector. All light pullbacks, including this one, can be bought by investors.
We are long the GDX, ABX, KGC, NEM, CRJ, and TSX:XGD with no stops!
CHINA STOCK MARKET (FXI)

Like the US stock market, China is rallying, but it’s a bear market rally, and our Ewave analysis suggests the rally will die in the $45 area, and the market will plunge drastically. Investors should avoid this market for now!
********
Email: [email protected]
Website: www.captainewave.com
Risk: CAPTAINEWAVE.COM IS AN IMPERSONAL ADVISORY SERVICE. AND THEREFORE, NO CONSIDERATION CAN OR IS MADE TOWARD YOUR FINANCIAL CIRCUMSTANCES. ALL MATERIAL PRESENTED WITHIN CAPTAINEWAVE.COM IS NOT TO BE REGARDED AS INVESTMENT ADVICE, BUT FOR GENERAL INFORMATIONAL PURPOSES ONLY. TRADING STOCKS DOES INVOLVE RISK, SO CAUTION MUST ALWAYS BE UTILIZED. WE CANNOT GUARANTEE PROFITS OR FREEDOM FROM LOSS. YOU ASSUME THE ENTIRE COST AND RISK OF ANY TRADING YOU CHOOSE TO UNDERTAKE. YOU ALSO AGREE TO BEAR COMPLETE RESPONSIBILITY FOR YOUR INVESTMENT RESEARCH AND DECISIONS AND ACKNOWLEDGE THAT CAPTAINEWAVE.COM HAS NOT AND WILL NOT MAKE ANY SPECIFIC RECOMMENDATIONS OR GIVE ADVICE TO YOU OR ANY OF ITS CLIENTS UPON WHICH THEY SHOULD RELY. CAPTAINEWAVE.COM SUGGESTS THAT THE CLIENT/MEMBER TEST ALL INFORMATION AND TRADING METHODOLOGIES PROVIDED AT OUR SITE THROUGH PAPER TRADING OR SOME OTHER FORM OF TESTING. CAPTAINEWAVE.COM, ITS OWNERS, OR ITS REPRESENTATIVES ARE NOT REGISTERED AS SECURITIES BROKER-DEALERS OR INVESTMENT ADVISORS EITHER WITH THE U.S. SECURITIES AND EXCHANGE COMMISSION OR WITH ANY STATE SECURITIES REGULATORY AUTHORITY. WE RECOMMEND CONSULTING WITH A REGISTERED INVESTMENT ADVISOR, BROKER-DEALER, AND/OR FINANCIAL ADVISOR. IF YOU CHOOSE TO INVEST WITH OR WITHOUT SEEKING ADVICE FROM SUCH AN ADVISOR OR ENTITY, THEN ANY CONSEQUENCES RESULTING FROM YOUR INVESTMENTS ARE YOUR SOLE RESPONSIBILITY.
ALL INFORMATION POSTED IS BELIEVED TO COME FROM RELIABLE SOURCES. CAPTAINEWAVE.COM DOES NOT WARRANT THE ACCURACY, CORRECTNESS, OR COMPLETENESS OF INFORMATION AVAILABLE FROM ITS SERVICE AND THEREFORE WILL NOT BE LIABLE FOR ANY LOSS INCURRED. DUE TO THE ELECTRONIC NATURE OF THE INTERNET, THE CAPTAINEWAVE.COM WEBSITE, ITS E-MAIL & DISTRIBUTION SERVICES AND ANY OTHER SUCH "ALERTS" COULD FAIL AT ANY GIVEN TIME. CAPTAINEWAVE.COM WILL NOT BE RESPONSIBLE FOR UNAVAILABILITY OF USE OF ITS WEBSITE, NOR UNDELIVERED E-MAILS, OR "ALERTS" DUE TO INTERNET BANDWIDTH PROBLEMS, EQUIPMENT FAILURE, OR ACTS OF GOD. CAPTAINEWAVE.COM DOES NOT WARRANT THAT THE TRANSMISSION OF E-MAILS, OR ANY "ALERT" WILL BE UNINTERRUPTED OR ERROR-FREE. CAPTAINEWAVE.COM WILL NOT BE LIABLE FOR THE ACTS OR OMISSIONS OF ANY THIRD PARTY WITH REGARDS TO CAPTAINEWAVE.COM DELAY OR NON-DELIVERY OF THE CAPTAINEWAVE.COM NIGHTLY EMAILS OR "ALERTS". FURTHER, WE DO NOT RECEIVE ANY FORM OF PAYMENT OR OTHER COMPENSATION FOR PUBLISHING INFORMATION, NEWS, RESEARCH OR ANY OTHER MATERIAL CONCERNING ANY SECURITIES ON OUR SITE OR PUBLISH ANY INFORMATION ON OUR SITE THAT IS INTENDED TO AFFECT OR INFLUENCE THE VALUE OF SECURITIES.
THERE IS NO GUARANTEE PAST PERFORMANCE WILL BE INDICATIVE OF FUTURE RESULTS. NO ASSURANCE CAN BE GIVEN THAT THE RECOMMENDATIONS OF CAPTAINEWAVE.COM WILL BE PROFITABLE OR WILL NOT BE SUBJECT TO LOSSES. ALL CLIENTS SHOULD UNDERSTAND THAT THE RESULTS OF A PARTICULAR PERIOD WILL NOT NECESSARILY BE INDICATIVE OF RESULTS IN FUTURE PERIODS. THE RESULTS LISTED AT THIS WEBSITE ARE BASED ON HYPOTHETICAL TRADES. PLAINLY SPEAKING, THESE TRADES WERE NOT ACTUALLY EXECUTED. HYPOTHETICAL OR SIMULATED PERFORMANCE RESULTS HAVE CERTAIN INHERENT LIMITATIONS. UNLIKE AN ACTUAL PERFORMANCE RECORD, SIMULATED TRADES DO NOT REPRESENT ACTUAL TRADING. ALSO, SINCE THE TRADES HAVE NOT ACTUALLY BEEN EXECUTED, THE RESULTS MAY HAVE OVER OR UNDER COMPENSATED FOR THE IMPACT, IF ANY, OF CERTAIN MARKET FACTORS SUCH AS LACK OF LIQUIDITY. YOU MAY HAVE DONE BETTER OR WORSE THAN THE RESULTS PORTRAYED. NO REPRESENTATION IS BEING MADE THAT ANY ACCOUNT WILL OR IS LIKELY TO ACHIEVE PROFITS OR LOSSES SIMILAR TO THOSE SHOWN. NO INDEPENDENT PARTY HAS AUDITED THE HYPOTHETICAL PERFORMANCE CONTAINED AT THIS WEBSITE, NOR HAS ANY INDEPENDENT PARTY UNDERTAKEN TO CONFIRM THAT THEY REFLECT THE TRADING METHOD UNDER THE ASSUMPTIONS OR CONDITIONS SPECIFIED HEREAFTER. WHILE THE RESULTS PRESENTED AT THIS WEBSITE ARE BASED UPON CERTAIN ASSUMPTIONS BELIEVED TO REFLECT ACTUAL TRADING CONDITIONS, THESE ASSUMPTIONS MAY NOT INCLUDE ALL VARIABLES THAT WILL AFFECT, OR HAVE IN THE PAST AFFECTED, THE EXECUTION OF TRADES INDICATED BY CAPTAINEWAVE.COM. THE HYPOTHETICAL RESULTS ON THIS WEBSITE ARE BASED ON THE ASSUMPTION THAT THE CLIENT BUY AND SELLS THE POSITIONS AT THE OPEN PRICE OF THE STOCK. THE SIMULATION ASSUMES PURCHASE AND SALE PRICES BELIEVED TO BE ATTAINABLE. IN ACTUAL TRADING, PRICES RECEIVED MAY OR MAY NOT BE THE SAME AS THE ASSUMED ORDER PRICES.
More from Gold-Eagle


