Technical Analysis Of Major Markets


Gold
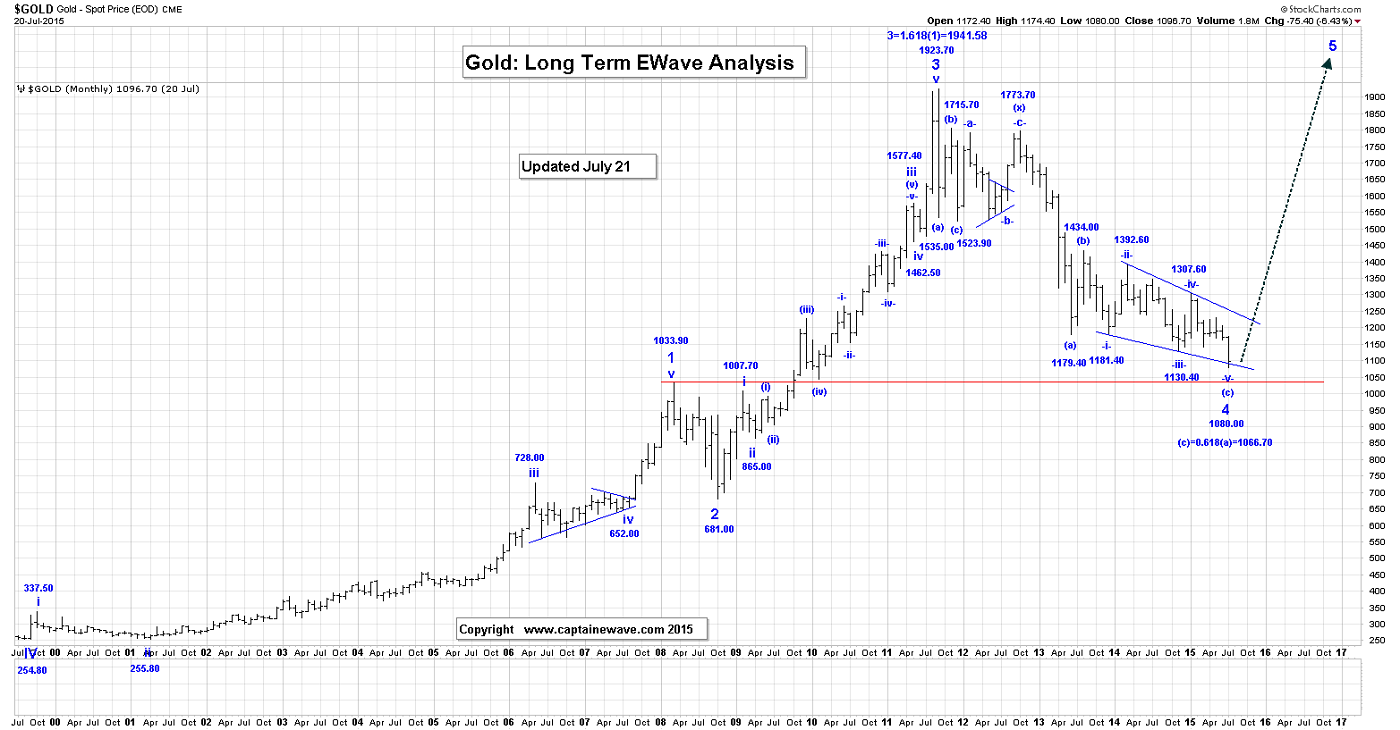
Gold reached a low of 1093.50, early in the overnight session and is now back above 1100, at the time that this Post is being written.
All elements are now in place for a completed second wave (c) of 4 diagonal triangle, and now we are waiting for our first impulsive sequence to give us some confidence that the 1080.00(continuous daily futures low), is indeed the major low we have been looking for.
A break above 1117.80, would be helpful to eliminate the possibility that this rally is a small bearish triangle.

Some other facts relative to gold include that the record high short position and now every newspaper and business TV show is taking about the end of gold, etc….
These events are typical at major market highs and lows. The same is being said about the stock market, but in the reverse, as buying is the only thing to (supposedly) do!
Until we see our impulsive wave sequence on the Intraday Chart we cannot rule the possibility that gold will try to drop back to 1080.00 low, one more time.
Watch for Intraday Posts during this week, as additional buying opportunities may present themselves!
We are long 5 COMEX GOLD positions, with 1100 puts and have 5 more long COMEX GOLD positions, with 1150 puts!
CRUDE OIL

Crude reached a new low of 50.09, in the overnight session. Nothing has changed relative to our comments towards this market, but we did mention yesterday that there is an option where wave ^iv^ ended at 53.81 and that we could be about to complete all of wave ^v^, *c* and our second wave .x., as wave ^v^ could be an ending diagonal triangle.
See the attached Daily Crude Chart for what we are talking about. That ending diagonal triangle would look like:
!i! = 51.27;
!ii! = 53.49;
!iii! = 50.14;
!iv! = 51.56;
!v! = 50.09, if complete, to complete wave ^v^, *c* and our second wave .x.
Our preferred count is that following:
!a! = 53.81;
!b! = 50.09, if complete;
!c! rally to go to at least the wave !a! high of 53.81, to complete all of wave ^iv^.
A break of the upper blue trend line, will be helpful for both options.
From our wave -iii- low of 44.20, our current wave -iv- rally looks like:
.a. = 51.20;
.b. = 43.58;
.c. = 54.24;
.x. = 42.11;
.a. = 52.48;
.b. = 47.05
.c. = 62.58
.x.:
*a* = 58.14
*b* triangle = 61.57;
*c* is still underway with a *c*=2.618*a* projection of 49.95.
We are long 5 positions, with 50.00 puts!
S&P500
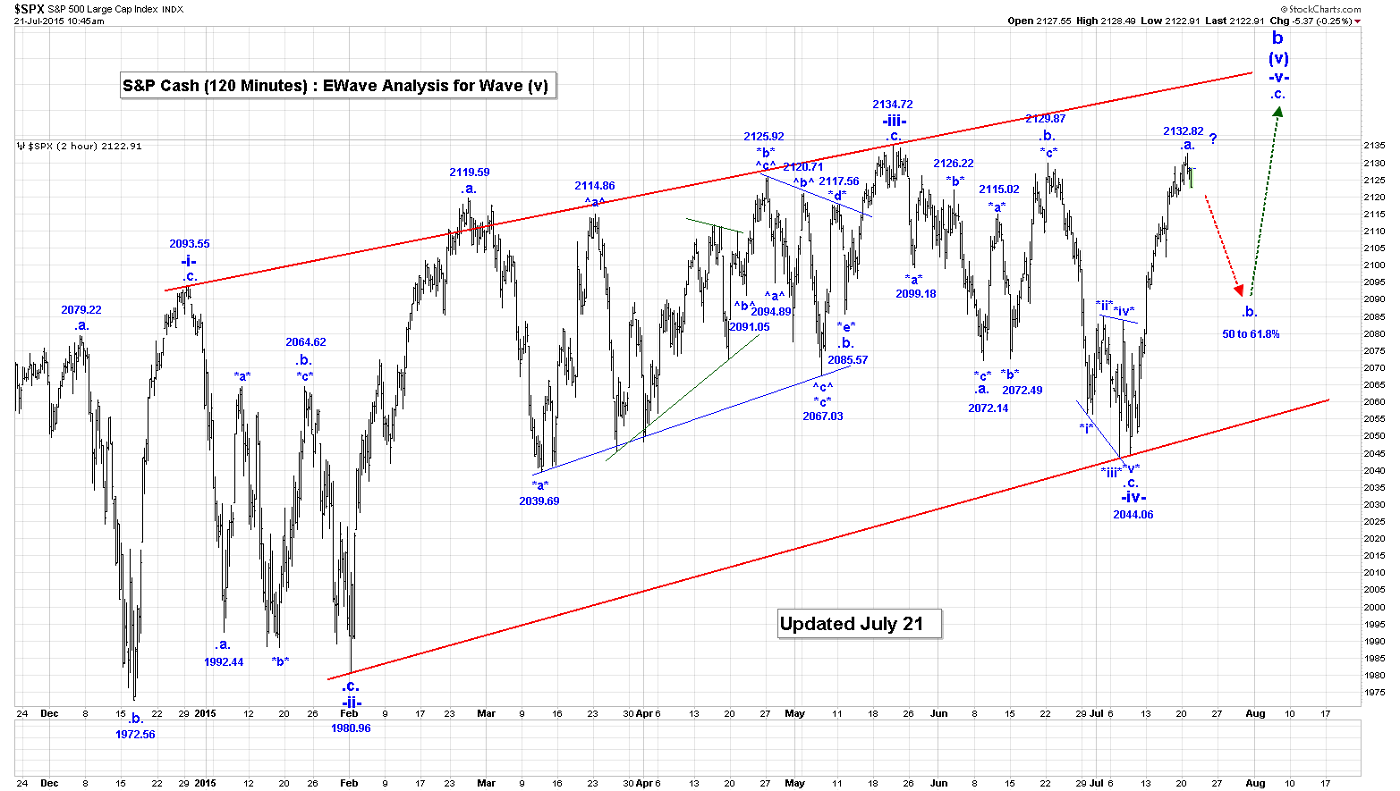
The S&P Futures were flat in the overnight session.
Wave .a. of -v- of our wave (v) diagonal triangle reached a new high today of 2132.82.
In spite of this marginal new high, the next big event is still going to be a drop in wave .b. which should retrace between 50 to 61.8% of the entire wave .a. rally.
We will provide those retracement levels when we are sure that wave .a. is complete. Wave .b. will consist of at least one 3 wave pattern.
USDX

The USDX spiked briefly to 98.30, at the opening of the overnight session and has since dropped to a low of 97.90, at the time that this Post was being written. No changes to our current thinking but:
A break above 98.30, would suggest that we may have to consider our bullish triangle option, and that wave -iv- ended at 95.55. Otherwise, we are still working on the assumption that wave *x* is about to come to an end, after which we should turn down in another *a*,*b*, *c* pattern, within wave -iv-.
*a* = 94.76;
*b* = 100.26;
*c* = 93.16;
*x*:
^a^ = 98.00;
^b^ = 93.30;
^c^ diagonal triangle:
!i! = 96.69;
!ii! = 94.84;
!iii! = 97.44;
!iv! = 95.55;
!v! = 98.30, if complete to complete all of wave *x*
The ^c^=^a^ projection is 98.14.
Our alternate remains that a wave -iv- triangle ended at 95.55 and that we are headed back to at least the 100.71 high.
We just shorted 5 positons in the USDX this morning, risking to 98.31!
NATGAS

On the Intraday Chart the drop from 2.9300 to 2.7855, looks like a double 3 wave pattern. If we are looking for a wave (c), even if it’s a diagonal triangle, then it cannot consist of a double 3 wave pattern, and be complete.
This could suggest that our second wave ^b^ did not end at 2.7855, and that it is becoming a triangle. Let’s see how this market trades in today’s day session!
If our second wave ^b^ is a developing triangle, then it would look like:
!a! = 2.8234;
!b! = 2.9300;
!c! = 2.7835;
!d! rally is now:
!e! drop to complete all of the wave ^b^ triangle.
Upon completion of wave ^b^ we should expect a rally in wave ^c^ to complete all of wave .c. of our wave -iv- triangle.;
Our current wave -iv- triangle count looks like:
.a.= 3.11;
.b. = 2.56;
.c.:
^a^ = 2.92;
^b^ = 2.44;
^c^= 2.96;
^x^ = 2.64;
^a^ = 2.93;
^b^ triangle is underway;
^c^ rally to at least the 2.96 high, to complete all of wave .c.
.d. and .e. to go to complete all of this wave -iv- triangle.
HUI/XAU/GDX

Almost all gold stocks are now priced for bankruptcy and if you believe that this sector is going to survive then many of these stocks need to be bought at these levels, or at least the XGD or GDX or even the GDXJ. Watch for more Intraday Posts this week, on what we are buying.
We are long the GDX and TSX:XGD, with no stops!!

We started buying Newmont and Barrick today. More buys on more gold stocks will follow this week. Look at the great H&S bottom taking shape that we have been following on Newmont.

Some kind of fundamental event is near that will create the giant C wave higher in gold stocks. Maybe it’s a war in the Mid-East. Maybe it’s a collapse of the US stock, bond, or real estate markets. We don’t know what the event will be, but all our ewave signs suggest that we are on the cusp of something big!
********
Special Offer For Ewave Riders! Send an Email to [email protected] and I’ll send you our special week-end report on key stocks, including Claude Resources!
Email: [email protected]
Website: www.captainewave.com
Risk: CAPTAINEWAVE.COM IS AN IMPERSONAL ADVISORY SERVICE. AND THEREFORE, NO CONSIDERATION CAN OR IS MADE TOWARD YOUR FINANCIAL CIRCUMSTANCES. ALL MATERIAL PRESENTED WITHIN CAPTAINEWAVE.COM IS NOT TO BE REGARDED AS INVESTMENT ADVICE, BUT FOR GENERAL INFORMATIONAL PURPOSES ONLY. TRADING STOCKS DOES INVOLVE RISK, SO CAUTION MUST ALWAYS BE UTILIZED. WE CANNOT GUARANTEE PROFITS OR FREEDOM FROM LOSS. YOU ASSUME THE ENTIRE COST AND RISK OF ANY TRADING YOU CHOOSE TO UNDERTAKE. YOU ALSO AGREE TO BEAR COMPLETE RESPONSIBILITY FOR YOUR INVESTMENT RESEARCH AND DECISIONS AND ACKNOWLEDGE THAT CAPTAINEWAVE.COM HAS NOT AND WILL NOT MAKE ANY SPECIFIC RECOMMENDATIONS OR GIVE ADVICE TO YOU OR ANY OF ITS CLIENTS UPON WHICH THEY SHOULD RELY. CAPTAINEWAVE.COM SUGGESTS THAT THE CLIENT/MEMBER TEST ALL INFORMATION AND TRADING METHODOLOGIES PROVIDED AT OUR SITE THROUGH PAPER TRADING OR SOME OTHER FORM OF TESTING. CAPTAINEWAVE.COM, ITS OWNERS, OR ITS REPRESENTATIVES ARE NOT REGISTERED AS SECURITIES BROKER-DEALERS OR INVESTMENT ADVISORS EITHER WITH THE U.S. SECURITIES AND EXCHANGE COMMISSION OR WITH ANY STATE SECURITIES REGULATORY AUTHORITY. WE RECOMMEND CONSULTING WITH A REGISTERED INVESTMENT ADVISOR, BROKER-DEALER, AND/OR FINANCIAL ADVISOR. IF YOU CHOOSE TO INVEST WITH OR WITHOUT SEEKING ADVICE FROM SUCH AN ADVISOR OR ENTITY, THEN ANY CONSEQUENCES RESULTING FROM YOUR INVESTMENTS ARE YOUR SOLE RESPONSIBILITY.
ALL INFORMATION POSTED IS BELIEVED TO COME FROM RELIABLE SOURCES. CAPTAINEWAVE.COM DOES NOT WARRANT THE ACCURACY, CORRECTNESS, OR COMPLETENESS OF INFORMATION AVAILABLE FROM ITS SERVICE AND THEREFORE WILL NOT BE LIABLE FOR ANY LOSS INCURRED. DUE TO THE ELECTRONIC NATURE OF THE INTERNET, THE CAPTAINEWAVE.COM WEBSITE, ITS E-MAIL & DISTRIBUTION SERVICES AND ANY OTHER SUCH "ALERTS" COULD FAIL AT ANY GIVEN TIME. CAPTAINEWAVE.COM WILL NOT BE RESPONSIBLE FOR UNAVAILABILITY OF USE OF ITS WEBSITE, NOR UNDELIVERED E-MAILS, OR "ALERTS" DUE TO INTERNET BANDWIDTH PROBLEMS, EQUIPMENT FAILURE, OR ACTS OF GOD. CAPTAINEWAVE.COM DOES NOT WARRANT THAT THE TRANSMISSION OF E-MAILS, OR ANY "ALERT" WILL BE UNINTERRUPTED OR ERROR-FREE. CAPTAINEWAVE.COM WILL NOT BE LIABLE FOR THE ACTS OR OMISSIONS OF ANY THIRD PARTY WITH REGARDS TO CAPTAINEWAVE.COM DELAY OR NON-DELIVERY OF THE CAPTAINEWAVE.COM NIGHTLY EMAILS OR "ALERTS". FURTHER, WE DO NOT RECEIVE ANY FORM OF PAYMENT OR OTHER COMPENSATION FOR PUBLISHING INFORMATION, NEWS, RESEARCH OR ANY OTHER MATERIAL CONCERNING ANY SECURITIES ON OUR SITE OR PUBLISH ANY INFORMATION ON OUR SITE THAT IS INTENDED TO AFFECT OR INFLUENCE THE VALUE OF SECURITIES.
THERE IS NO GUARANTEE PAST PERFORMANCE WILL BE INDICATIVE OF FUTURE RESULTS. NO ASSURANCE CAN BE GIVEN THAT THE RECOMMENDATIONS OF CAPTAINEWAVE.COM WILL BE PROFITABLE OR WILL NOT BE SUBJECT TO LOSSES. ALL CLIENTS SHOULD UNDERSTAND THAT THE RESULTS OF A PARTICULAR PERIOD WILL NOT NECESSARILY BE INDICATIVE OF RESULTS IN FUTURE PERIODS. THE RESULTS LISTED AT THIS WEBSITE ARE BASED ON HYPOTHETICAL TRADES. PLAINLY SPEAKING, THESE TRADES WERE NOT ACTUALLY EXECUTED. HYPOTHETICAL OR SIMULATED PERFORMANCE RESULTS HAVE CERTAIN INHERENT LIMITATIONS. UNLIKE AN ACTUAL PERFORMANCE RECORD, SIMULATED TRADES DO NOT REPRESENT ACTUAL TRADING. ALSO, SINCE THE TRADES HAVE NOT ACTUALLY BEEN EXECUTED, THE RESULTS MAY HAVE OVER OR UNDER COMPENSATED FOR THE IMPACT, IF ANY, OF CERTAIN MARKET FACTORS SUCH AS LACK OF LIQUIDITY. YOU MAY HAVE DONE BETTER OR WORSE THAN THE RESULTS PORTRAYED. NO REPRESENTATION IS BEING MADE THAT ANY ACCOUNT WILL OR IS LIKELY TO ACHIEVE PROFITS OR LOSSES SIMILAR TO THOSE SHOWN. NO INDEPENDENT PARTY HAS AUDITED THE HYPOTHETICAL PERFORMANCE CONTAINED AT THIS WEBSITE, NOR HAS ANY INDEPENDENT PARTY UNDERTAKEN TO CONFIRM THAT THEY REFLECT THE TRADING METHOD UNDER THE ASSUMPTIONS OR CONDITIONS SPECIFIED HEREAFTER. WHILE THE RESULTS PRESENTED AT THIS WEBSITE ARE BASED UPON CERTAIN ASSUMPTIONS BELIEVED TO REFLECT ACTUAL TRADING CONDITIONS, THESE ASSUMPTIONS MAY NOT INCLUDE ALL VARIABLES THAT WILL AFFECT, OR HAVE IN THE PAST AFFECTED, THE EXECUTION OF TRADES INDICATED BY CAPTAINEWAVE.COM. THE HYPOTHETICAL RESULTS ON THIS WEBSITE ARE BASED ON THE ASSUMPTION THAT THE CLIENT BUY AND SELLS THE POSITIONS AT THE OPEN PRICE OF THE STOCK. THE SIMULATION ASSUMES PURCHASE AND SALE PRICES BELIEVED TO BE ATTAINABLE. IN ACTUAL TRADING, PRICES RECEIVED MAY OR MAY NOT BE THE SAME AS THE ASSUMED ORDER PRICES.


