Technical Analysis Of Major Markets


Gold
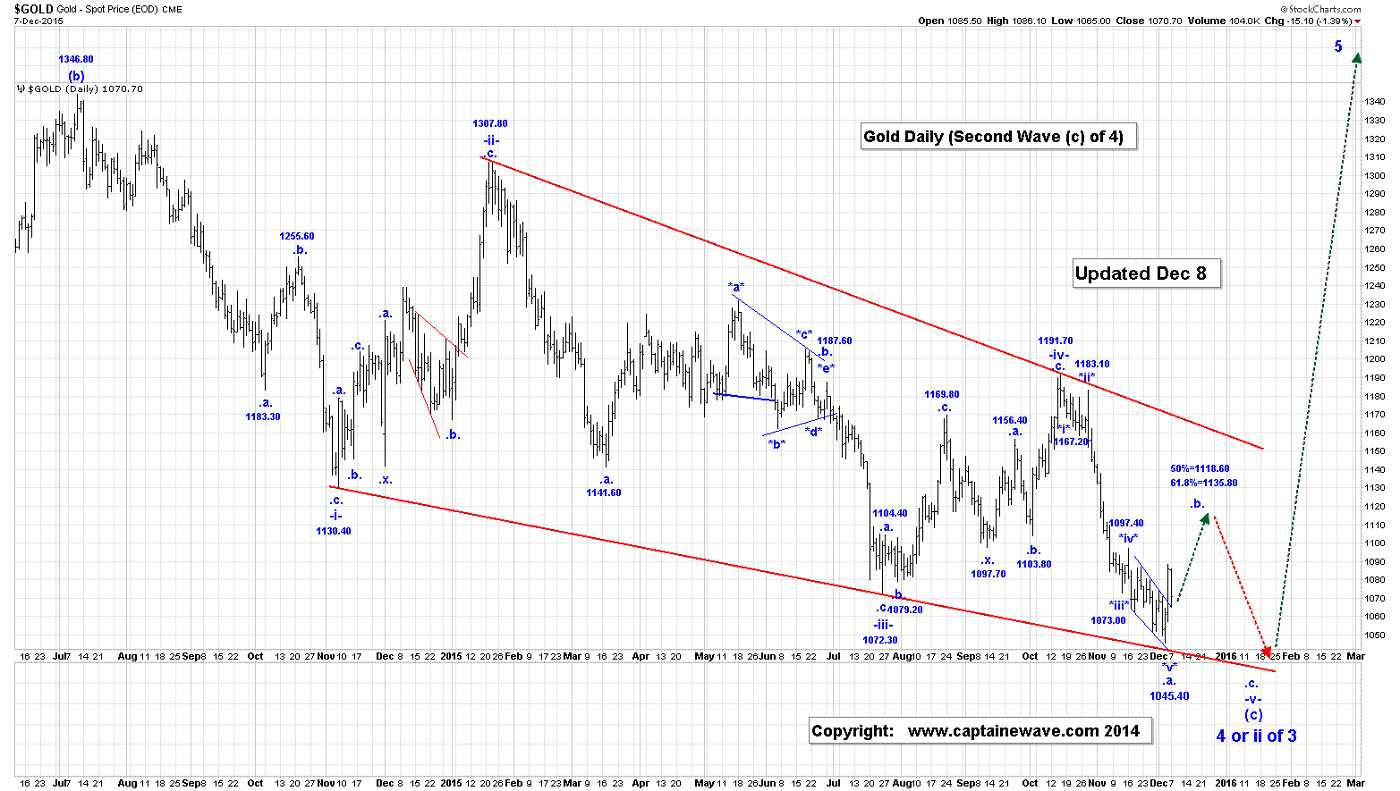
Gold reached a new low of 1065.80 in the overnight session, which is now a 50% retracement of the rally from 1045.40 to 1088.20.
We did mention in yesterday’s Posts, that we thought we still had an incomplete impulsive sequence from the 1045.40 low to the current 1088.20 high and that we needed one more rally above the 1088.20 high to complete that sequence. That could still be possible.
In either case, we are still working on elements of our wave .b. rally, and should find in the next day or so, which option gold is following in the short term, but we still see further upside in wave .b. in the coming week or so, as a minimum.
If the impulsive sequence from 1045.40 to 1088.20 is complete, then our retracement levels of this current correction are:
50% = 1066.80;
61.8% = 1061.60.
We are currently working on our wave .b. of -v- rally, and since it is a wave .b., this wave should consist of at least one 3 wave rally that will end within our 50 to 61.8% retracement zone, which is:
50% = 1118.60;
61.8% = 1135.80.
In the bigger picture our current Options remain unchanged as follows:
Option 1: Wave .a. of -v- is now complete at the 1045.40 low;
Option 2: Wave 4 or wave ii of 3 is complete at the 1045.40 low and gold is essentially “heading to the moon”. Our wave 4 Option will be eliminated we if we drop below 1033.00, which is the top of wave 1. Option 2 will only be confirmed as being correct if we break above the upper trend line connecting 1307.60 and 1191.70, as shown on the attached Daily Gold Chart.
This is our bigger ending diagonal triangle second wave (c).
Note that if the USDX is not in wave .iv., as our alternate suggests, then wave .b. may run a lot higher than we suggest, or Option 2 might be in play!
We are long 20 positions, with puts at 1085.00!
Crude:

Crude reached a new low of 36.81(at the time that this Post was being written), in the overnight session, but our idea that the drop from 50.91 to the current low is a wave ^c^ ending diagonal triangle remains unchanged, as we are now at the extreme of the formation.
Although we are not sure how this dip below the 37.75 low fits into the bigger picture, we are still expecting a very large rally in crude to take place, likely starting from the current lows.
This rally should still take us at least to the 50.91 high, but likely much higher as it looks like from the 37.75 low we now have a corrective looking rally as follows:
*a* = 49.33:
*b*:
^a^ = 43.21;
^b^ = 50.91;
^c^ ending diagonal triangle = 36.81, if complete, to complete all of wave *b*;
*c* rally is next.
Our first projections for the end of wave *c* are:
*c* =1.618*a* = 55.55, assuming that wave *b* ended at 36.81. We will likely be adding to our long positions in the next 24 hours.
If oil players want to trade this market, to the long side, they can put a buy stop at 41.00, but they would need to risk to 36.80, or buy a put at a price of your choosing.
We are long 15 positions, with 42.00 puts, as stops!
S&P500

The S&P Futures were lower in the overnight session, being down about 19 points at the time that this Post was being written. Our current Options remain valid and that will not change uncles the low at 2042.35 is challenged.
As you can see on the attached 120 Min Chart, we have added a little more definition to our wave -iv- triangle Option.
If the triangle Option is correct, then we are rallying in wave .c. of -iv-. A rally above the wave -iii- high of 2116.48, now, would eliminate our wave -iv- triangle option.
Also, if the wave -iv- triangle Option is correct, then our lower ending diagonal trend line would connect with the end of wave -ii- and wherever wave -iv- ends.”

Longer term, our wave counts continue to suggest a horrific US stock market meltdown lies ahead. Maybe the catalyst will be a terrorist event of size in America, or something else, but it’s going to be something very big, and very horrible. Anyone playing this market on the long side needs to have some put options as major disaster insurance!
USDX

We shorted the USDX on Wednesday twice. We were stopped out by a few ticks on the first tranche, but scored Babe Ruth style with the second, as the dollar crashed bigtime with the Draghi “less than expected” QE news that blasted the euro higher. We booked immediate and juicy profits.
Now, on the Intraday Chart we appear to have a completed 3 drop in place from 98.90 to the overnight low of 98.43. This suggests that the USDX is going to head back to at least the 98.90 high. Our preferred Option suggests that we are correcting now in wave .iv. with the following internal wave structure:
*a* = 97.59, if complete;
*b* rally is next. wave *b* is expect to rally between 50 to 61.8% of the entire wave *a* drop. These values are 99.09 and 99.44, respectively;
*c* down to complete all of wave .iv.
The current high for this wave *b* corrective rally is 98.90, which is still below of 50% retracement level of 99.09, so we should expect some further gains, before wave *b* ends.
In the bigger picture our retracement target zone for end of wave .iv. is:
23.6% = 98.99;
38.2% = 98.00.
Our current count for all of wave -v- is:
.i. = 96.64;
.ii. = 93.83;
.iii. = 100.58;
.iv. drop is now;
.v. rally to go to at least the 100.71, wave -iii- high.”
We will short 5 new positions at 99.25, risking to 100.59!
NatGas
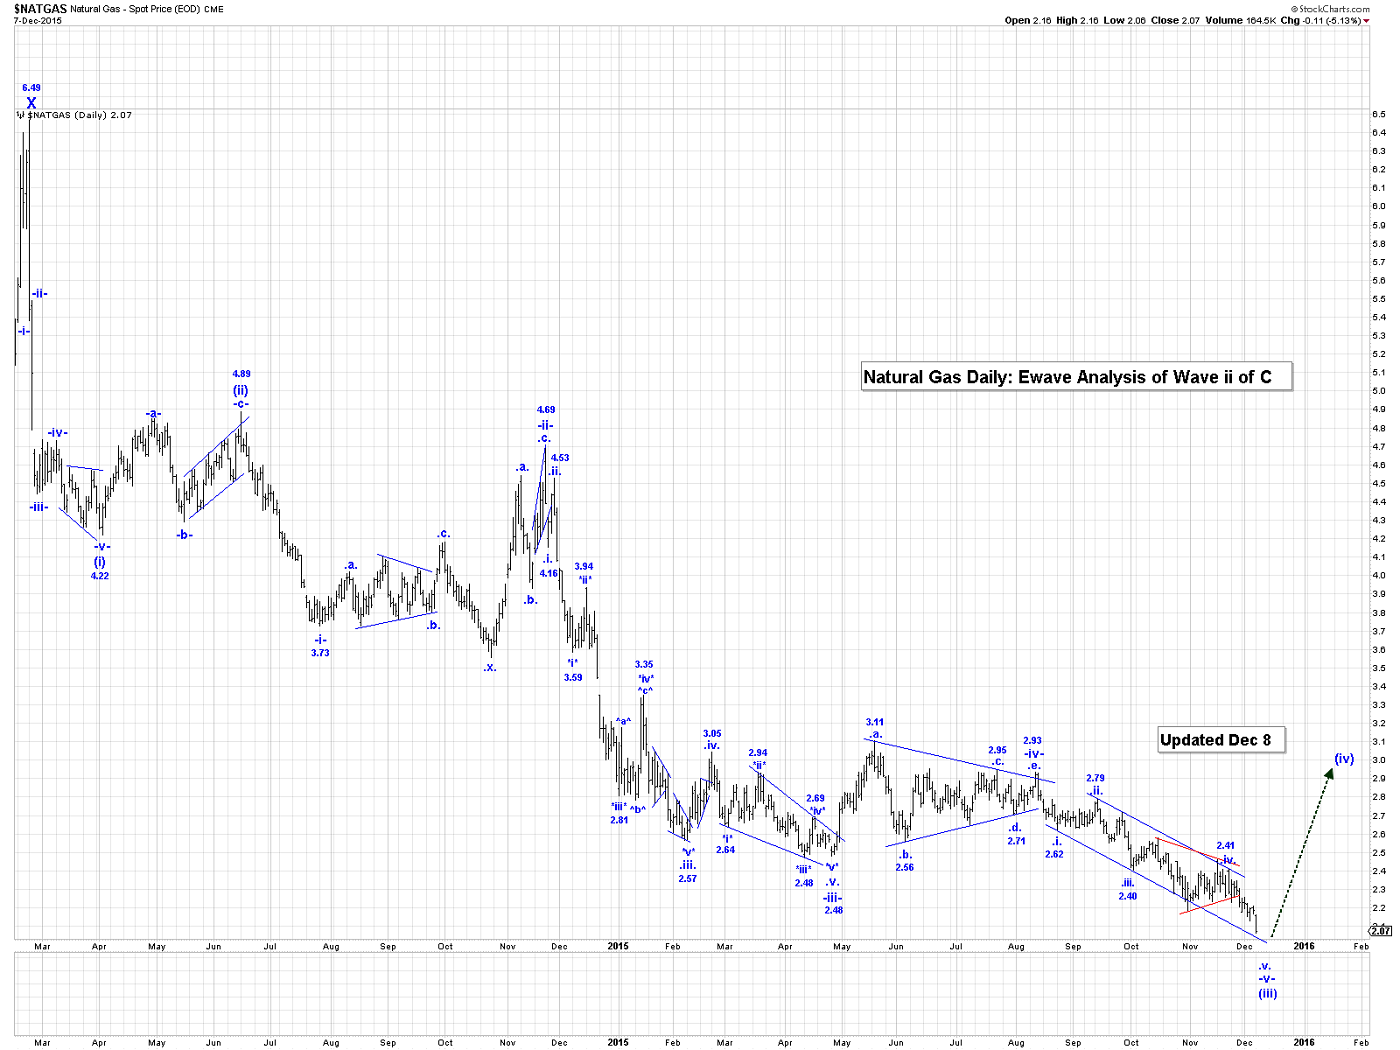
NG continued lower in wave .v. of -v- of (iii), in the overnight session reaching 2.014, at the time that this Post was being written.
We are getting close to your minimum target of 1.95, and also to the end of wave (iii). Upon completion of wave (iii), we expect wave (iv) is expected to rally between 23.6 and 38.2% of the entire wave (iii) drop.
HUI/GDX

Since our wave .b. in gold likely has more upside, we still expect the GDX to move higher with the gold market, but not above the 17.04, before we drop to a new low below 12.62, when gold falls in its wave .c..
That break would complete all of wave B.
On the Intraday Chart we do NOT see an impulsive wave structure from the 12.92 low to the 14.86 high, which support our view of another eventual drop back to 12.92, but more likely to 12.62.

As noted below, we have been aggressive buyers of gold stocks, with no stops. While we see gold stocks generally making one more new low, it will only be a marginal one basis our wave counts, and stocks like Kinross may already have seen their final lows. The price action of key gold stocks in the face of lower bullion must be respected.
We are long the GDX, ABX, KGC, NEM, CRJ, and TSX:XGD with no stops!
********
Email: [email protected]
Website: www.captainewave.com
Risk: CAPTAINEWAVE.COM IS AN IMPERSONAL ADVISORY SERVICE. AND THEREFORE, NO CONSIDERATION CAN OR IS MADE TOWARD YOUR FINANCIAL CIRCUMSTANCES. ALL MATERIAL PRESENTED WITHIN CAPTAINEWAVE.COM IS NOT TO BE REGARDED AS INVESTMENT ADVICE, BUT FOR GENERAL INFORMATIONAL PURPOSES ONLY. TRADING STOCKS DOES INVOLVE RISK, SO CAUTION MUST ALWAYS BE UTILIZED. WE CANNOT GUARANTEE PROFITS OR FREEDOM FROM LOSS. YOU ASSUME THE ENTIRE COST AND RISK OF ANY TRADING YOU CHOOSE TO UNDERTAKE. YOU ALSO AGREE TO BEAR COMPLETE RESPONSIBILITY FOR YOUR INVESTMENT RESEARCH AND DECISIONS AND ACKNOWLEDGE THAT CAPTAINEWAVE.COM HAS NOT AND WILL NOT MAKE ANY SPECIFIC RECOMMENDATIONS OR GIVE ADVICE TO YOU OR ANY OF ITS CLIENTS UPON WHICH THEY SHOULD RELY. CAPTAINEWAVE.COM SUGGESTS THAT THE CLIENT/MEMBER TEST ALL INFORMATION AND TRADING METHODOLOGIES PROVIDED AT OUR SITE THROUGH PAPER TRADING OR SOME OTHER FORM OF TESTING. CAPTAINEWAVE.COM, ITS OWNERS, OR ITS REPRESENTATIVES ARE NOT REGISTERED AS SECURITIES BROKER-DEALERS OR INVESTMENT ADVISORS EITHER WITH THE U.S. SECURITIES AND EXCHANGE COMMISSION OR WITH ANY STATE SECURITIES REGULATORY AUTHORITY. WE RECOMMEND CONSULTING WITH A REGISTERED INVESTMENT ADVISOR, BROKER-DEALER, AND/OR FINANCIAL ADVISOR. IF YOU CHOOSE TO INVEST WITH OR WITHOUT SEEKING ADVICE FROM SUCH AN ADVISOR OR ENTITY, THEN ANY CONSEQUENCES RESULTING FROM YOUR INVESTMENTS ARE YOUR SOLE RESPONSIBILITY.
ALL INFORMATION POSTED IS BELIEVED TO COME FROM RELIABLE SOURCES. CAPTAINEWAVE.COM DOES NOT WARRANT THE ACCURACY, CORRECTNESS, OR COMPLETENESS OF INFORMATION AVAILABLE FROM ITS SERVICE AND THEREFORE WILL NOT BE LIABLE FOR ANY LOSS INCURRED. DUE TO THE ELECTRONIC NATURE OF THE INTERNET, THE CAPTAINEWAVE.COM WEBSITE, ITS E-MAIL & DISTRIBUTION SERVICES AND ANY OTHER SUCH "ALERTS" COULD FAIL AT ANY GIVEN TIME. CAPTAINEWAVE.COM WILL NOT BE RESPONSIBLE FOR UNAVAILABILITY OF USE OF ITS WEBSITE, NOR UNDELIVERED E-MAILS, OR "ALERTS" DUE TO INTERNET BANDWIDTH PROBLEMS, EQUIPMENT FAILURE, OR ACTS OF GOD. CAPTAINEWAVE.COM DOES NOT WARRANT THAT THE TRANSMISSION OF E-MAILS, OR ANY "ALERT" WILL BE UNINTERRUPTED OR ERROR-FREE. CAPTAINEWAVE.COM WILL NOT BE LIABLE FOR THE ACTS OR OMISSIONS OF ANY THIRD PARTY WITH REGARDS TO CAPTAINEWAVE.COM DELAY OR NON-DELIVERY OF THE CAPTAINEWAVE.COM NIGHTLY EMAILS OR "ALERTS". FURTHER, WE DO NOT RECEIVE ANY FORM OF PAYMENT OR OTHER COMPENSATION FOR PUBLISHING INFORMATION, NEWS, RESEARCH OR ANY OTHER MATERIAL CONCERNING ANY SECURITIES ON OUR SITE OR PUBLISH ANY INFORMATION ON OUR SITE THAT IS INTENDED TO AFFECT OR INFLUENCE THE VALUE OF SECURITIES.
THERE IS NO GUARANTEE PAST PERFORMANCE WILL BE INDICATIVE OF FUTURE RESULTS. NO ASSURANCE CAN BE GIVEN THAT THE RECOMMENDATIONS OF CAPTAINEWAVE.COM WILL BE PROFITABLE OR WILL NOT BE SUBJECT TO LOSSES. ALL CLIENTS SHOULD UNDERSTAND THAT THE RESULTS OF A PARTICULAR PERIOD WILL NOT NECESSARILY BE INDICATIVE OF RESULTS IN FUTURE PERIODS. THE RESULTS LISTED AT THIS WEBSITE ARE BASED ON HYPOTHETICAL TRADES. PLAINLY SPEAKING, THESE TRADES WERE NOT ACTUALLY EXECUTED. HYPOTHETICAL OR SIMULATED PERFORMANCE RESULTS HAVE CERTAIN INHERENT LIMITATIONS. UNLIKE AN ACTUAL PERFORMANCE RECORD, SIMULATED TRADES DO NOT REPRESENT ACTUAL TRADING. ALSO, SINCE THE TRADES HAVE NOT ACTUALLY BEEN EXECUTED, THE RESULTS MAY HAVE OVER OR UNDER COMPENSATED FOR THE IMPACT, IF ANY, OF CERTAIN MARKET FACTORS SUCH AS LACK OF LIQUIDITY. YOU MAY HAVE DONE BETTER OR WORSE THAN THE RESULTS PORTRAYED. NO REPRESENTATION IS BEING MADE THAT ANY ACCOUNT WILL OR IS LIKELY TO ACHIEVE PROFITS OR LOSSES SIMILAR TO THOSE SHOWN. NO INDEPENDENT PARTY HAS AUDITED THE HYPOTHETICAL PERFORMANCE CONTAINED AT THIS WEBSITE, NOR HAS ANY INDEPENDENT PARTY UNDERTAKEN TO CONFIRM THAT THEY REFLECT THE TRADING METHOD UNDER THE ASSUMPTIONS OR CONDITIONS SPECIFIED HEREAFTER. WHILE THE RESULTS PRESENTED AT THIS WEBSITE ARE BASED UPON CERTAIN ASSUMPTIONS BELIEVED TO REFLECT ACTUAL TRADING CONDITIONS, THESE ASSUMPTIONS MAY NOT INCLUDE ALL VARIABLES THAT WILL AFFECT, OR HAVE IN THE PAST AFFECTED, THE EXECUTION OF TRADES INDICATED BY CAPTAINEWAVE.COM. THE HYPOTHETICAL RESULTS ON THIS WEBSITE ARE BASED ON THE ASSUMPTION THAT THE CLIENT BUY AND SELLS THE POSITIONS AT THE OPEN PRICE OF THE STOCK. THE SIMULATION ASSUMES PURCHASE AND SALE PRICES BELIEVED TO BE ATTAINABLE. IN ACTUAL TRADING, PRICES RECEIVED MAY OR MAY NOT BE THE SAME AS THE ASSUMED ORDER PRICES.
More from Gold-Eagle


