Technical Analysis Of The Major Markets


SPX: Long-term trend - Bull Market
SPX: Intermediate trend – has retraced 50% of its uptrend from 1872.
Analysis of the short-term trend is done on a daily basis with the help of hourly charts. It is an important adjunct to the analysis of daily and weekly charts which discuss longer market trends.
ARE WE IN A BEAR MARKET?
Market Overview
This is the question that all analysts are asking after last week’s performance! My own interpretation is that we are not – yet! Friday’s decline (which could come to an end next week) only needs a few more points on the downside to have retraced 50% of the move from 1872. In spite of all the scary price decline, this can only be labeled (so far) as a normal correction of the last uptrend. The market will tip its hand on the next rally from this level. If it fails to develop some real strength and turns down decisively before surpassing 2070, the odds will increase that a bear market has started. The confirmation will come when we break below the low that we are in the process of making.
I have maintained ever since the initial decline in August that, based on the amount of distribution that was made before and after we reached the 2135 peak, that this would most likely be the high point of the bull market. Our inability to get through that resistance band on the last rally, and the current weakness have enhanced this probability, but it has not yet confirmed it. However, somewhat of a confirmation has occurred since the 2116 top was made. The amount of distribution which has taken place since that top on the 3X P&F chart, confirms exactly the amount of distribution which took place in the second phase of the top distribution pattern. (The first phase projected a move down to 1863. The August low occurred at 1868 – close enough!) If we can trust the projection indicated by the second phase of distribution, the current downtrend move should not stop at a 50% retracement, but go much lower, thereby confirming that we are in a bear market. (The first and second phases of distribution are clearly marked on the daily chart, below.)
Even if we are not yet in a bear market and we start another uptrend from here, we are in the last phase of the bull market which will come to an end when this phase is completed whether or not we make a new high in the SPX.
Intermediate Indicators Survey
Both the weekly MACD and SRSI turned down last week. The SRSI gave a decisive sell signal while the slower MACD is just starting to make a bearish cross in its MAs.
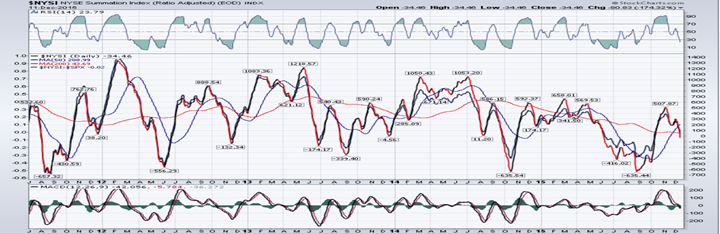
The Summation index (courtesy of StockCharts.com) ended the week at “0”. It has also retraced about 50% of its move from the 1872 low (which showed positive divergence to the 1868 low). We could say that there was negative divergence when it made its second peak from the high, but it needs to continue declining to become really negative. Its RSI is just barely entering an oversold reading and would have to turn up immediately to give a positive reading relative to the SPX. However, it is unlikely that either it or the NYSI itself will be able to bottom at their present level. The McClellan Oscillator has too much downward momentum to turn positive right away, and this should ensure that both the NYSI and its RSI should continue to decline.

The 3X P&F chart has a short-term projection of a few points lower. However, the degree of distribution which occurred after the 2116 top almost ensures that if the decline does stop here, this is only a phase count, and not the entire count, which is potentially much lower.
Chart Analysis
Daily SPX Chart
The entire move from 1868 to 2116 can be contained in a large channel outlined in purple trend lines. There is an alternate green channel which rises at a lesser angle. These green trend lines are always at a fixed angle, with parallels drawn from tops and bottoms which serve as support or resistance. So far, last week’s decline has stopped right on the purple bottom channel line which is an area of support, although it is expected to go a little lower, but perhaps not far enough to challenge the green bottom channel line.
Within these channels, from 1868 the SPX had a 3-phase uptrend which ended when it back-tested the bottom (blue) channel line of the intermediate channel from 11/2011. From there, it created a 3-phase downtrend which will most likely end next week. Although I have used a-b-c labels to identify the moves, these should not be construed as labels pertaining to EWT. They are simply used to clarify chart patterns. After next week, a new uptrend of undetermined nature could start. If it is simply a short corrective move, followed by another decline which surpasses the current low, we will have confirmation that we are in a bear market with much lower prices ahead. This is already suggested by the distribution phases shown on the chart but, as reliable as these patterns tend to be, they will have to be confirmed by future stock market action.
Based on a current projection, I am only expecting a little more on the downside at this time, but the oscillator patterns shown below are still in a downtrend and do not reflect any positive divergence to the price action. We must wait for them to tell us that a low is in place. Incidentally, we could get a preview of the next uptrend by observing the performance of the A/D oscillator. Notice its action at the August low. After bottoming, it went straight up into positive territory, indicating that there was a strong demand for stocks after that decline. It would probably require similar action to suggest that we are starting another strong uptrend.

Hourly SPX Chart
The pattern which is illustrated by the hourly chart is one of corrective nature. This would not change even if the decline continues a little lower below the bottom channel lines of the purple and red channel (which would not be uncommon). On a daily basis, there has been no sign of deceleration in the entire trend from the “b” top, with Friday representing the biggest daily point loss. But on the hourly chart, Friday’s action did show some deceleration toward the end of the day, as we approach the target for this move. This deceleration will have to be reflected in the daily indicators next week if we are to make a low in this area.
This deceleration is more clearly reflected in the oscillators which are beginning to turn. This is a warning that a low may be near. However, because the daily indicators are still not showing deceleration, it may take several days to hammer out a small base before we can start the next uptrend. On the P&F chart, the index looks as if it has completed two-thirds of an ending diagonal.

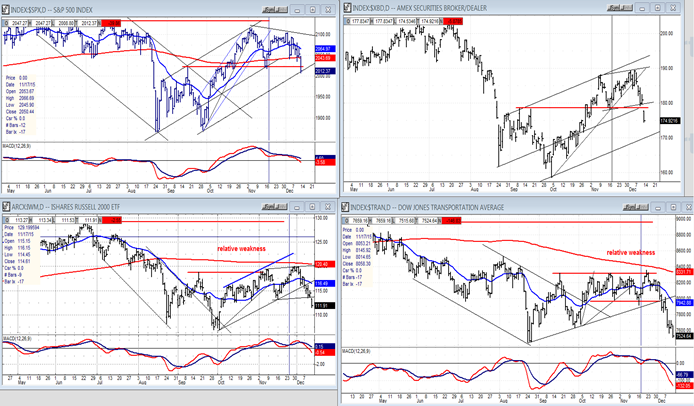
XBD (American Securities Broker/Dealer) and other leaders
XBD and IWM did not act all that differently from SPX over the past two or three weeks, but they retain their longer-term relative weakness to that index. This started when they made a new low in October, and it is not a positive sign for the market going forward.
In the last letter, I mentioned that the action of the TRAN over the past few days was giving me concern because it was losing ground and had been leading the market on the downside ever since the top. Last week, it broke below its October low, which may be warning us not to expect a strong new uptrend to develop after the current low is in place.
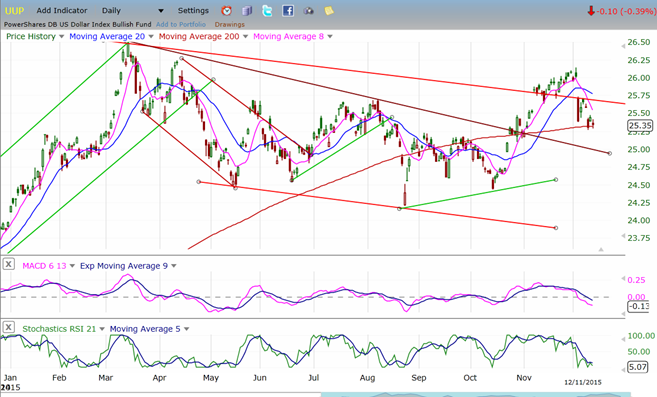
UUP (Dollar ETF)
UUP has continued its correction down to its 200-DMA where it could find support and resume its uptrend if it’s going to make a fifth wave from its August low. With a potential for higher prices according to its P&F chart, this is likely to be only a short-term correction.
GLD (Gold Trust)
For an index whose price just made a cycle low, GLD’s action does not look very bullish, especially during the coincident pull-back of UUP. I suspect that its recent low only completed wave 3 and that this is wave 4, which would mean that another low is in store for GLD before it can start a sustained uptrend. 97/98 looks like a good target for the final correction move before the beginning of a sustainable uptrend.

USO (United States Oil Fund)
USO is well on its way to reaching its next target which is now only three points lower. Structurally, it looks like it is currently in a subdividing third wave, so a reasonable amount of time will be needed to complete its wave pattern and reach its projection.

Summary
At this point, the possibility that the bull market is over is just that: a possibility! But the market should not keep us guessing too long about whether or not this becomes a fact. Many credible economic and geopolitical arguments can be made for it, but we’ll confine ourselves to the technical crystal ball. Let’s give the SPX a few more weeks to reveal its intentions.
********
FREE TRIAL SUBSCRIPTON
Market Turning Points is an uncommonly dependable, reasonably priced service providing intra-day market updates, a daily Market Summary, and detailed weekend reports. It is ideally suited to traders, but it can also be valuable to investors since highly accurate longer-term price projections are provided using Point & Figure analysis and Fibonacci projections. Best-time reversal estimates are obtained from cycle analysis.
For a FREE 4-week trial, send an email to: [email protected]
For further subscription options, payment plans, weekly newsletters, and for general information, I encourage you to visit my website at www.marketurningpoints.com. By clicking on "Free Newsletter" you can get a preview of the latest newsletter which is normally posted on Sunday afternoon (unless it happens to be a 3-day weekend in which case it could be posted on Monday).
The above comments and those made in the daily updates and the Market Summary about the financial markets are based purely on what I consider to be sound technical analysis principles. They represent my own opinion and are not meant to be construed as trading or investment advice, but are offered as an analytical point f view which might be of interest to those who follow stock market cycles and technical analysis.

When Andre Gratian was a stock broker years ago, a friend introduced him to technical analysis of the market. Consequently, it is not an exaggeration to say that Andre fell in love with this approach! Ever since then, it has become an increasingly important part of his professional life. Gratian has studied the works of Wyckoff, Edwards & Magee, Edward J. Dewey (cycles) and many others. However, one of my most profitable undertaking has probably been to study Point & Figure charting, which he finds invaluable in analyzing stocks and indices. If he were restricted to one methodology, this is the one that he would choose. This well-rounded background has given him what he feels to be a special insight into the stock market, facilitating the recognition of meaningful patterns and the ‘turning points’ in all trends, whether they be short or long term. Andre feels very comfortable discussing the stock market and passing on meaningful information to others. His subscribers include individuals and money managers throughout the world. Moreover, his Newsletters are currently published on several financial sites, here and abroad.


