Technical Analysis Of The Markets


Current Position of the Market
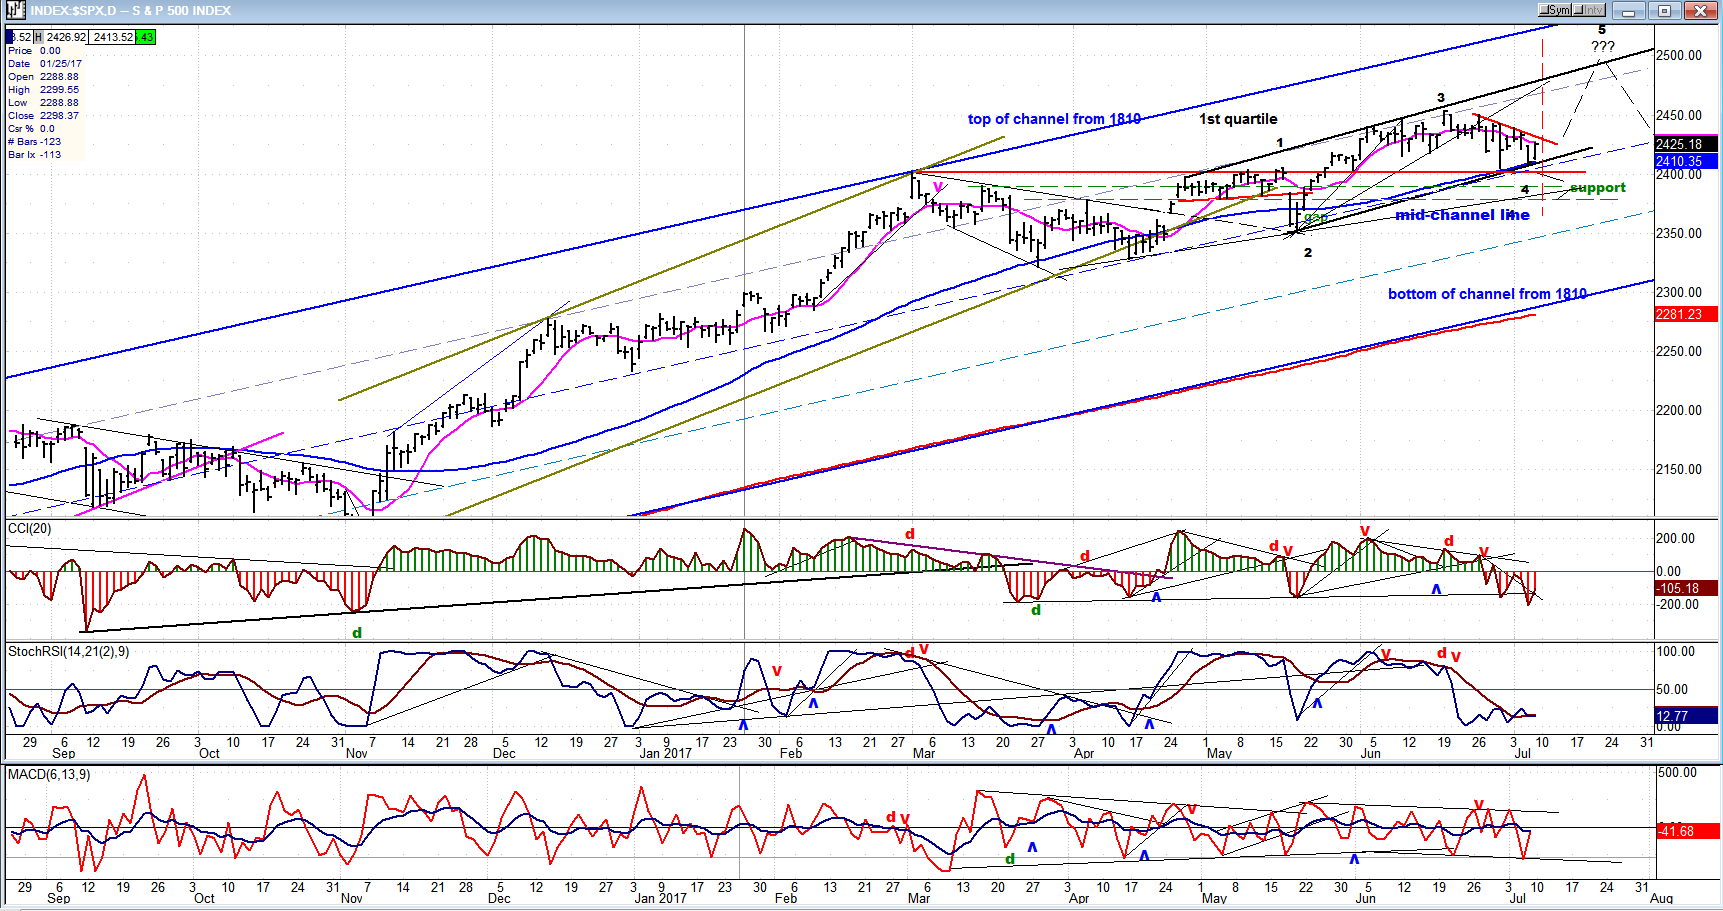
SPX Long-term trend: Uptrend continues with a serious loss of upside momentum in weekly indicators.
SPX Intermediate-trend: An ending diagonal appears to be in its last stage of completion.
Analysis of the short-term trend is done on a daily-basis with the help of hourly charts. It is an important adjunct to the analysis of daily and weekly charts which discuss longer market trends.
Still Bullish Bias
Market Overview
SPX still points a little higher. This is based on the P&F projection which calls for a move to about 2500 although, admittedly, it could fall short of its target; the structure, which appears to be forming an ending diagonal needing one more wave; and Friday’s apparently successful retest of an important support level just below the 2411 pivot point. That is the second time in a week that the .382 retracement of the move from 2322 to the 2353 top has held. Even more convincing, on Friday, the DOW transportation index closed at an all-time high!
Granted, we do not have a confirmed short-term reversal that puts us back into an uptrend, yet. This will have to come next week with a move above the short-term downtrend line from the second top of 2450 providing initial confirmation. If that can be accomplished over the next couple of days, it should attract buyers and be reflected in very positive A/Ds.
A move below 2400, especially if it continues beyond 2380, would strongly suggest that 2453 was the final top of this rally and that an intermediate correction has already started.
Analysis: (These Charts and subsequent ones courtesy of QCharts.com)
Daily Chart
Occasionally, I find it useful to draw price channels starting with the top trend line connecting tops, with the bottom one as a parallel across the lowest low of the trend. In this case, it gives me a mid-channel line which has provided coninued price support since the January low. A break of that support line would be a strong indication that a reversal of the trend has occurred.
He red horizontal line on the chart is very close to the 2411 pivot which provides additional support to the former tops, starting with the original 2400 level which was the top of the rally from 2084 before some consolidation took place. Also, since the correction from 2400, which ended at 2322, another uptrend started at what is believed to be an ending diagonal, as labeled on the chart. The sequence of higher highs and higher lows from 2322 clearly indicates that we are still in an uptrend until that pattern is reversed. If there is one more short wave to about 2500, it should conclude the ending diagonal which, as its name suggests, would put an end to the uptrend starting at 2084. A normal pull-back would be to 2312 (.382 retracement) or 2268 (50%). After the final top has occurred, we can check our P&F chart to see if the count of the distribution phase matches one of these Fibonacci retracement levels. Strangely enough, they almost always do!
The oscillators are in the oversold area which normally coincides with previous lows (as you can see on the chart) since mid-march -- another reason to suspect that we are at the beginning of a new short-term uptrend. (To be confirmed, of course!)
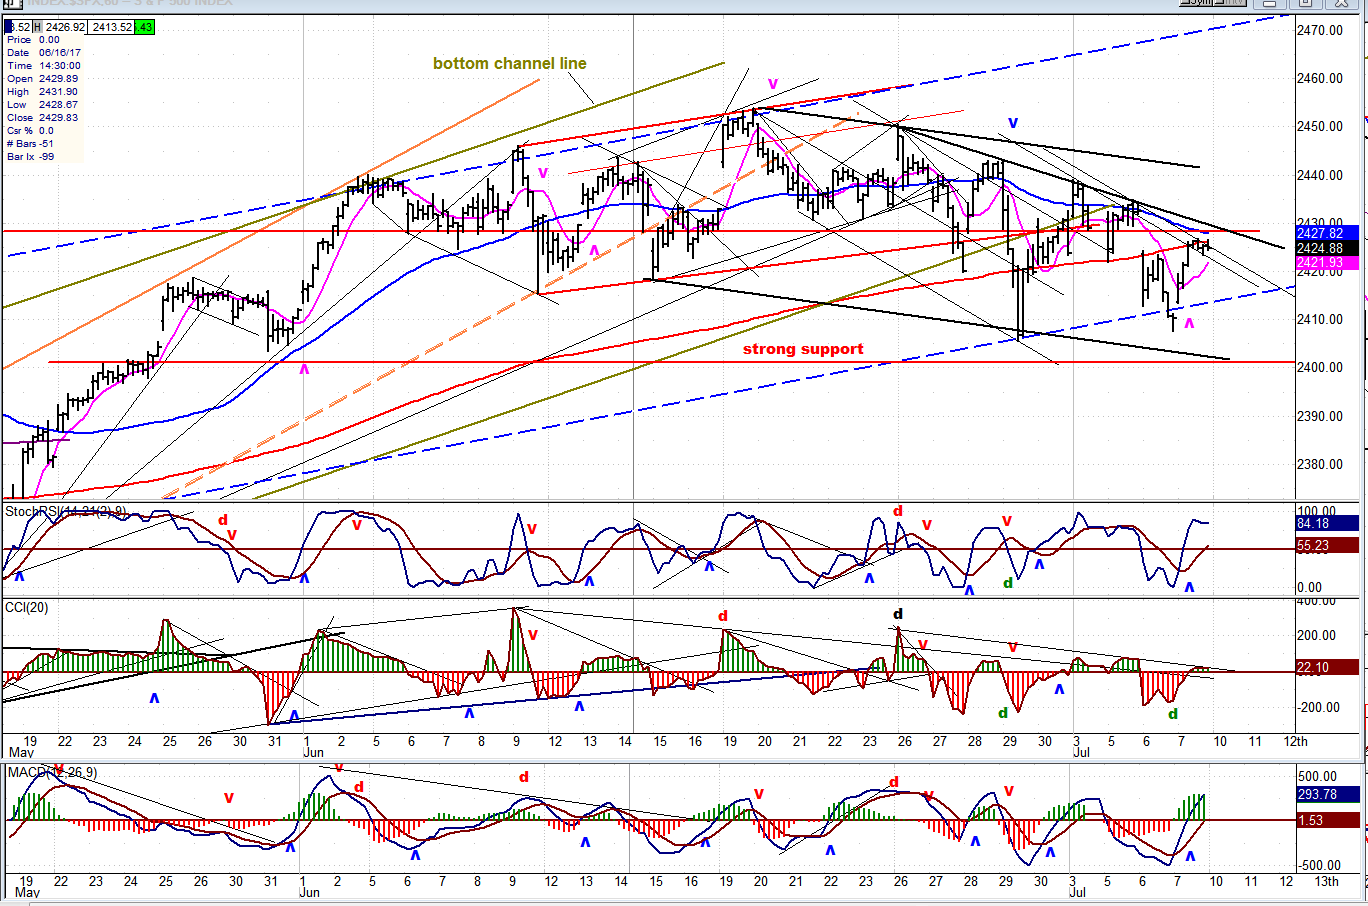
Hourly Chart
Looking at the market action under a microscope, it is clear that something changed on Friday. Instead of continuing lower, the last small downtrend found support where it should have, creating a higher low, and rallying strongly to overcome the first minor resistance level of 2423. That was the first foray into overhead resistance which stopped the advance; but the index gave back very little and it has the support of strong break-outs in the SRSI and the A/D oscillators. CCI mimicked price by stopping at a downtrend line which will have to be overcome, as will the price downtrend line, for a completed buy signal to occur.
This would be accomplished if the index tacked on another five points, as it would put it above the first downtrend line and into a position to challenge the next resistance point at 2435. If that happens -- especially if there is follow-through on Monday -- it would open the path for a rally to a new high, thereby fulfilling both price projection and structure.
An Overview Of Some Important Indexes (Daily Charts)
There is no real weakness showing in any of the charts below. Instead, we had what was the weakest index becoming the strongest on a near-term basis. The TRAN (bottom left) had been a laggard until some buying started on 6/26 and pushed it to an all-time high by Friday’s close. It is also clear that the DJIA (top center) is still strong. It made a new high a week ago and, with Friday’s positive action, it looks as if it is preparing to make a newer one.

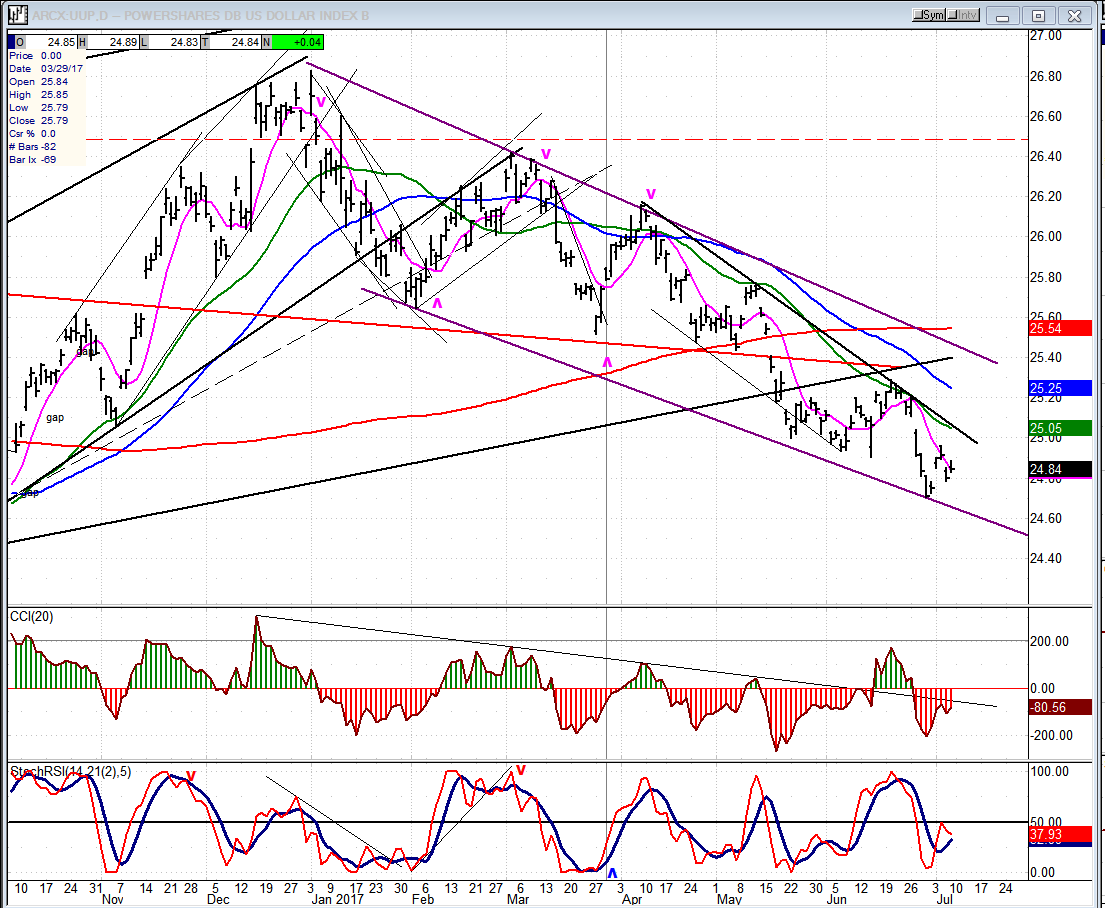
UUP (Dollar ETF)
UUP may be ready to reverse. Price and oscillator action both look as if they are turning positive and, by dropping from 26.83 to 24.71, it may have been enough to satisfy the 24.50 P&F projection.
GDX (Gold Miners ETF)
GDX should continue to consolidate until it reverses after the intermediate cycle makes its low. This could be at any time during the coming week. One negative result of the price action is that what could have been a short-term base turned out to be distribution instead, and GDX may have to continue its correction to satisfy the projection requirement. Another aspect of this is that the price action has created overhead resistance starting at 22.50, and this could limit the extent of the recovery after the cycle has bottomed.

Note: GDX is now updated for subscribers throughout the day, along with SPX.
USO (US Oil Fund)
The price of oil may be ready to stabilize, at least temporarily, and this could enable USO to rally to the top of its corrective channel.

Summary
There is some evidence – which will need to be confirmed next week – that SPX is getting ready to start the final wave of its terminal pattern. Consequently, this could take it to about 2500 before we can start the long-awaited intermediate correction.
********
For a FREE 4-week trial, send an email to [email protected], or go tand click on “subscribe”. There, you will also find subscription options, payment plans, weekly newsletters, and general information. By clicking on "Free Newsletter" you can get a preview of the latest newsletter which is normally posted on Sunday afternoon (unless it happens to be a 3-day weekend, in which case it could be posted on Monday).
The above comments and those made in the daily updates and the Market Summary about the financial markets are based purely on what I consider to be sound technical analysis principles. They represent my own opinion and are not meant to be construed as trading or investment advice, but are offered as an analytical point of view which might be of interest to those who follow stock market cycles and technical analysis.

When Andre Gratian was a stock broker years ago, a friend introduced him to technical analysis of the market. Consequently, it is not an exaggeration to say that Andre fell in love with this approach! Ever since then, it has become an increasingly important part of his professional life. Gratian has studied the works of Wyckoff, Edwards & Magee, Edward J. Dewey (cycles) and many others. However, one of my most profitable undertaking has probably been to study Point & Figure charting, which he finds invaluable in analyzing stocks and indices. If he were restricted to one methodology, this is the one that he would choose. This well-rounded background has given him what he feels to be a special insight into the stock market, facilitating the recognition of meaningful patterns and the ‘turning points’ in all trends, whether they be short or long term. Andre feels very comfortable discussing the stock market and passing on meaningful information to others. His subscribers include individuals and money managers throughout the world. Moreover, his Newsletters are currently published on several financial sites, here and abroad.


