Technical Analysis Of The Markets


Current Position of the Market
SPX Long-term trend: Uptrend continues with a serious loss of upside momentum in weekly indicators.
SPX Intermediate trend: An ending diagonal appears to be in its last stage of completion .
Analysis of the short-term trend is done on a daily-basis with the help of hourly charts. It is an important adjunct to the analysis of daily and weekly charts which discuss longer market trends.
More To Go!
Market Overview
SPX has met the expectations outlined in the last letter, and more bullish action is expected since last week’s action has all the markings of an impulse wave which appears to be on target to reach our 2500 projection. I say “appears”, because in these late stages, traders may not wait till the last minute to take profits, and this may shorten the full extent of the projection.
With the current structure subdividing, we could go a little higher before the index settles into a minor consolidation. The first wave of the diagonal lasted about a month and the second a few days more. If the current one takes that long to complete, it will put us about two weeks away from the 20-wk cycle low which is due around August 15, and result in a very sharp and extended decline into that date.
As we move forward, we should be able to become more and more specific about the final high of the rally in terms of both time and price.
Analysis: (These Charts and subsequent ones courtesy of QCharts.com)
Daily Chart
Wave 4 of the diagonal found support just above the 2400 level. You can see why on the chart! It’s a strong support level resulting from the top of the previous uptrend at 2400, and that of the first wave of the ending diagonal. We could have retraced to 2380 without endangering the curren structure, but the fact that we remained above 2400 is a sign of strength and this is why it is not unrealistic to think that SPX has a reasonable chance to reach its fulll objective of 2500.
Another sign of strength comes from the gap opening last Wednesday. This was atributed to Janet Yellen’s remarks during her report to congress, and showed that traders still expected additional price appreciation. The index did stall on Thursday in the face of severe overhead resistance, but it blasted through it to a new all-time high on Friday. Over the last few days, SPX had some help from a good rally in the tech stocks, although they remain under their former highs. But since the DJIA and NYA also made new all-time highs, it’s obvious that there is still plenty of strength in the overall market. Of course, if my analysis is correct, we might feel differently a couple of months from now!
Besides the fact that the market appears to be structurally ripe for a significant correction, we should be aware of the fact that history tells us that the seventh year of the decennial pattern is prone to market weakness. We are halfway through 2017 and the market is still making new highs. It’s very posssible that during the last two weeks of the 20-wk cycle the trigger will be pulled for a decline of some 200 points that could last until October, or even a little later -- especially since a 40-month cycle (ca) is conveniently due to bottom around that time.
You might think that it does not make sense for the market to make an all-time high so close to the bottom of a 40-month cycle, but in 1987 (also a year ending in 7) it made its top only nine weeks before its October (take notice) low, causing SPX to lose a third of its value -- most of it in the final three weeks! Now, that’s what you’d call a black swan event!
If realized, our expected decline of about 200 points would pale by comparison, but it could still smart if you are not prepared.

Hourly Chart
The mid-channel line (dashed blue) was tested three times and held before the index finally broke out of its red downtrend line and corrective channel, which led to a strong push to a new high. The break-out gap occurred when the Fed chair released her report on Wednesday morning, and the index has not looked back since.
It has, however, become short-term overbought with some negative divergence appearing in the oscillators, and price has reached the top of a large, flat channel which may do more than cause the small reversal which occurred on Friday. However, the trend has reached the top of the blue channel which outlines wave 3 of the 5th wave without showing deceleration. This suggests that more headway could be made before we have a reversal which puts an end to this wave and creates a corrective channel which takes the index outside of the blue channel for wave 4, prior to the final push into the target area.
Only until after that final wave 5 of the 5th wave of the ending diagonal, can we expect to see the beginning of a sharp decline into the 20-wk cycle which, in turn, should trigger a larger decline into October. Any deviation from this ideal scenario will be addressed if and when it occurs.
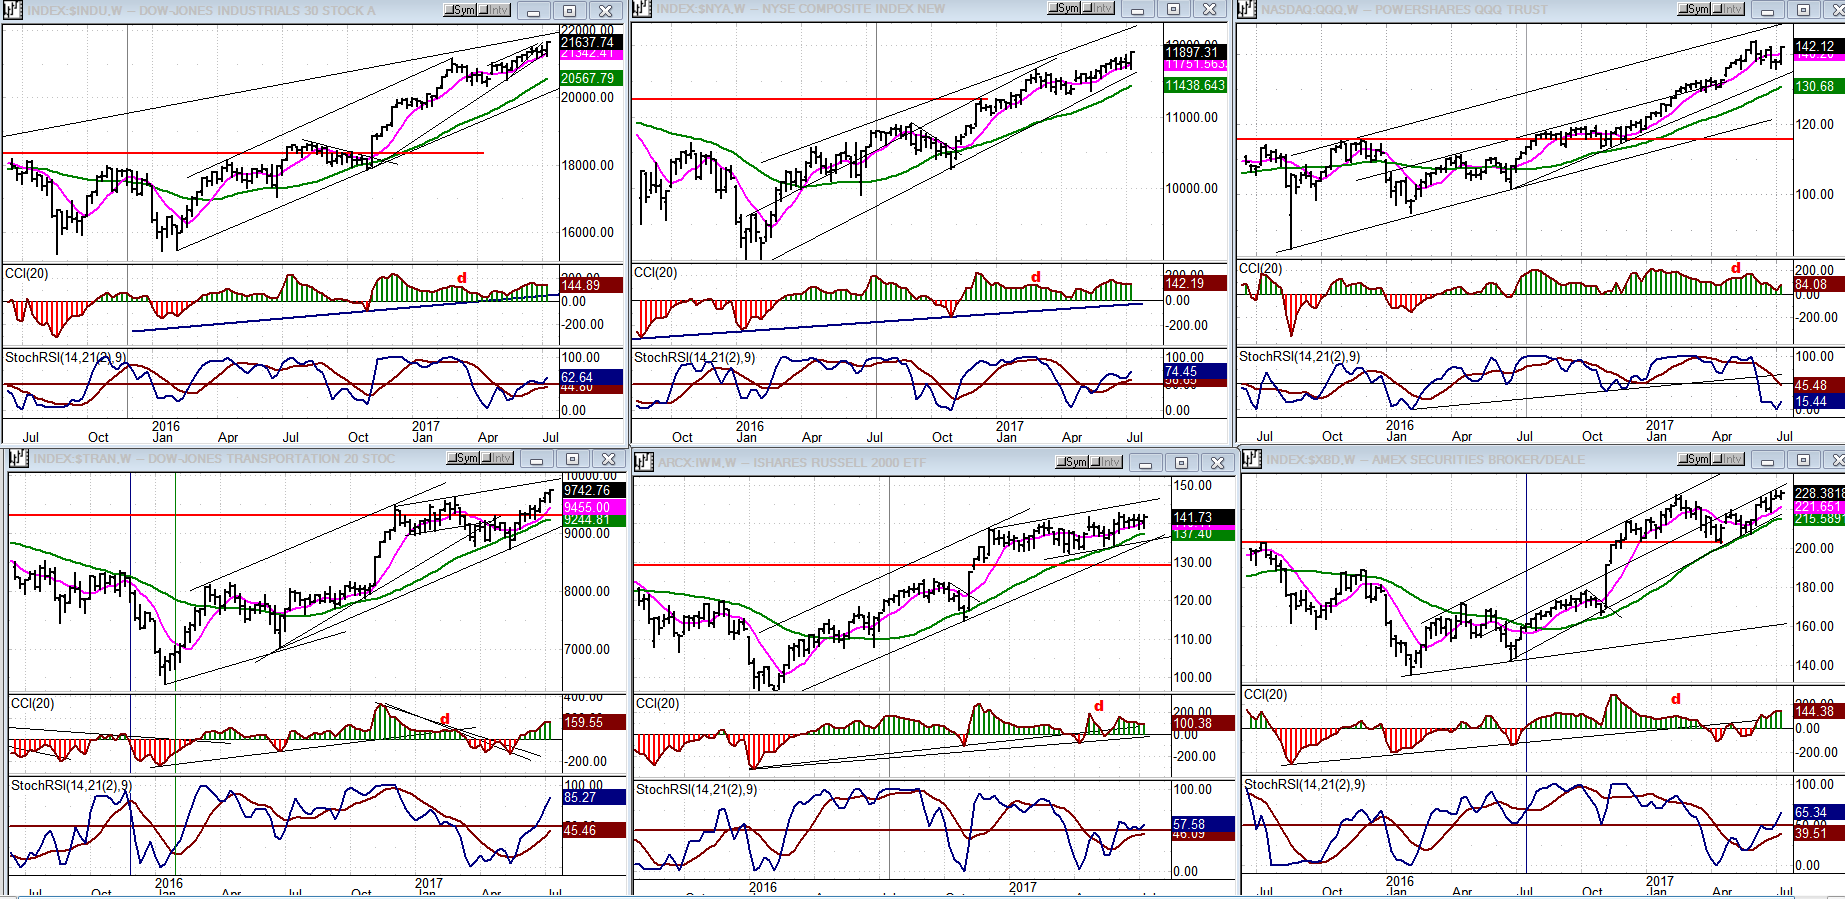
An Overview Of Some Important Indexes (Daily Charts)
There is no need for an in-depth analysis this week, since it would not add to our perspective on the market. Let’s just note that three indexes made new highs last week: NYA, DJIA and TRAN. The other three did not (IWM, QQQ and XBD).
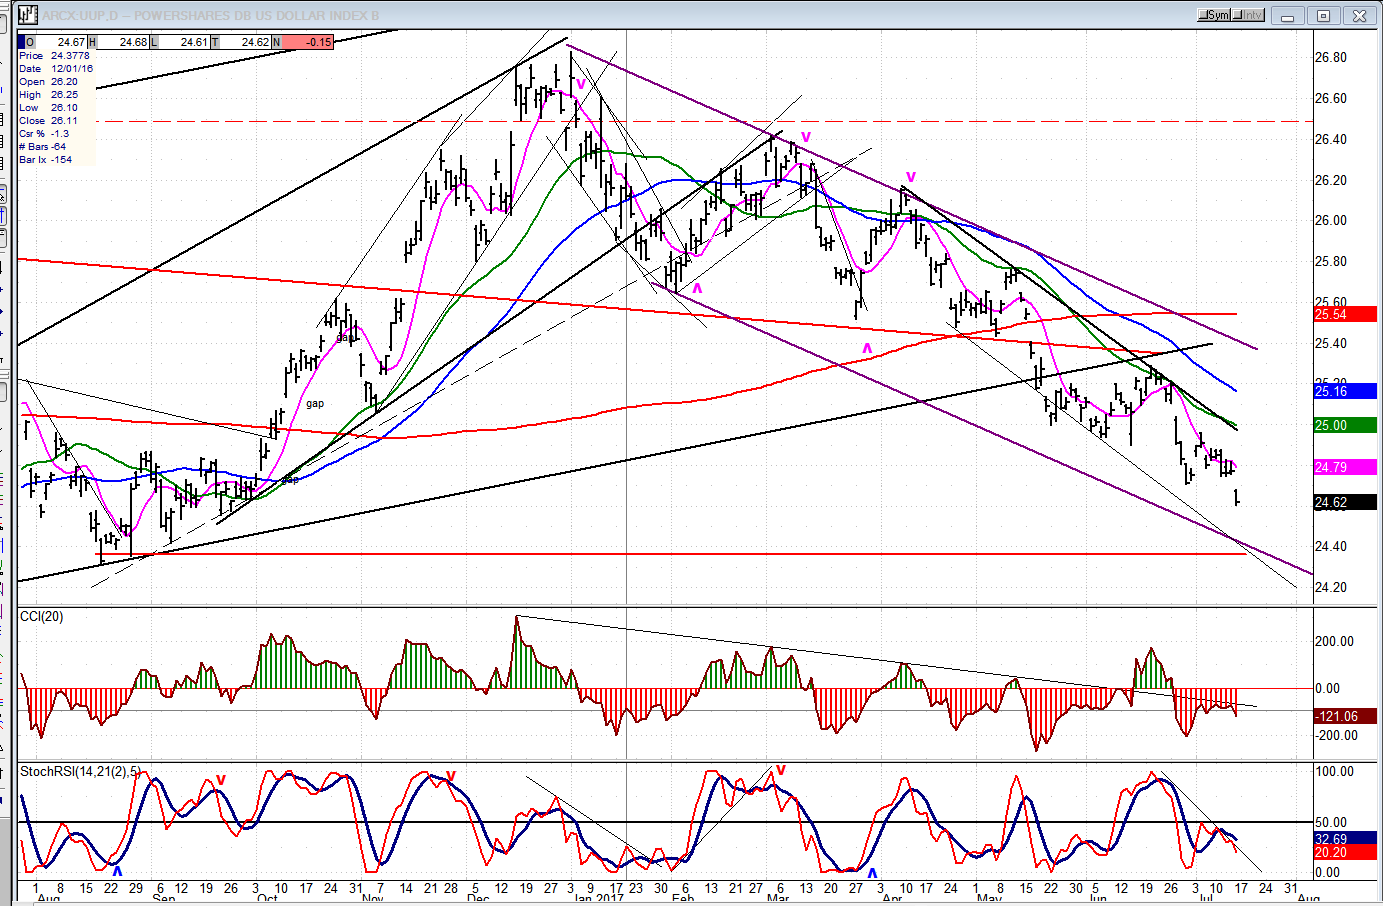
UUP (Dollar ETF)
The dollar has not found the low of its correction yet, which makes the 24.50 P&F target for UUP looking more and more likely to be filled. Only 12 cents to go!
GDX (Gold Miners ETF)
GDX has not responded well to the low of its weekly cycle. Larger cycles are obviously in charge. It is
worth noting that the rally of January 2016 may not have been impulsive, especially since it retraced slightly less than .382 of the former, substantial decline. This could mean that the intermediate correction from the high may not be complete.
For the near-term, the current decline may not be complete either and GDX could return to about 20 before it is ready for a reversal.
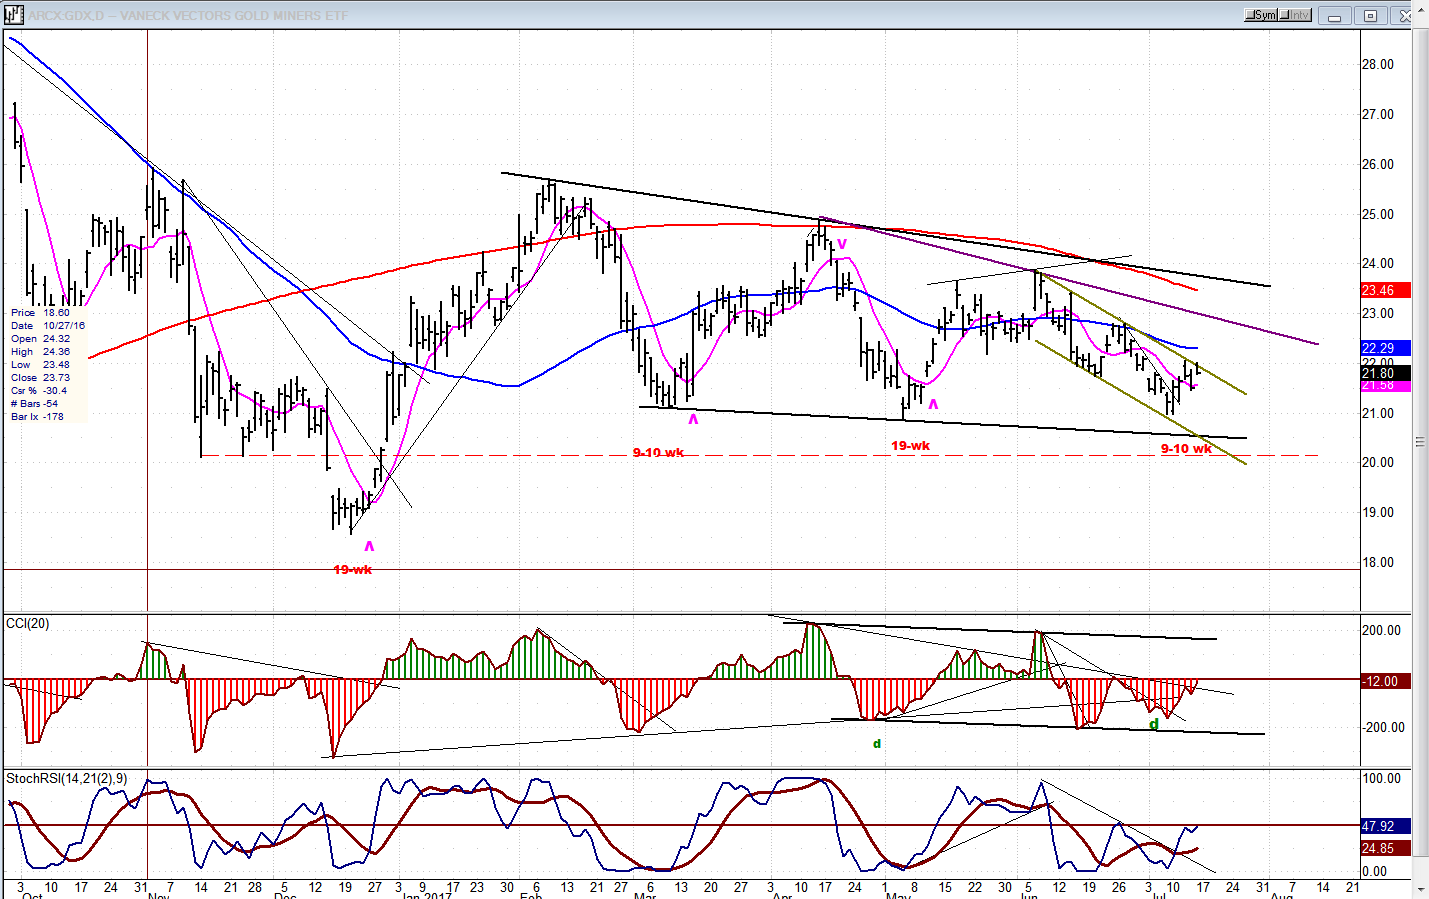
Note: GDX is now updated for subscribers throughout the day, along with SPX.
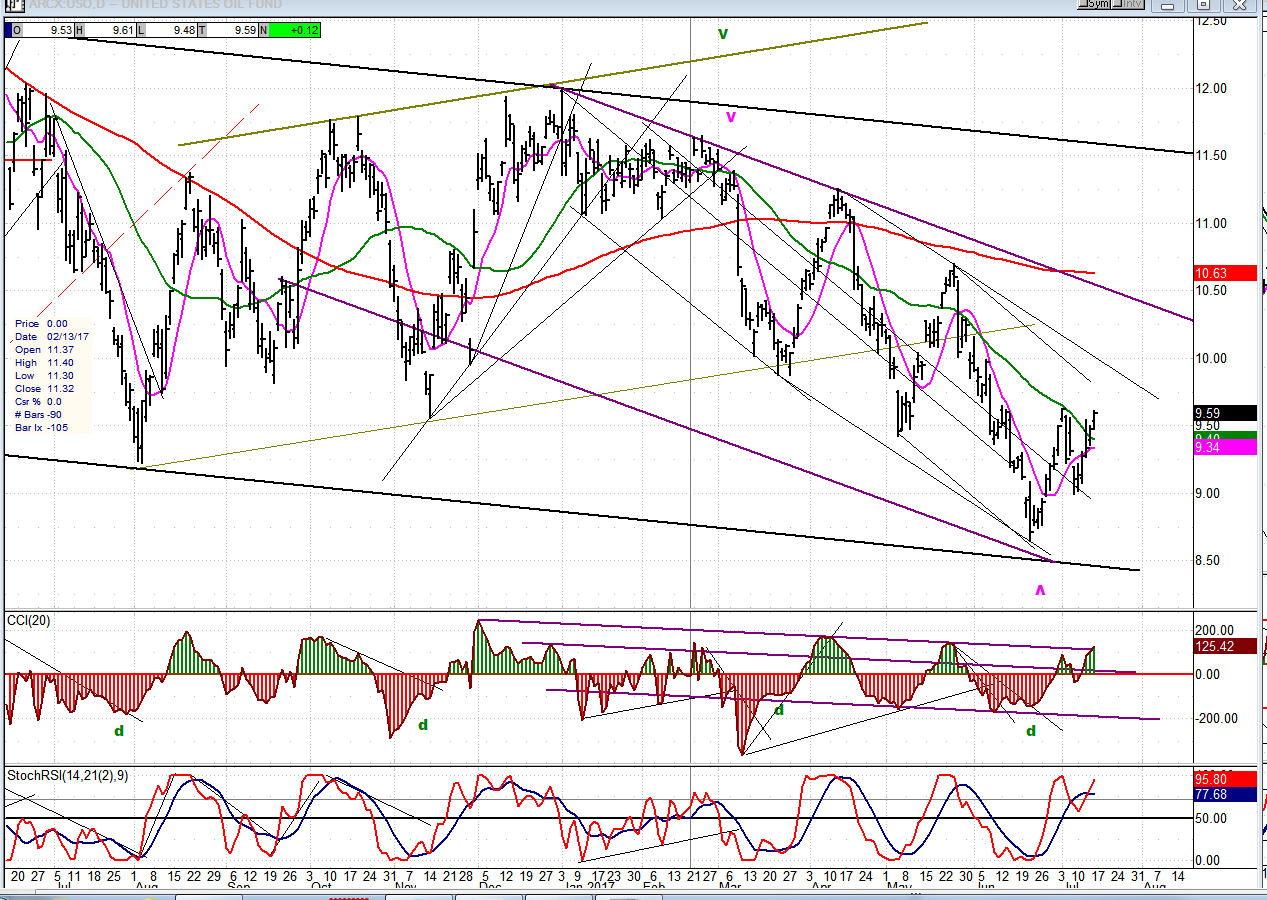
USO (United States Oil Fund)
USO is looking just a little better technically and could extend its current bounce to the first downtrend line.
Summary
“There is some evidence – which will need to be confirmed next week – that SPX is getting ready to start the final wave of its terminal pattern, and that this could take it to about 2500 before we can start the long-awaited intermediate correction.”
It’s fair to say that we did get that confirmation last week with the index making a new all-time high. For now, prospects to reach our final projection of 2500 appear reasonable, but a consolidation is due near-term.
********
For a FREE 4-week trial, send an email to [email protected], or go tand click on “subscribe”. There, you will also find subscription options, payment plans, weekly newsletters, and general information. By clicking on "Free Newsletter" you can get a preview of the latest newsletter which is normally posted on Sunday afternoon (unless it happens to be a 3-day weekend, in which case it could be posted on Monday).
The above comments and those made in the daily updates and the Market Summary about the financial markets are based purely on what I consider to be sound technical analysis principles. They represent my own opinion and are not meant to be construed as trading or investment advice, but are offered as an analytical point of view which might be of interest to those who follow stock market cycles and technical analysis.

When Andre Gratian was a stock broker years ago, a friend introduced him to technical analysis of the market. Consequently, it is not an exaggeration to say that Andre fell in love with this approach! Ever since then, it has become an increasingly important part of his professional life. Gratian has studied the works of Wyckoff, Edwards & Magee, Edward J. Dewey (cycles) and many others. However, one of my most profitable undertaking has probably been to study Point & Figure charting, which he finds invaluable in analyzing stocks and indices. If he were restricted to one methodology, this is the one that he would choose. This well-rounded background has given him what he feels to be a special insight into the stock market, facilitating the recognition of meaningful patterns and the ‘turning points’ in all trends, whether they be short or long term. Andre feels very comfortable discussing the stock market and passing on meaningful information to others. His subscribers include individuals and money managers throughout the world. Moreover, his Newsletters are currently published on several financial sites, here and abroad.
More from Gold-Eagle


