Technical Analysis Of The Markets


Current Position of the Market
SPX Long-term trend: Uptrend continues with a serious loss of upside momentum in weekly indicators.
SPX Intermediate trend: An ending diagonal appears to be in its last stage of completion (5).
Analysis of the short-term trend is done on a daily-basis with the help of hourly charts. It is an important adjunct to the analysis of daily and weekly charts which discuss longer market trends.
Still On Track
Market Overview
Last week’s new high brought us closer to our projection and, as long as we do not see contradictory patterns, another high; and perhaps two more can be expected. Whether it’s one or two may depend on next week’s action. Friday’s minor correction found support where it should have and closed well, but the Globex dipped a couple of points right after the close. If a deeper correction is experienced and, if we go too deep, it will take longer to get back into an uptrend, and with the 20-wk cycle due to bottom in mid-August, what remains of the bullish time frame is getting shorter and shorter. On the other hand, a dip in Globex on Friday does not necessarily mean a weaker opening on Monday. If we make a new high early in the week and start to correct a few days later, we would still have enough time for one final thrust into the target area (about 2500). I still expect the 20-wk cycle bottoming action to be the trigger for an anticipated three-month correction into October.
Analysis: (These Charts and subsequent ones courtesy of QCharts.com)
Daily Chart
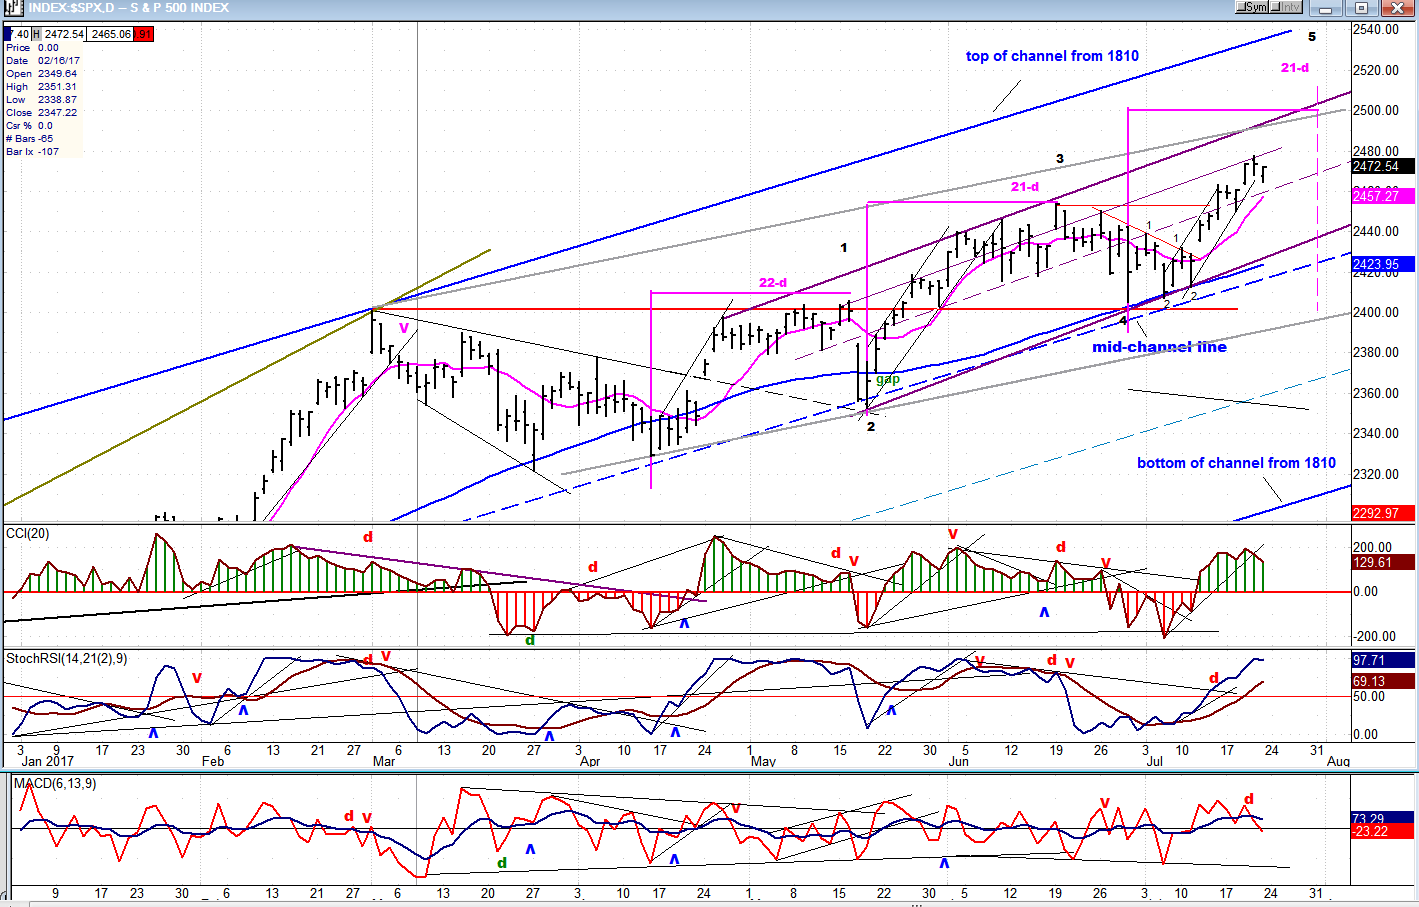
SPX continues to rise within the confines of the purple channel which encompasses the entire ending pattern and which now matches the rate of ascent of the blue 55-DMA. The larger blue channel from 1810 is rising at the same rate as the 233-DMA. If the index continues to increase in price until it touches the top of the purple channel, it will find itself at about 2500, which is the projection based on the P&F accumulation just above 2330.
The first two waves of the ending pattern measure about the same distance (22 and 21 days) from beginning to end. If, by some strange coincidence, the third one concludes within the same time frame, it would complete on 7/31. Of course, one should not expect such exactitude, but it will be interesting if it turns out to be correct.
With the dashed blue mid-channel line providing almost perfect support for the bottom of each of the three waves, we should expect confirmation of the sell signal when it is penetrated, just before the low of wave 4 is breached.
The momentum oscillators may already have peaked and should soon start to retrace to form the expected negative divergence materializing as the final target is reached. This may already be taking place in the A/D oscillator.
Hourly Chart
Which are we to believe: the cash index which closed well -- but remained within its corrective channel
-- or the Globex which closed weak, perhaps in anticipation of the FOMC statement next week? Normally, what the Globex does on Friday does not reliably forecast how the market will open on Monday morning, but the FOMC meeting just ahead might give it a little more credibility.
The pull-back to 2465 was exactly what was expected considering the small pattern of distribution which formed at Thursday’s top; and perhaps we will just be adding to the bottom pattern with additional consolidation on Monday. The indicators are neutral, but also in a good position to turn up and give a buy signal if we follow through on the upside from here.

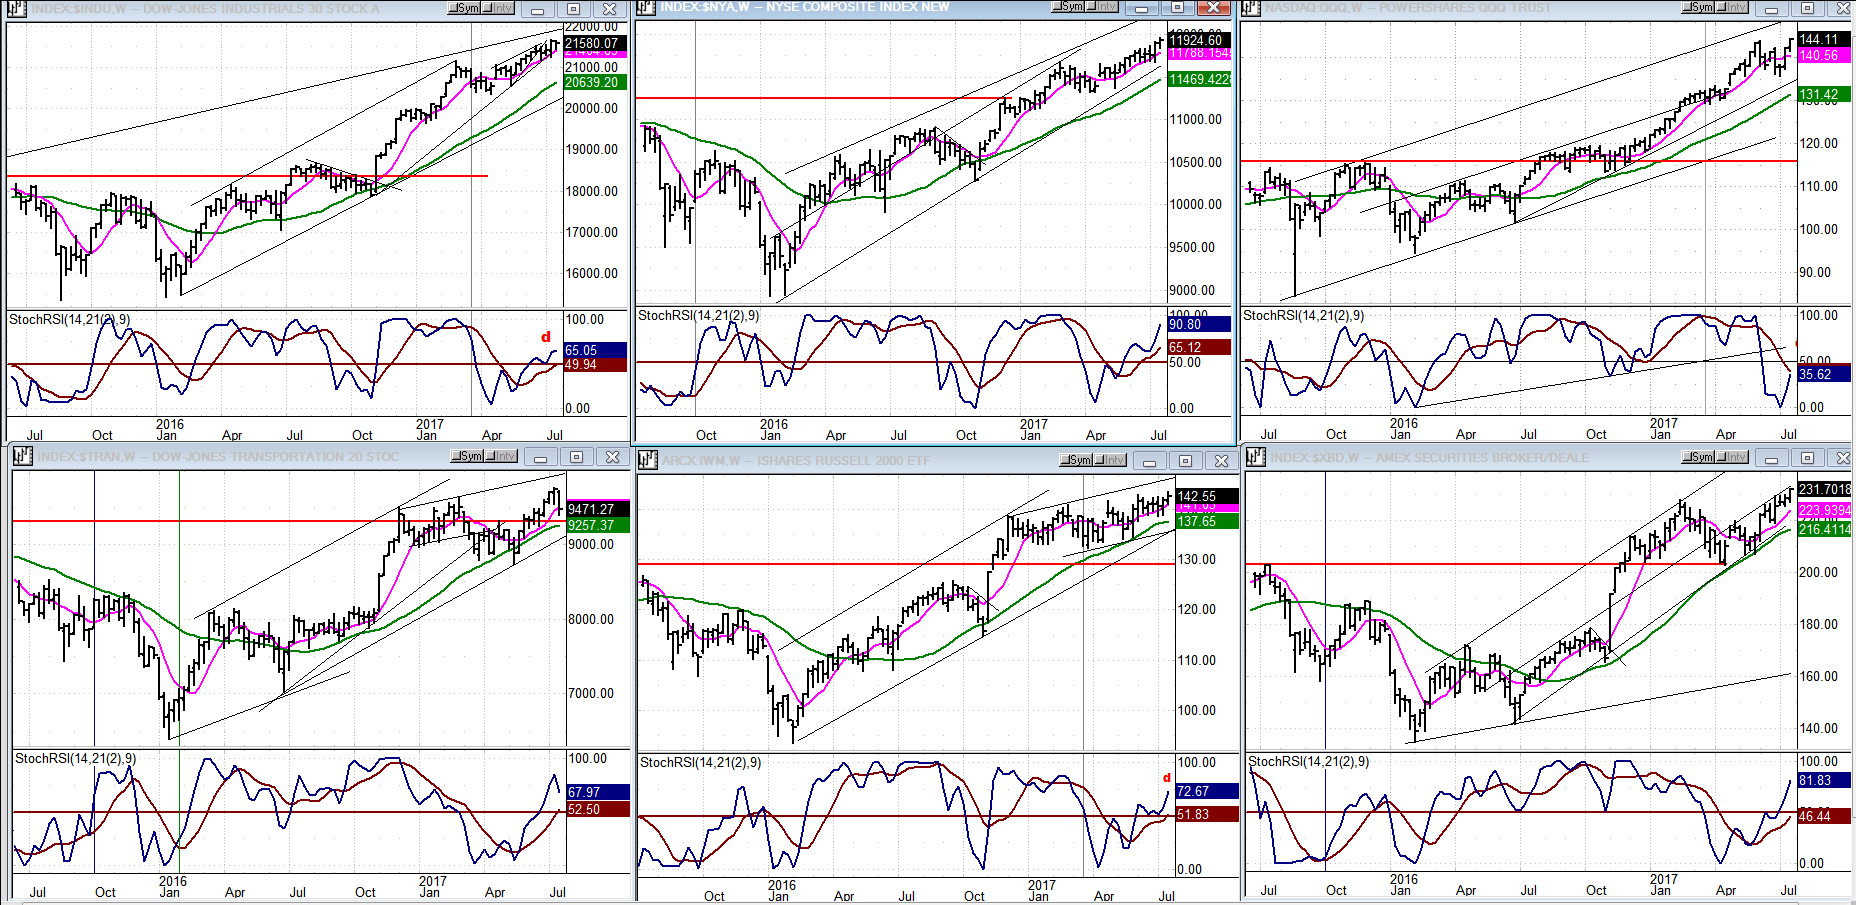
An Overview Of Some Important Indexes (Daily Charts)
Leading market indexes are still in solid long-term uptrends, even the transportation index, even though it is having difficulty breaking and staying above its 2015 top. None show a significant reversal pattern at the weekly level. They do show some pronounced deceleration of their weekly trends which is expressed as negative divergence in their SRSI indicator, and this suggests that a reversal of intermediate proportion is near. The QQQ and the tech sector have recovered from their recent sharp correction. Watch for their next selling phase to be even more violent as they initiate the most important correction since the 1810 SPX low.
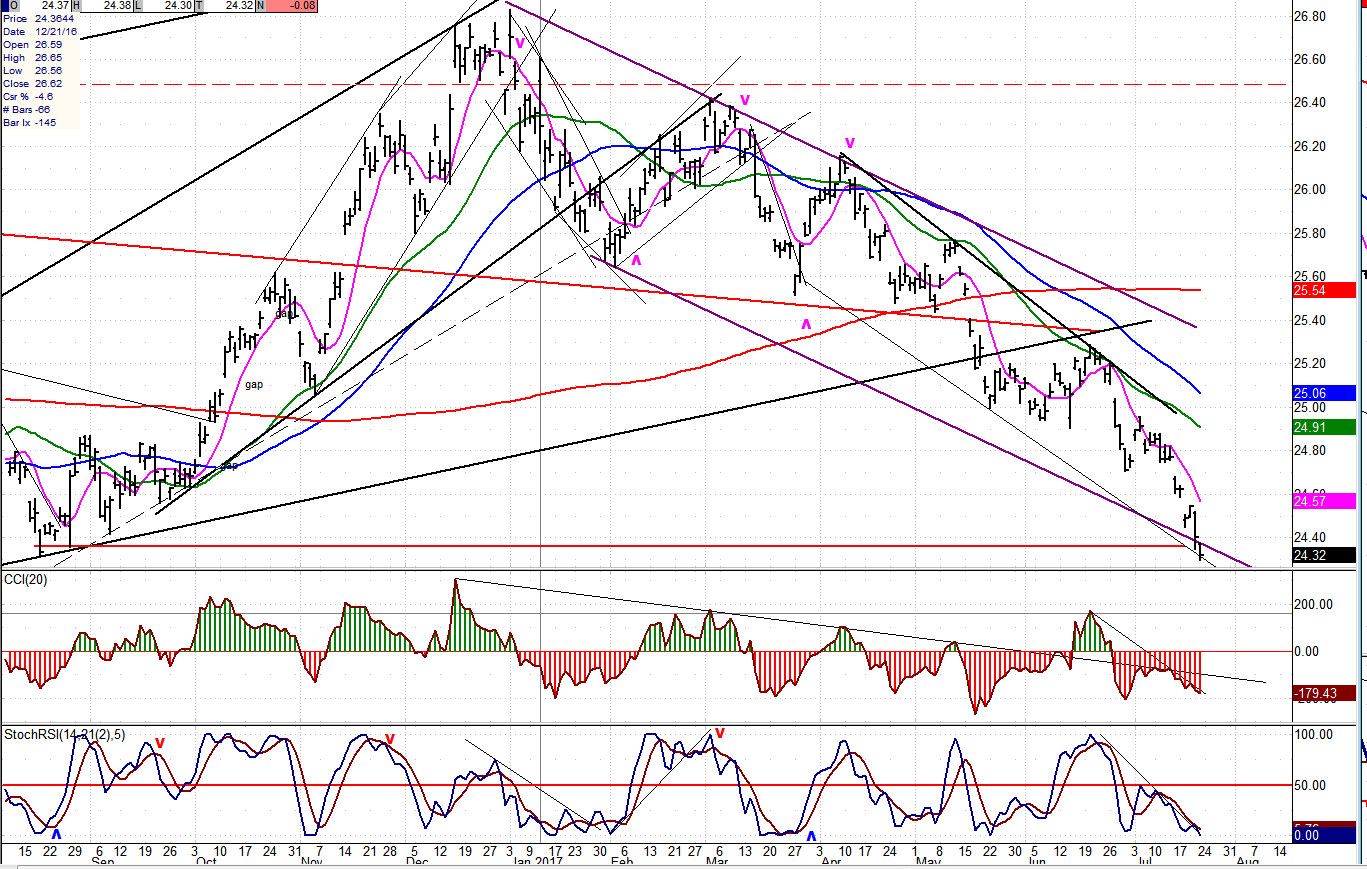
UUP (Dollar ETF)
UUP has continued to correct and has now met its 24.50 P&F target and should now reverse. A more aggressive count could take it down another point to 23.50 but, if that occurs, it could open the door for a much more protracted decline which would suggest a potential re-test of the 2011 low.
GDX (Gold Miners)
GDX has finally responded to its 9/10-wk cycle reversal, and extended its re-bound to 2.50 points with the potential of adding another .50/1.00 points before being pulled back by the bottoming 25-28D cycle due in the first two weeks of August. Should the correction into that low be mild, it would put the index in a position to start a good advance, afterwards.
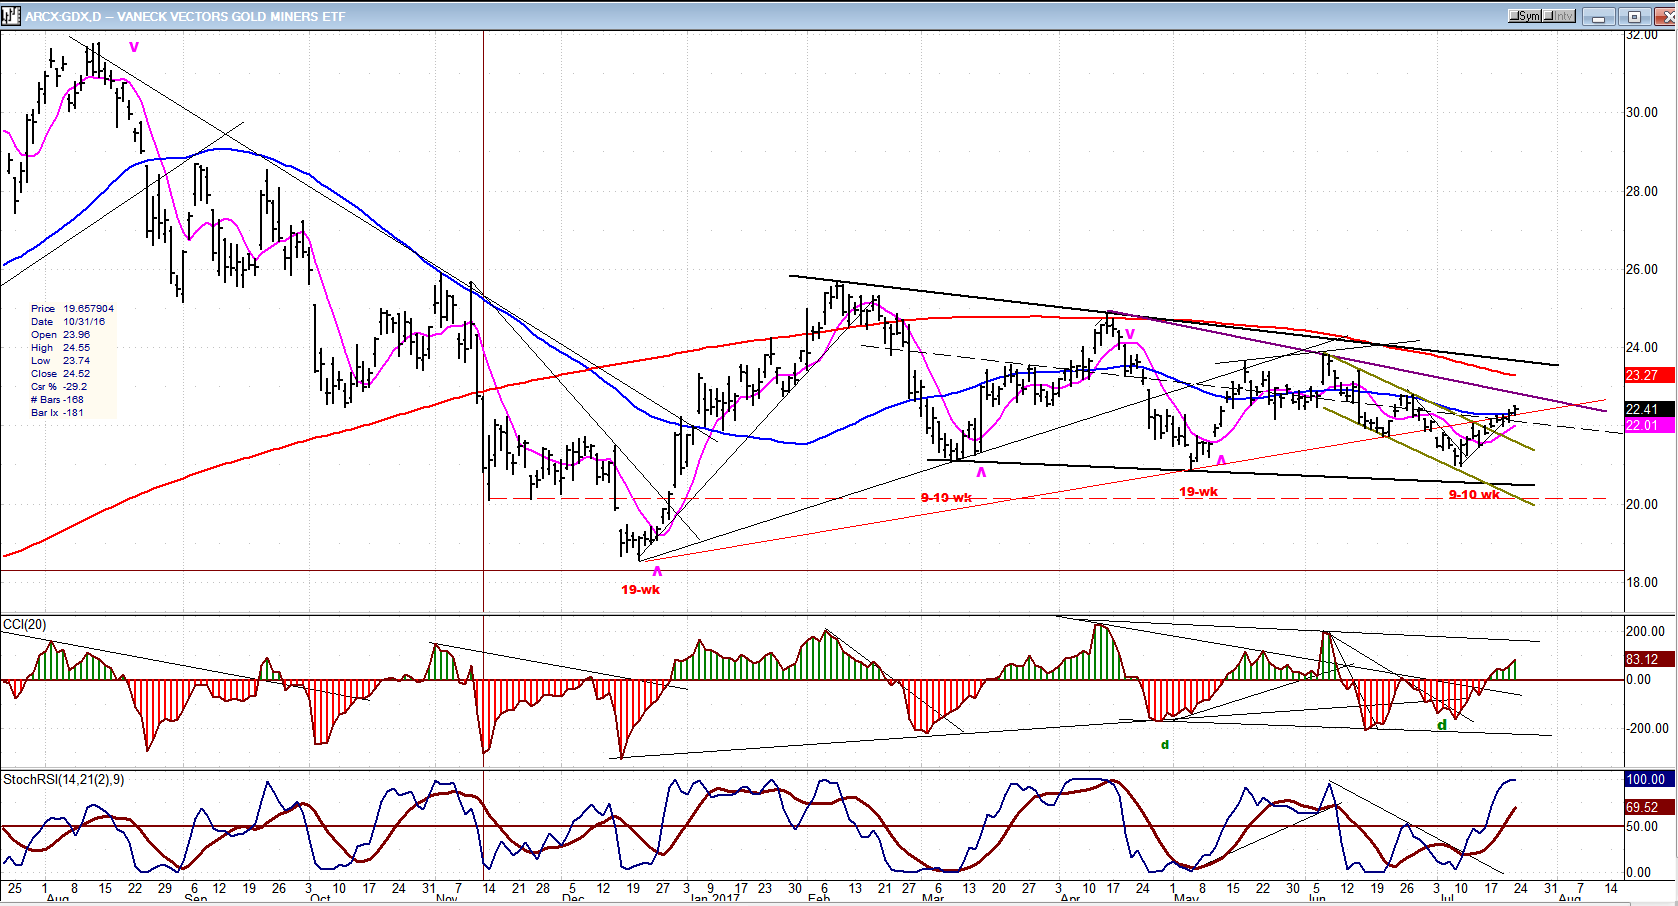
Note: GDX is now updated for subscribers throughout the day, along with SPX.
USO (United States Oil Fund)
The SRSI suggests that USO should have one more pull-back. If it does not make a new low, it might be able to rally to the top of its secondary channel.

Summary
At the end of the week, SPX was ambiguous about its next near-term move. An immediate break-out could take it to the low 1480s, but it’s possible that it will choose to retest 1465 first. The longer-term prospects still point to the ca. 2500 objective before the start of an important correction.
********
For a FREE 4-week trial, send an email to [email protected], or go tand click on “subscribe”. There, you will also find subscription options, payment plans, weekly newsletters, and general information. By clicking on "Free Newsletter" you can get a preview of the latest newsletter which is normally posted on Sunday afternoon (unless it happens to be a 3-day weekend, in which case it could be posted on Monday).
The above comments and those made in the daily updates and the Market Summary about the financial markets are based purely on what I consider to be sound technical analysis principles. They represent my own opinion and are not meant to be construed as trading or investment advice, but are offered as an analytical point of view which might be of interest to those who follow stock market cycles and technical analysis.

When Andre Gratian was a stock broker years ago, a friend introduced him to technical analysis of the market. Consequently, it is not an exaggeration to say that Andre fell in love with this approach! Ever since then, it has become an increasingly important part of his professional life. Gratian has studied the works of Wyckoff, Edwards & Magee, Edward J. Dewey (cycles) and many others. However, one of my most profitable undertaking has probably been to study Point & Figure charting, which he finds invaluable in analyzing stocks and indices. If he were restricted to one methodology, this is the one that he would choose. This well-rounded background has given him what he feels to be a special insight into the stock market, facilitating the recognition of meaningful patterns and the ‘turning points’ in all trends, whether they be short or long term. Andre feels very comfortable discussing the stock market and passing on meaningful information to others. His subscribers include individuals and money managers throughout the world. Moreover, his Newsletters are currently published on several financial sites, here and abroad.


