Technical Analysis Of The Markets


Current Position of the Market
SPX Long-term trend: The uptrend should continue after pausing for a correction.
SPX Intermediate trend: “An ending pattern appears to be in its last stages of completion. This should be followed by an intermediate term correction into October.” The correction has started.
Analysis of the short-term trend is done on a daily-basis with the help of hourly charts. It is an important adjunct to the analysis of daily and weekly charts which discuss longer market trends.
Counter-Trend Rally
Market Overview
After the 20-wk (40-wk?) cycle made its low on 8/21 (date adjusted from 8/10), SPX started a counter-trend rally -- or a b-wave, after the a-wave low of 2417, if you prefer -- and there is no conclusive sign that this rally is over. Most of the short-term indicators are still biased upwardly, and until we break the 2430 level (minimum), the trend is still up. If that is the case, the resumption of the uptrend should be early next week (perhaps Monday) and the index could reach 2479 before completing its retracement of the original decline to 2417. I am presenting you with the most bullish picture for the short-term, but would not do so if it did not offer the best technical analysis probability.
Assuming this scenario will be realized, that would complete the b-wave of the correction, and it would be followed by the c-wave which should ideally extend into October. Date-wise, the rally should conclude right around Labor Day. Therefore, you should be ready for a reversal to occur, especially if SPX makes it to the target stated above determined by P&F and Fibonacci projections; and even if it does not!
Analysis: (These Charts and subsequent ones courtesy of QCharts.com)
Daily Chart
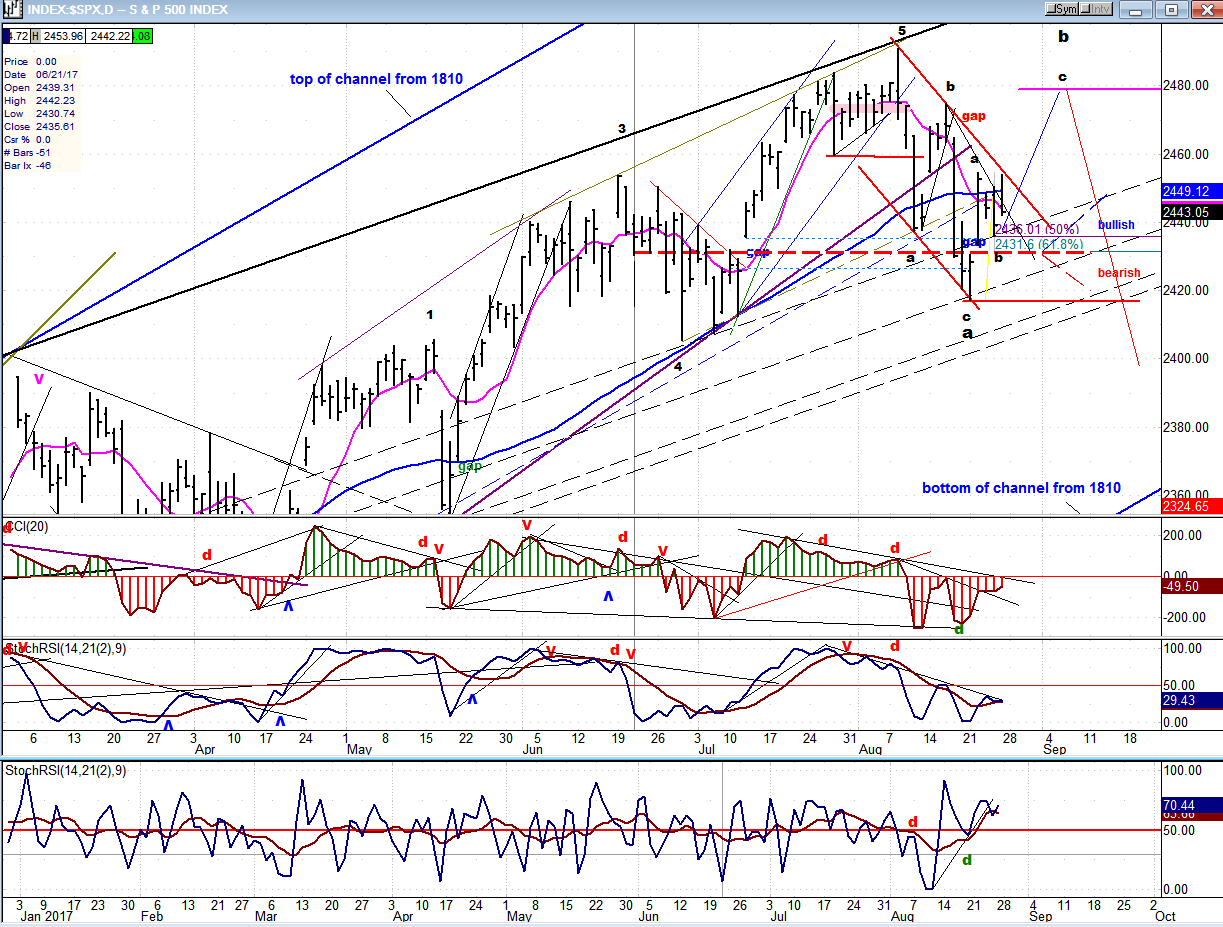
I have made some notations on the chart which best explain where we are and what is expected of the index over the next few days and weeks. It is a graphical representation of what is stated in the Market Overview. After the rally from 2417, we rallied to 2454, or 50% of the distance from the to -- a normal retracement. Then we declined to 2436, another “random” 50% of the rally to 2454. We went on to retest the 2454 level and failed to surpass it by a fraction, which brought a little more selling. This has taken us to Friday’s close of 2436, and at a point where the index needs to decide what it wants to do next.
As also stated above, there is a bullish bias in the indicators, primarily in the A/D oscillator which only retraced to neutral on the pull-back from 2454. It remains positive after the second pull-back into Friday and appears to be waiting for the other two to catch up. We need for them to give a buy signal, even if it is only a brief one, to get the index above 2454 and start its move toward our 2479 target.
The entire short-term index position is, at worst, neutral. All the retracements have held where they should have, and the structural pattern is typical of a consolidation within our counter-trend rally. So, until proven otherwise, another few days on the upside to finish the rally are expected. But we’d better not tarry at this level or all bets are off, especially if we drop below 2430 and then 2417! There is a 6-wk cycle low due right after Labor Day which typically waits until the last minute to bottom.
Hourly Chart
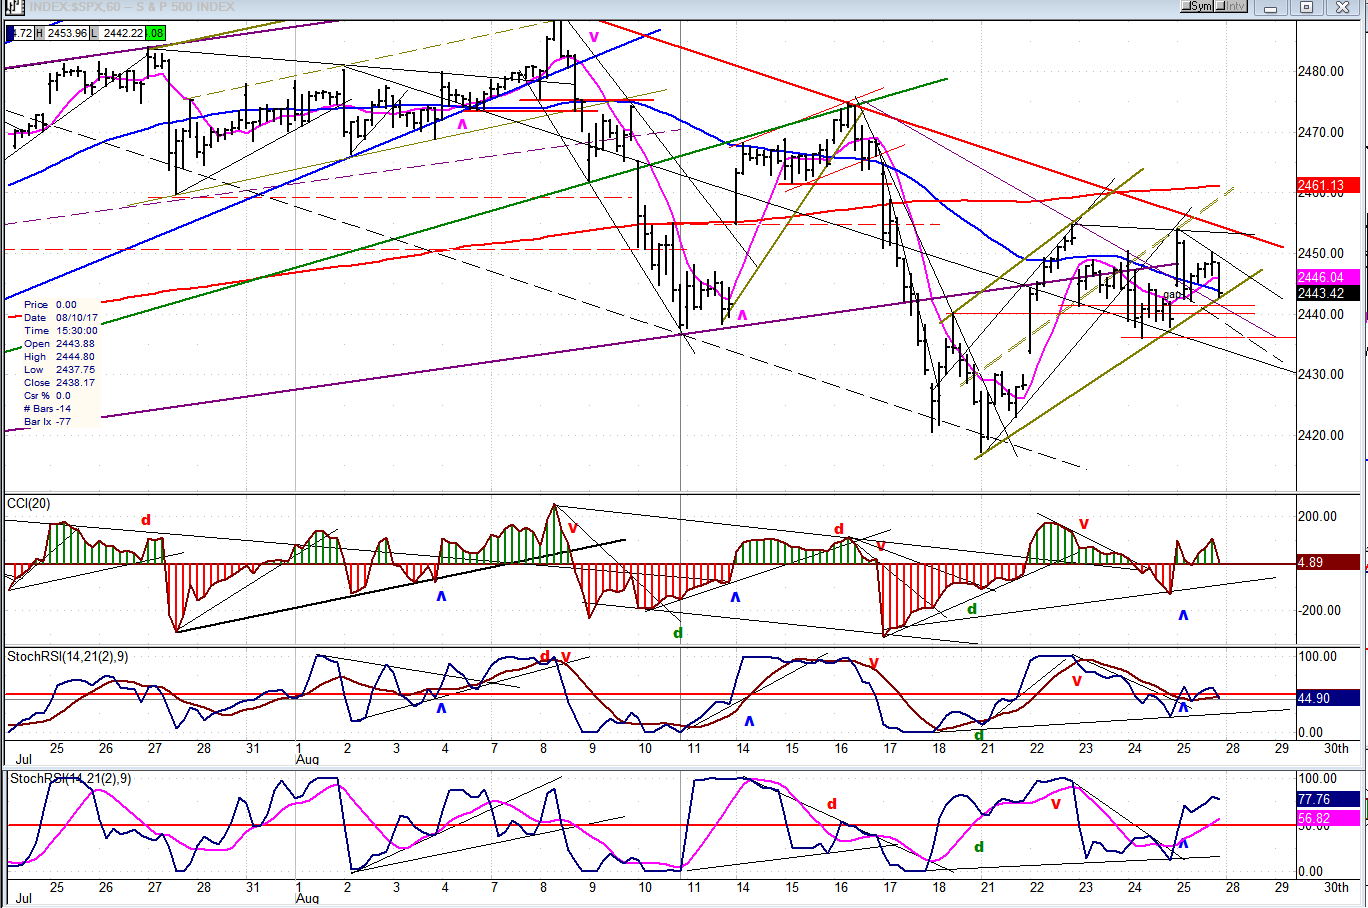
The hourly chart is also neutral with a positive bias that comes primarily from its indicators, with, as it does in the daily chart, the A/D oscillator showing the most positive pattern. In this case, the momentum is completely neutral, having tried to become positive on Thursday, but pulling back to the zero line on Friday. You can see why the index must make up its mind by early next week.
After Friday’s pull-back into the close, the index is sitting on a MA, trend and channel lines, parallels, support levels, and what not! It would not be too cool if it penetrated all that on the downside. If it did, you could probably kiss goodbye the scenario outlined above with a projection to the 2479 level. Even if it held at the 2430 maximum retracement level, it would have made a mess of the beautiful structure we have so far, and created some doubt about what comes next! Let’s hope the professional traders, who have some limited manipulative leverage over the market, keep it simple.
An Overview Of Some Important Indexes (Daily Charts)
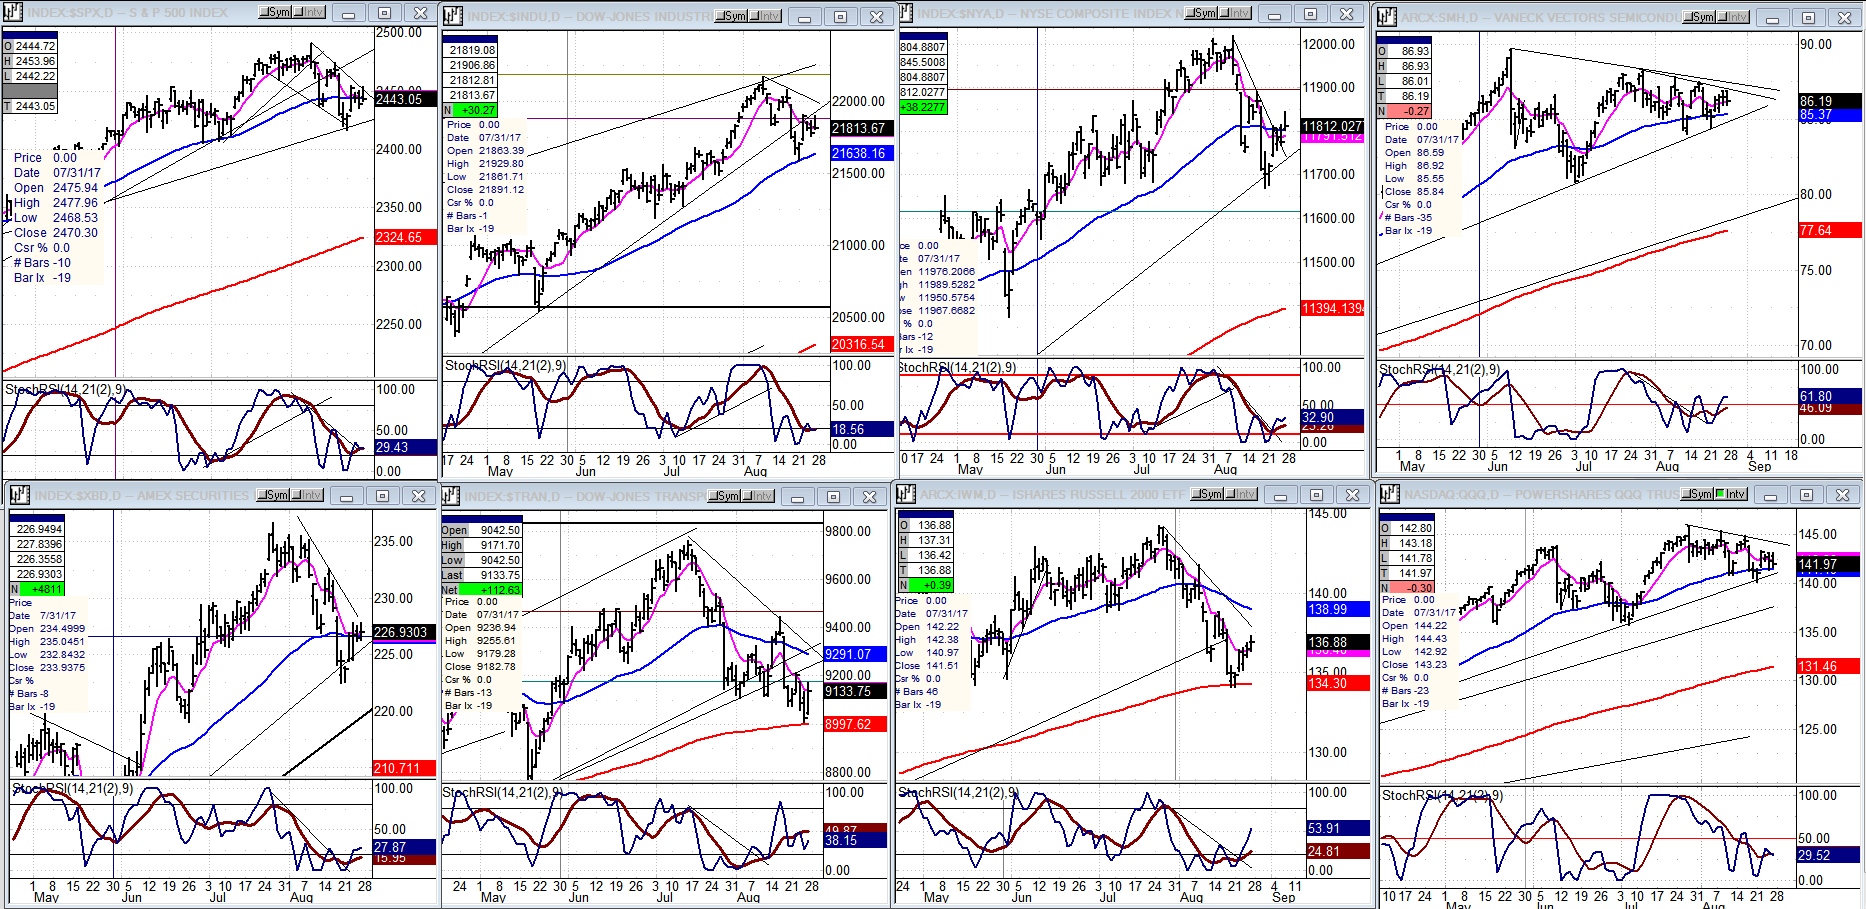
It is clear that all the indexes below are uniformly consolidating after rallying from their previous lows. What is not clear is whether they will continue up from here and complete this rally at a higher level, or turn back down and continue the larger correction. The oscillators at the bottom of the charts suggest that the move will be up instead of down. The two usual leaders, TRAN and IWM appear to support this view: TRAN is showing positive divergence, and IWM has already started an uptrend in its oscillator.
UUP (Dollar ETF)
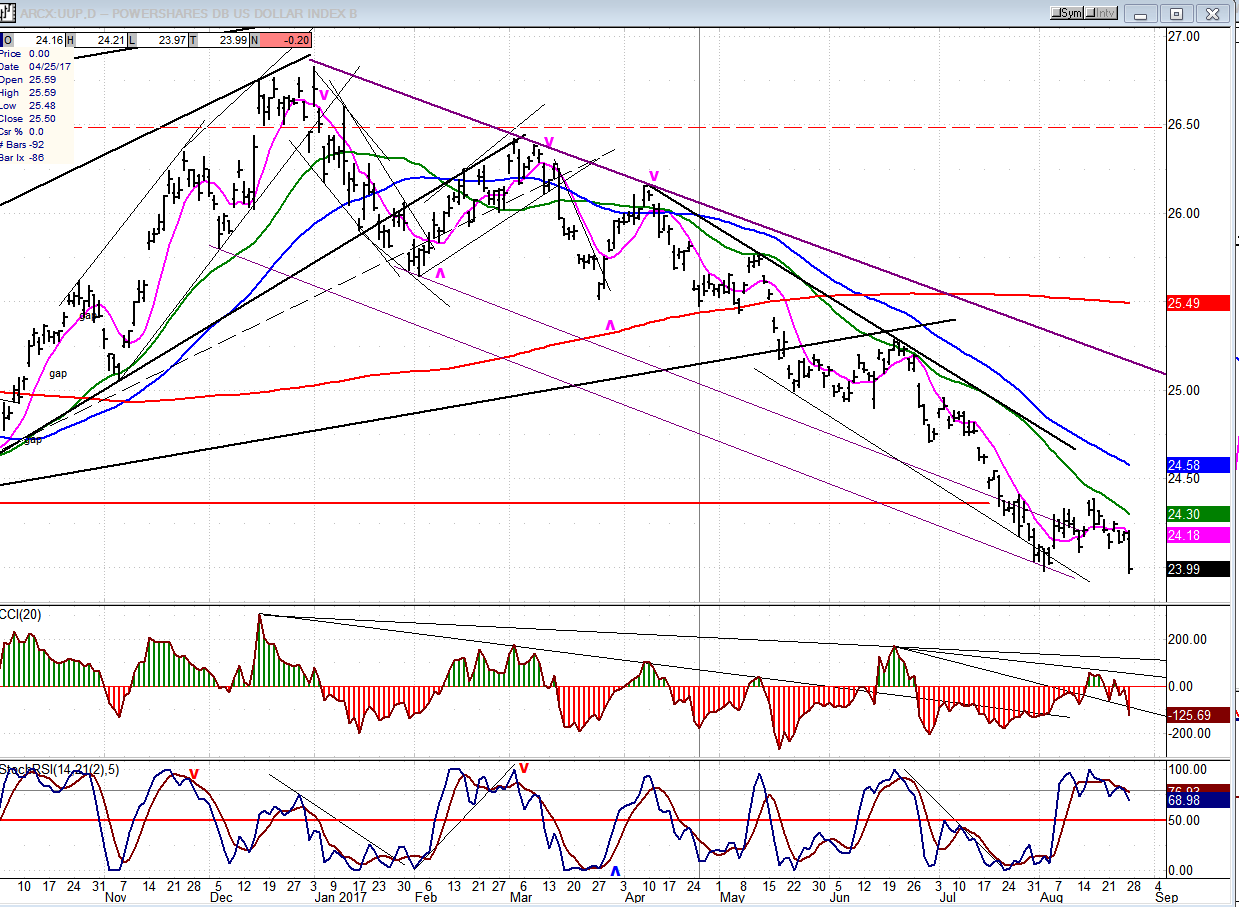
No strength in UUP. The best we can hope for is that this is a retest of the low and that it will start forming a base. The worst is that it will make a new low.
GDX (Gold Miners ETF)
After struggling at the 23.00 level for about a week, GDX took advantage of the weakness in UUP to finally push to 23.50. While that does not represent a forceful break-out, it may have mitigated a protracted decline into its upcoming cycle low.

Note: GDX is now updated for subscribers throughout the day, along with SPX.
USO (United States Oil Fund)
As suggested last week, USO appears to be building a small consolidation pattern which will eventually result in a challenge of its secondary top channel line.

Summary
Expectations are that the rally from 2417 has a little more to go, possibly to 2479, before the secondary (intermediate) trend resumes.
********
For a FREE 4-week trial, send an email to [email protected], or go to (and click on) “subscribe”. There, you will also find subscription options, payment plans, weekly newsletters, and general information. By clicking on "Free Newsletter" you can get a preview of the latest newsletter which is normally posted on Sunday afternoon (unless it happens to be a 3-day weekend, in which case it could be posted on Monday).
The above comments and those made in the daily updates and the Market Summary about the financial markets are based purely on what I consider to be sound technical analysis principles. They represent my own opinion and are not meant to be construed as trading or investment advice, but are offered as an analytical point of view which might be of interest to those who follow stock market cycles and technical analysis.

When Andre Gratian was a stock broker years ago, a friend introduced him to technical analysis of the market. Consequently, it is not an exaggeration to say that Andre fell in love with this approach! Ever since then, it has become an increasingly important part of his professional life. Gratian has studied the works of Wyckoff, Edwards & Magee, Edward J. Dewey (cycles) and many others. However, one of my most profitable undertaking has probably been to study Point & Figure charting, which he finds invaluable in analyzing stocks and indices. If he were restricted to one methodology, this is the one that he would choose. This well-rounded background has given him what he feels to be a special insight into the stock market, facilitating the recognition of meaningful patterns and the ‘turning points’ in all trends, whether they be short or long term. Andre feels very comfortable discussing the stock market and passing on meaningful information to others. His subscribers include individuals and money managers throughout the world. Moreover, his Newsletters are currently published on several financial sites, here and abroad.


