Technical Analysis Of The Markets


Current Position Of The Market
SPX Long-term trend: The uptrend should continue after pausing for a correction.
SPX Intermediate trend: Unconfirmed sell signal.
Analysis of the short-term trend is done on a daily-basis with the help of hourly charts. It is an important adjunct to the analysis of daily and weekly charts which discuss longer market trends.
Irma Delays Uptrend
Market Overview
I have been making the analysis of the market more complicated than it should be. To put it in more simple terms:
The long-term uptrend (bull market) is still positive, and it should make a new high before coming to an end.
The intermediate term trend was interrupted by the bottoming of the 40-wk cycle, which may have also created a top at 2491. This top is currently in the process of being re-tested, with the possibility that it could be exceeded by a move to about 2500 before a full-blown intermediate correction takes place, lasting into October/November.
The short-term trend is currently up since the 2417 low of 8/21. It has paused after making a higher high and appears to be close to extending its rally. It has created enough of a re-accumulation pattern to get it up to 2500 if it continues its uptrend starting Monday.
Analysis: (These Charts and subsequent ones courtesy of QCharts.com)
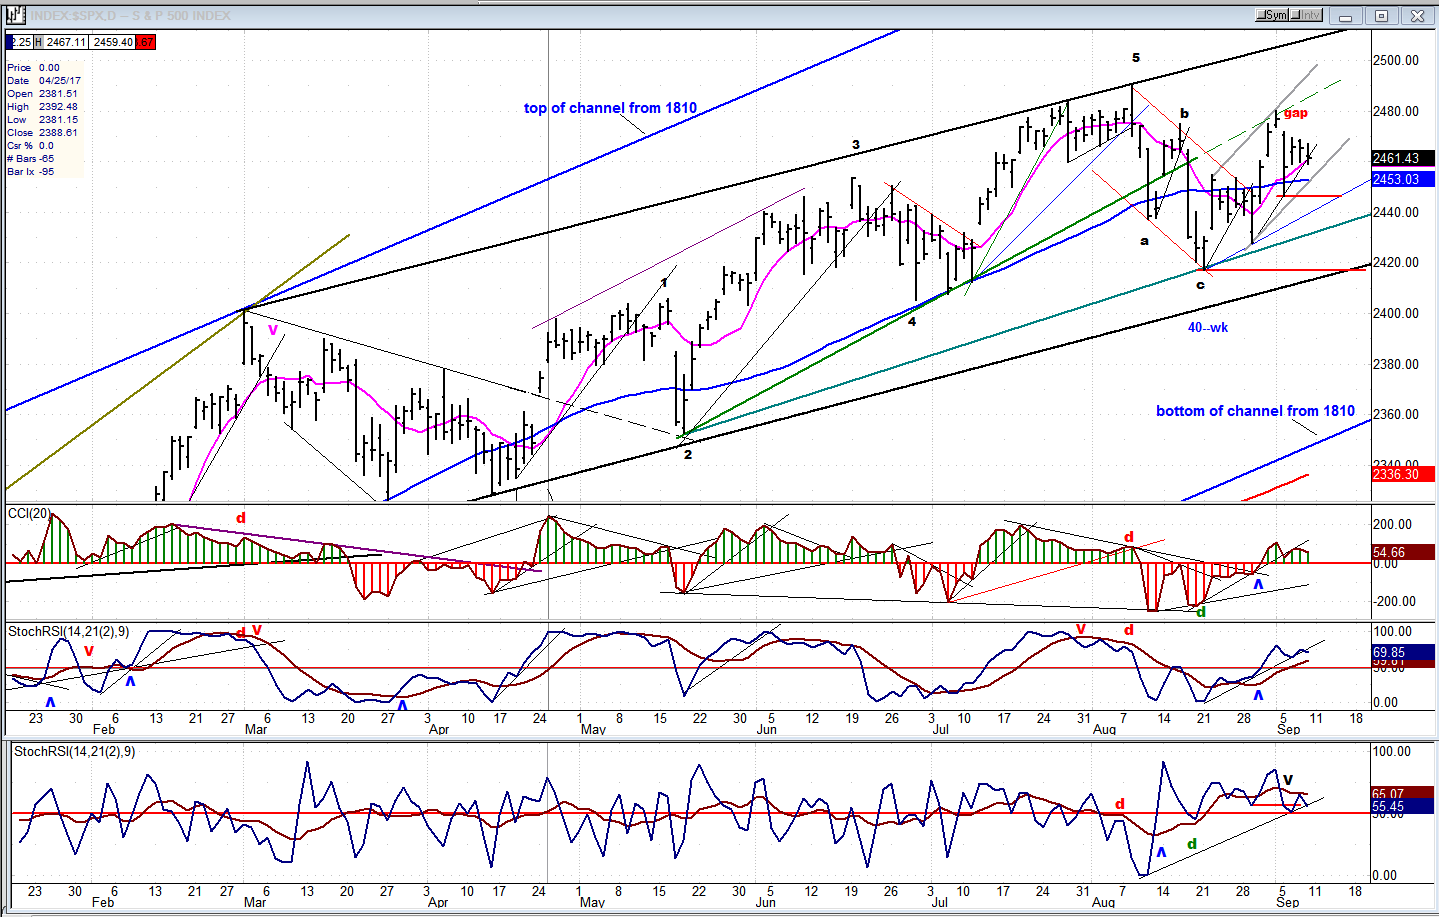
Daily Chart
The SPX has been moving in a nice channel and it will remain in an intermediate uptrend as long as it remains in that path. I thought the 40-wk cycle which bottomed in mid-August might be the trigger which could start an intermediate decline into October/November and it still might, if the current rally from 2417 comes to an end before we can make a new high. The index would have to reverse before it gets to 2491, break below the small horizontal red line at 2446 to warn that it is turning negative, and eventually break below 2417 to confirm that the downtrend has started. Until it does this, we are still in an uptrend for all time frames. Since Friday was the low of a 6-wk cycle, unless it inverts we should be going higher over the near-term. This should have happened on Friday, but Irma probably delayed the process until Monday – best guesstimate, at least!
The amount of congestion at the 2435-40 level was enough to create a count to 2500. The amount of congestion established at 2460-65 is enough to confirm that count. So, unless we reverse from here, it is possible that this is where we are heading.
The indicators have been in a so-so uptrend since 2417 with a couple of pauses, and will remain positive (which puts the odds in favor of resuming the uptrend) if the 6-wk cycle does its job. Overall, I would have to assess the short-term trend at neutral with a bullish bias.
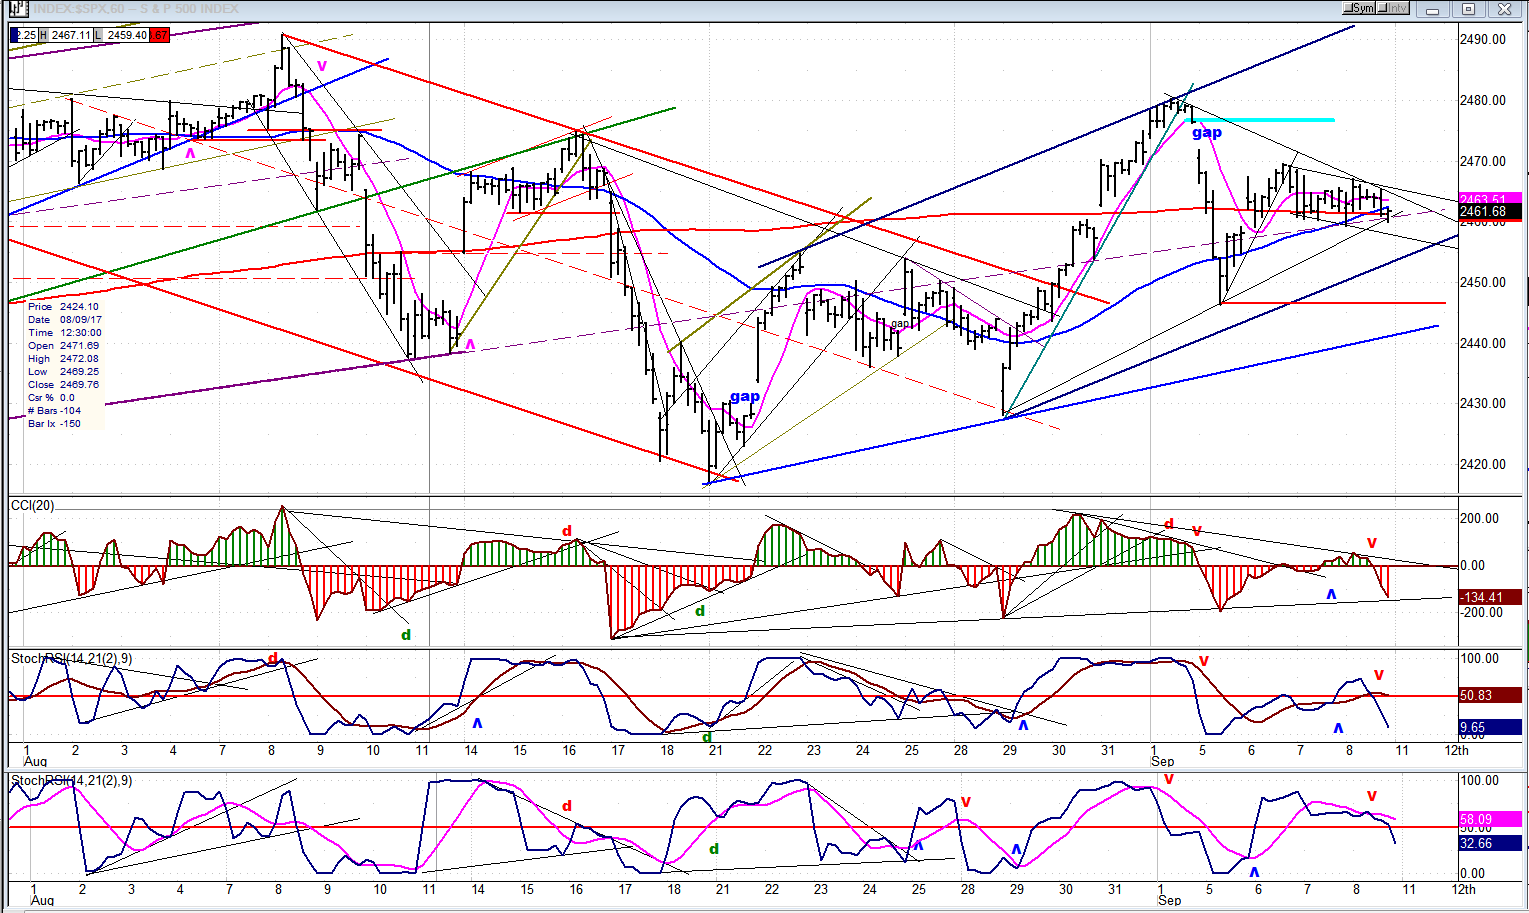
Hourly Chart
The 60-m chart looks neutral, with traders seemingly waiting to find out if Irma will cause them to liquidate. If not, prices could push to the level suggested by the congestion levels. That means that Monday should be a key day for the market. Since the 6-wk cycle ostensibly bottomed on Friday, if Irma was kinder than expected, we could start up first thing Monday morning.
A nice scenario, but there is a little glitch! There was just enough downside pressure on Friday to turn all three hourly oscillators negative into an established downtrend. This is not necessarily a death knell for the uptrend. It may simply mean that a little more wait-‘n-see will be necessary to assess the damage done by Irma. This would push the cycle low into Monday, or possibly Tuesday, but that’s all we can give it; the delay will have to show up as a continued neutral, sideways consolidation. So we’ll continue to monitor to see how things turn out on Monday morning. Our first hint will come from the Globex reading on Sunday.
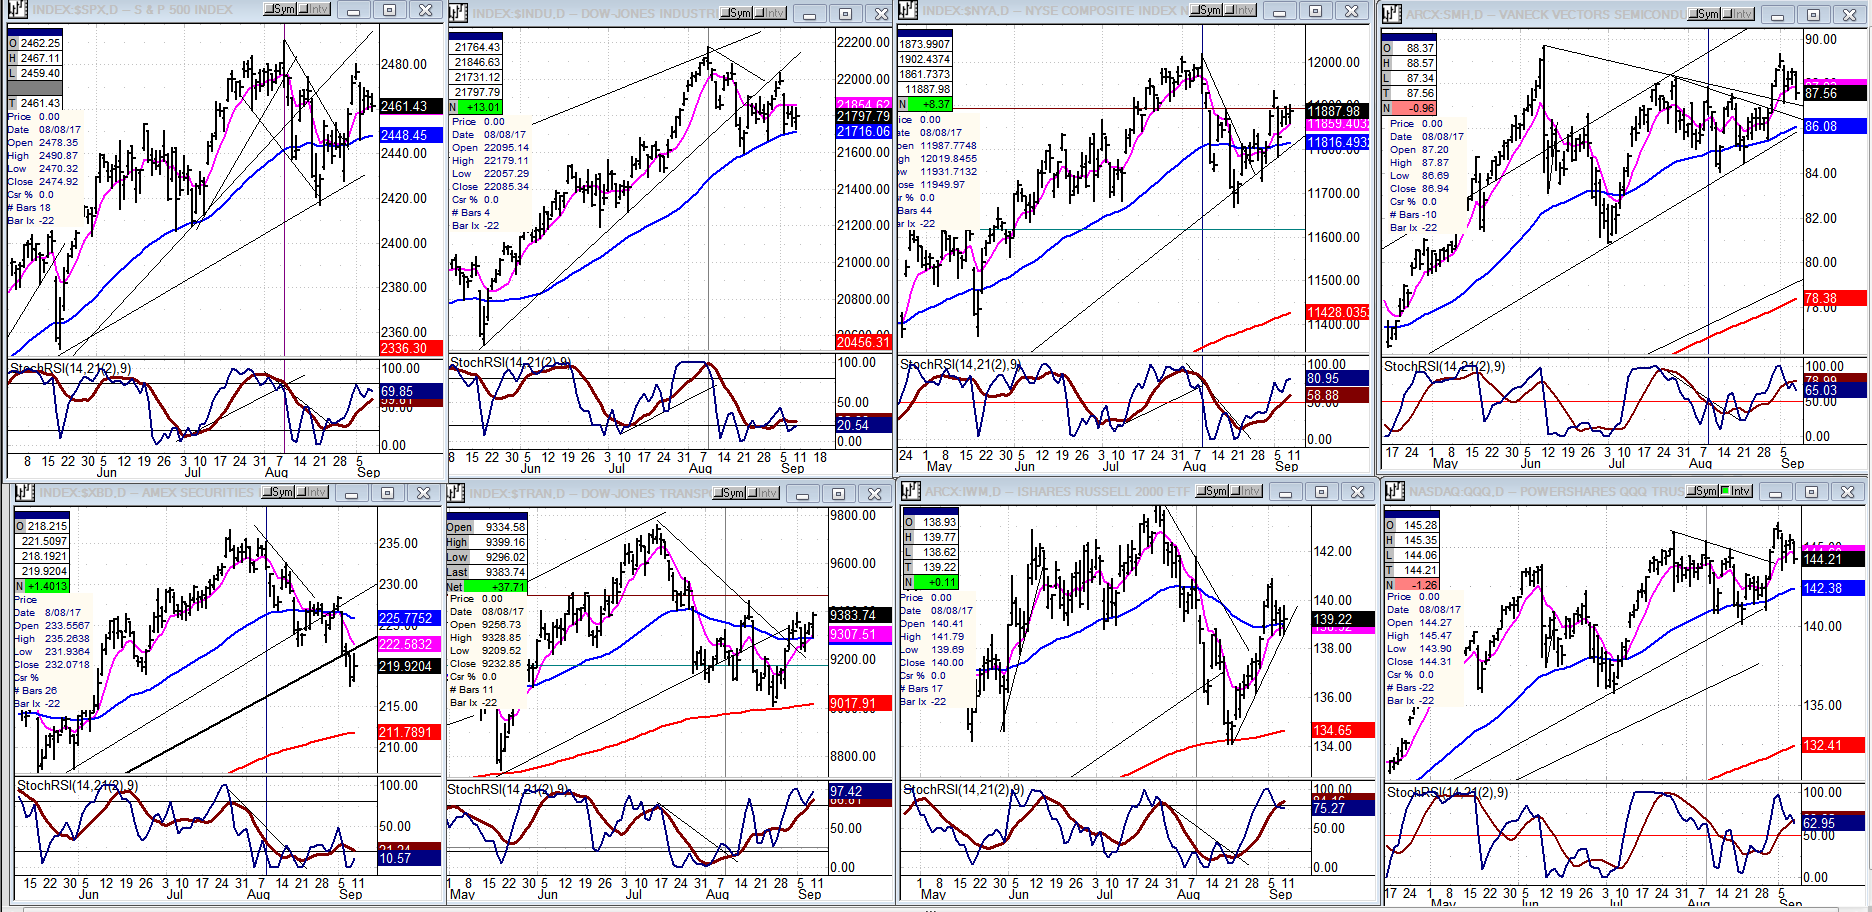
An Overview Of Some Important Indexes (Daily Charts)
Divergence has increased between the indexes below. The techs are distinctly the strongest (SMH top right), and that has helped SPX (top left) to have a semblance of strength while the DJIA (next to SPX), is second weakest to XBD (bottom left), and IWM (bottom, third from left) is holding its own.
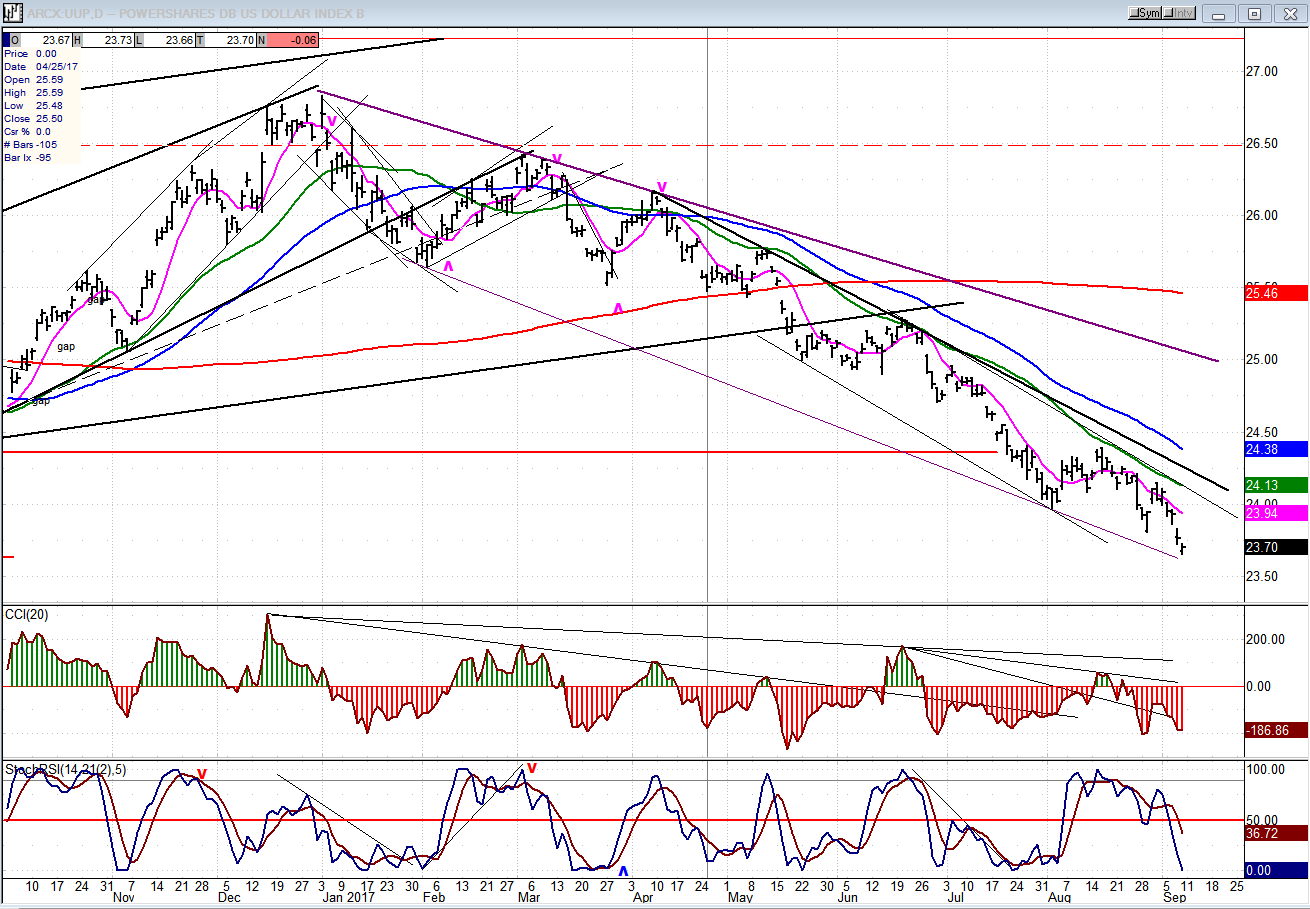
UUP (Dollar ETF)
Continues to decline, but should find a low around 23.50, according to P&F chart.
GDX (Gold Miners ETF)
GDX had a good rally once it got past 23.00, but has reached resistance and should pull back into its cycle lows (which could wait until mid-month to occur) before extending its gains.
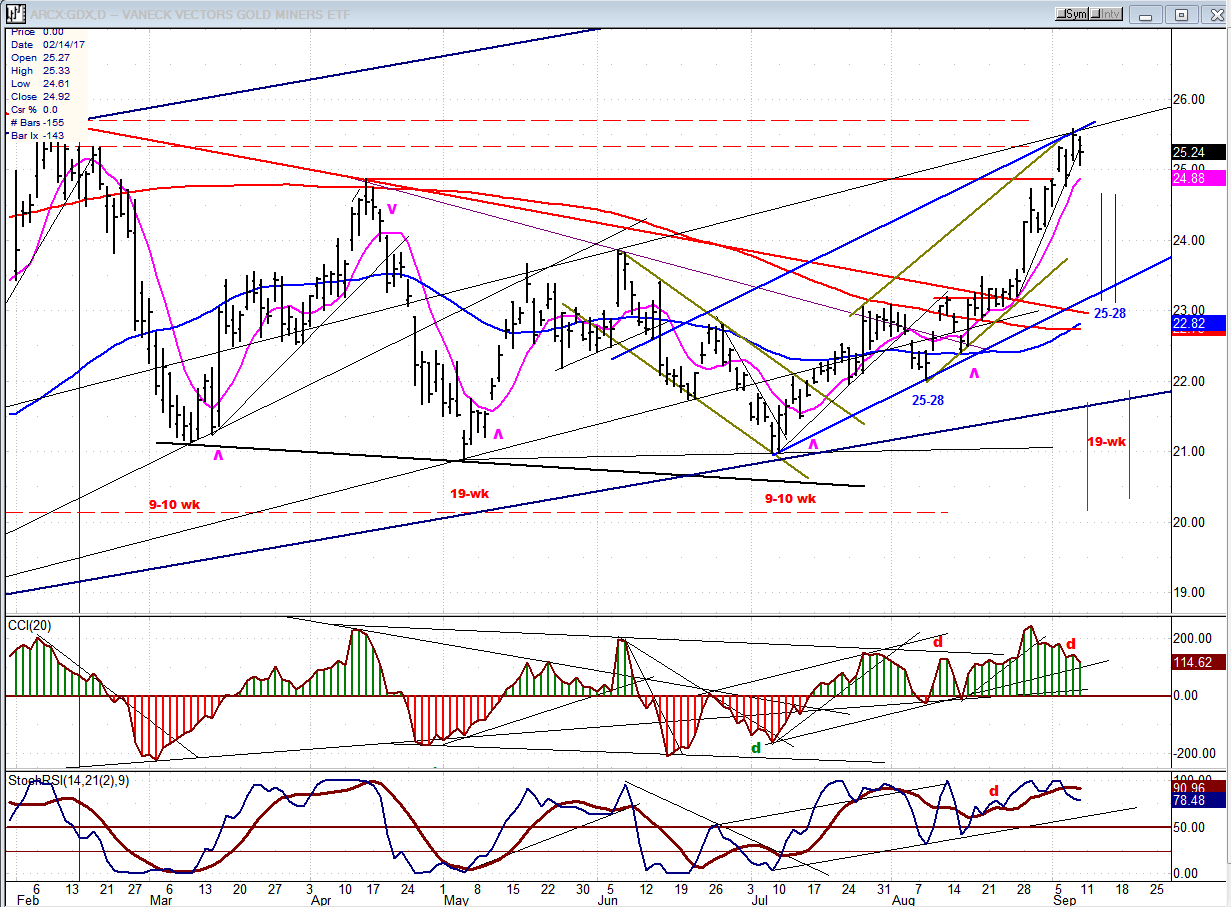
Note: GDX is now updated for subscribers throughout the day, along with SPX. Both, with their derivatives, are good trading vehicles, and you will receive detailed information on both.
USO (United States Oil Fund)
USO has been pushed back once again by the top line of its secondary corrective channel. If it can hold above its recent minor low, it may be able to get through the trend line next time it is challenged.

Summary
Next week – especially Monday and Tuesday – are critical for SPX. If it is to extend its rally to meet its higher projection, it will have to have limited weakness in order to resume its uptrend by the middle of the week.
********
For a FREE 4-week trial, send an email to [email protected], or go to (and click on) “subscribe”. There, you will also find subscription options, payment plans, weekly newsletters, and general information. By clicking on "Free Newsletter" you can get a preview of the latest newsletter which is normally posted on Sunday afternoon (unless it happens to be a 3-day weekend, in which case it could be posted on Monday).
The above comments and those made in the daily updates and the Market Summary about the financial markets are based purely on what I consider to be sound technical analysis principles. They represent my own opinion and are not meant to be construed as trading or investment advice, but are offered as an analytical point of view which might be of interest to those who follow stock market cycles and technical analysis.

When Andre Gratian was a stock broker years ago, a friend introduced him to technical analysis of the market. Consequently, it is not an exaggeration to say that Andre fell in love with this approach! Ever since then, it has become an increasingly important part of his professional life. Gratian has studied the works of Wyckoff, Edwards & Magee, Edward J. Dewey (cycles) and many others. However, one of my most profitable undertaking has probably been to study Point & Figure charting, which he finds invaluable in analyzing stocks and indices. If he were restricted to one methodology, this is the one that he would choose. This well-rounded background has given him what he feels to be a special insight into the stock market, facilitating the recognition of meaningful patterns and the ‘turning points’ in all trends, whether they be short or long term. Andre feels very comfortable discussing the stock market and passing on meaningful information to others. His subscribers include individuals and money managers throughout the world. Moreover, his Newsletters are currently published on several financial sites, here and abroad.


