Technical Analysis Of The Markets


Current Position of the Market
SPX Long-term trend: The uptrend has pushed a little higher, near-term.
SPX Intermediate trend: By rising past 2491 the start of the (inevitable) intermediate correction has been delayed. .
Analysis of the short-term trend is done on a daily-basis with the help of hourly charts. It is an important adjunct to the analysis of daily and weekly charts which discuss longer market trends.
SPX 2500…At Last!
Market Overview
The (approximately) 2500 projection for the SPX was made a long time ago, but when we made the 2491 top, which was followed by the 40-wk cycle-induced decline to 2426, achieving it at some time in the near future did not look very promising. And yet, here we are, a month later!
So now that we have reached 2500, what’s next? There is something magical about P&F and Fibonacci projections that we do not comprehend but cannot ignore, when we analyze the stock market. But it does not mean that they will be one hundred percent reliable and accepted without question. There is no such thing in the stock market! Right now, there is also some disagreement between the 10X and 1X P&F charts that must be resolved
The final price is probably not going to be exactly 2500, probably more like 2503-04, and since this area is being targeted by the count from various levels, it stands a pretty good chance of being correct, but we need to wait for a reversal to occur to be certain that this is what the market intends.
In the meantime, we still need to label all trends, from weekly to 60m, as up.
Analysis: (These Charts and subsequent ones courtesy of QCharts.com)
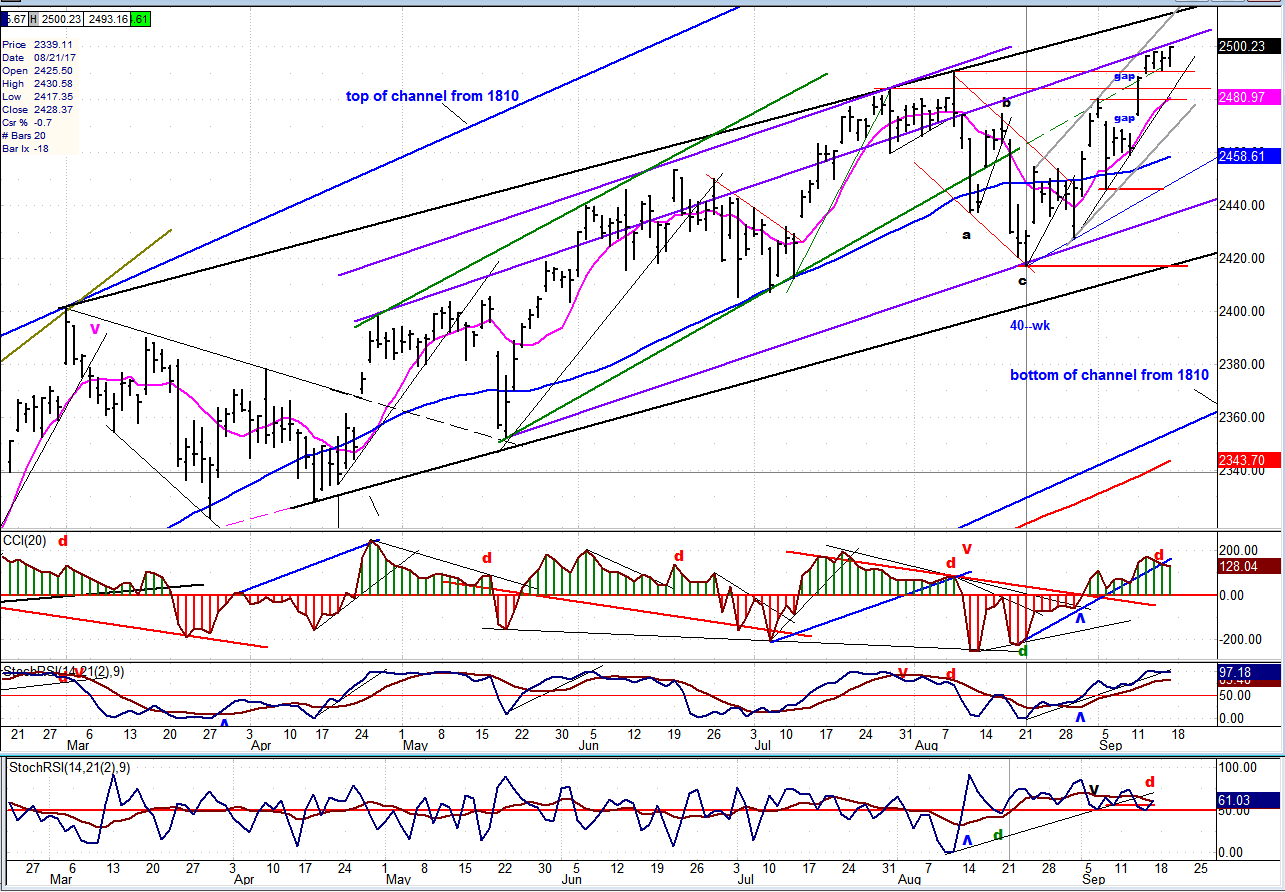
Daily Chart
I use channels as an important source of support and resistance points for the market. The price action which started at 2322 has worked its way up in three different channels. They are identified on the chart by black, purple, and green trend lines. The green channel was busted by the decline of the 40-wk cycle. The bottom line of the purple channel was formed when the low of that cycle was made by connecting it to the 5/18 low, and SPX is now finding resistance at a secondary top channel line drawn as a parallel to the higher one from the 4/26 minor top. Since that resistance coincides with the 2500 projection, we may expect it to cause a reversal in that vicinity (to be confirmed, of course – always!). However, should that level be exceeded substantially, we will have to revise our projection for a top, just as we had to revise the wave count when the index exceeded 2491.
The breaking of the green lower channel line was sudden, due to the 40-wk cycle waiting until the last minute to decline into its low. We do not have that condition here and, besides, we will have another channel line to break before getting to the purple one. It is the bottom line of the minor channel that formed from the 40-wk cycle low, and it could provide temporary support – especially since its level coincides with that of the former minor top. So, the decline should be more gradual until we challenge the bottom of the purple channel where more temporary support can be found. And then, if we presume that, after reaching 2500 we have started to decline into October/November, we will also have to break out of the black channel. In other words, the decline from 2500 should be far more laborious than the one from 2491 -- at least at its start.
The oscillators appear to validate this view of the decline. The momentum oscillators are just beginning to show negative divergence and are still very high, so it may be slow going until they get closer to the zero line.
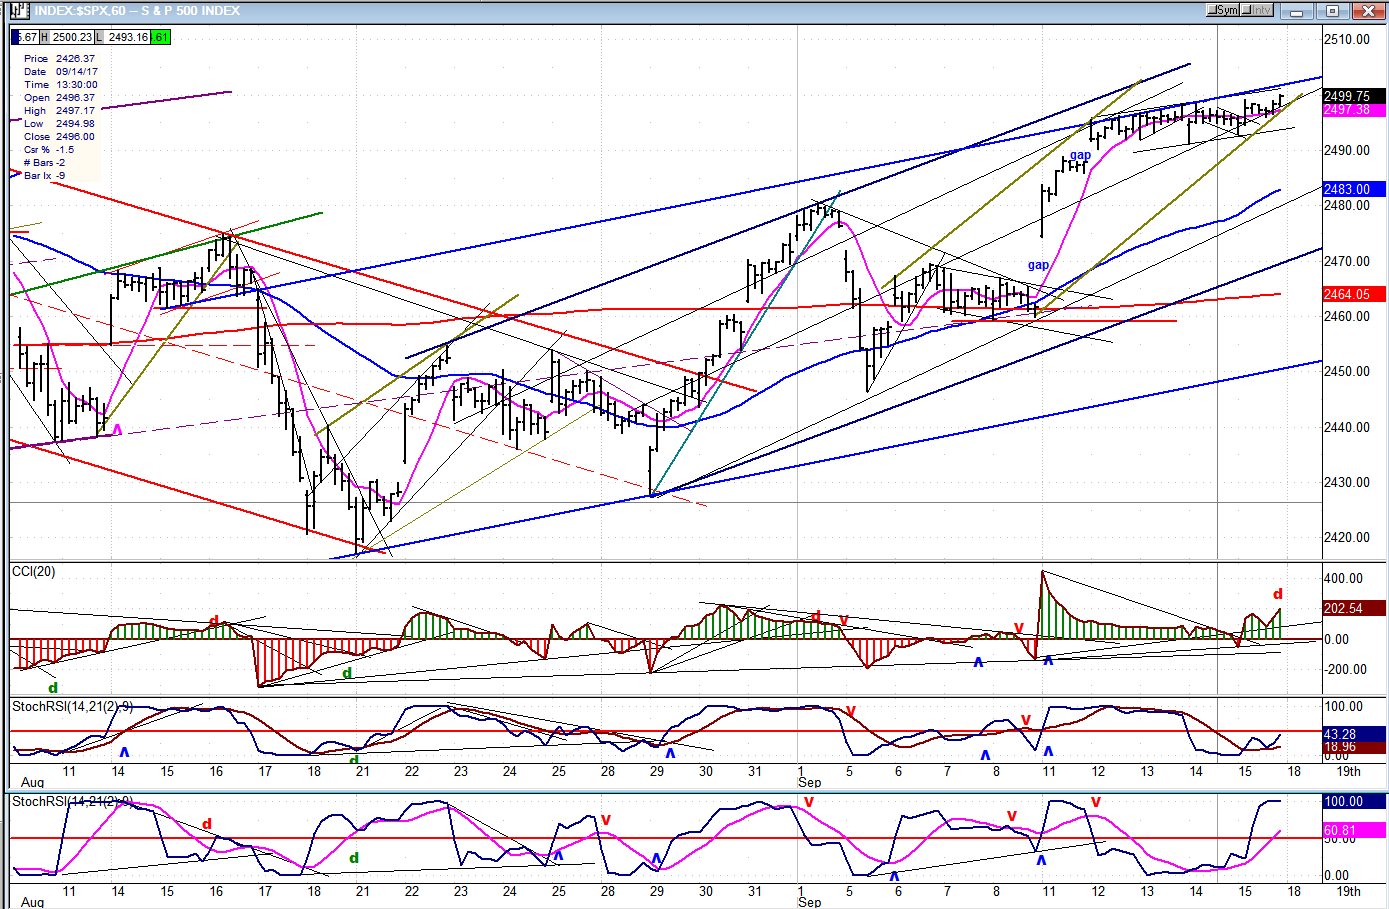
Hourly Chart
I have drawn trend lines for a number of channels here also, but we will concern ourselves with only one of them: the small greenish channel which outlines the last five waves of the rally (from 2447) with a fifth wave currently under formation. For the last 8 hours, the index has not shown very much upside momentum -- simply crawling along the bottom line of the channel, and not pushing away vigorously. The entire deceleration process is four days old. Granted, this could be consolidation for another good push higher, and since that possibility cannot be excluded at this time, this is the reason why we need to see if the projection will be observed and if we get a reversal at this level.
If (when) it does come, the first support level is at 2480, so that should be a logical point for the first selling wave to take a breather. After that, we might go down to close the gap. But we are getting ahead of ourselves. Let’s see if we get a reversal, first!
The hourly oscillators are not nearly as bullish as the daily, but that would change if we can develop some good upward momentum from here, so let’s wait and see what takes place over the next couple of days.
An Overview Of Some Important Indexes (Daily Charts)
The rally has helped the near-term disparity in the charts. Near-term, they are now all pointing up again with each one in the top tier making new highs, last week; seemingly still able to pull up the rear, although none in the lower tier did so, including QQQ (bottom right) for the first time. XBD (bottom left) has now become the weakest of the eight indexes, and this could be a warning, especially if QQQ joins it in resisting any further uptrend. Each one in the bottom tier has been, historically, a market leader par excellence.

UUP (Dollar ETF)
ETF had a small bounce in a downtrend. Nothing significant pointing to a reversal, so far.

GDX (Gold Miners ETF)
GDX broke out of a triangle formation and ran up to its highest point before giving a short-term sell signal. This has provided a potential intermediate buy signal, but it has not yet been able to reverse its short-term downtrend, and may require a few more days and slightly lower prices to do so. It has good support above 23.50 which should curtail the decline. It is also in the time-frame of its 18/20-wk cycle which is by nature irregular and approaching a record in length. But the indicators are not yet positioned for a reversal and it may take a few more days for them to be ready.
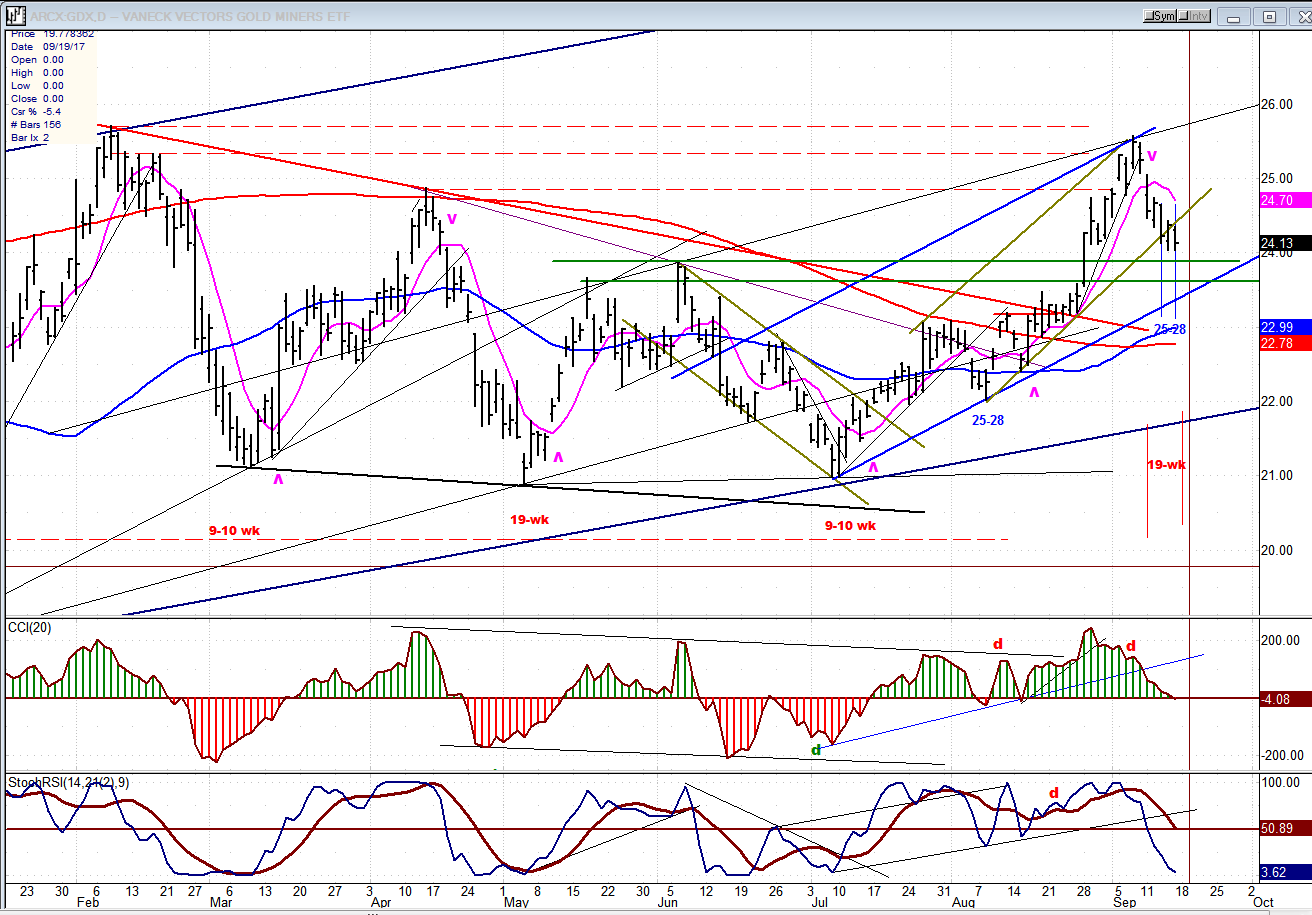
Note: GDX is now updated for subscribers throughout the day, along with SPX. Both, with their derivatives, are good trading vehicles, and you will receive detailed information on both.
USO (United States Oil Fund)
USO has finally managed to exceed its top channel line, but that does not mean that it is ready for an extended uptrend. It still faces resistance from the 233-MA just above, as well as from trend lines that can curtail its advance.

Summary
Now that the Irma-induced delay of the rally is behind us, SPX was allowed to reach its long-standing 2500 target. But will it stop there and reverse to start its descent into October/November, or will it move higher, first? There is some disagreement in what the exact P&F projection should be and we will have to wait until the market itself tells us exactly at what price level it wants to reverse.
********
For a FREE 4-week trial, send an email to [email protected], or go to (and click on) “subscribe”. There, you will also find subscription options, payment plans, weekly newsletters, and general information. By clicking on "Free Newsletter" you can get a preview of the latest newsletter which is normally posted on Sunday afternoon (unless it happens to be a 3-day weekend, in which case it could be posted on Monday).
The above comments and those made in the daily updates and the Market Summary about the financial markets are based purely on what I consider to be sound technical analysis principles. They represent my own opinion and are not meant to be construed as trading or investment advice, but are offered as an analytical point of view which might be of interest to those who follow stock market cycles and technical analysis.

When Andre Gratian was a stock broker years ago, a friend introduced him to technical analysis of the market. Consequently, it is not an exaggeration to say that Andre fell in love with this approach! Ever since then, it has become an increasingly important part of his professional life. Gratian has studied the works of Wyckoff, Edwards & Magee, Edward J. Dewey (cycles) and many others. However, one of my most profitable undertaking has probably been to study Point & Figure charting, which he finds invaluable in analyzing stocks and indices. If he were restricted to one methodology, this is the one that he would choose. This well-rounded background has given him what he feels to be a special insight into the stock market, facilitating the recognition of meaningful patterns and the ‘turning points’ in all trends, whether they be short or long term. Andre feels very comfortable discussing the stock market and passing on meaningful information to others. His subscribers include individuals and money managers throughout the world. Moreover, his Newsletters are currently published on several financial sites, here and abroad.


