Technical Analysis Of The Markets


Current Position of the Market
SPX Long-term trend: The uptrend has pushed a little higher, near-term.
SPX Intermediate trend: We may be in a position to get “something” started on the downside from around 2530-40.
Analysis of the short-term trend is done on a daily-basis with the help of hourly charts. It is an important adjunct to the analysis of daily and weekly charts which discuss longer market trends.
A Slightly Higher Count
Market Overview
The recent market action has formed a congestion pattern on the P&F chart which counts to 2530-40 which is consistent with a count taken at the 1810-1820 level, but there could be a mini-pause at Friday’s high of 2519, first. The last pause after reaching 2508 was expected to be deeper, but the recent bottoming of the 20/40-wk cycle is apparently still keeping prices in an uptrend until we have reached the more basic projection. Making what could be an intermediate high around the stated target does not necessarily mean that the SPX will immediately start a significant decline. A period of distribution may have to occur, first.
Although we appeared to be ready for one, we were not able to get a sell signal in the daily oscillator after we reached 2508. This was an indication that we wanted to go to the higher count, first. All chart indicators are concurring. Although negative divergence has appeared at all time frames from weekly to hourly, they have all failed to follow it up with a reversal.
There is a 13-wk cycle due to bottom in about a week which could warrant a pause at the 2519-20 level, with the uptrend continuing toward its final intermediate destination after the cycle has made its low.
Analysis: (These Charts and subsequent ones courtesy of QCharts.com)
Daily Chart
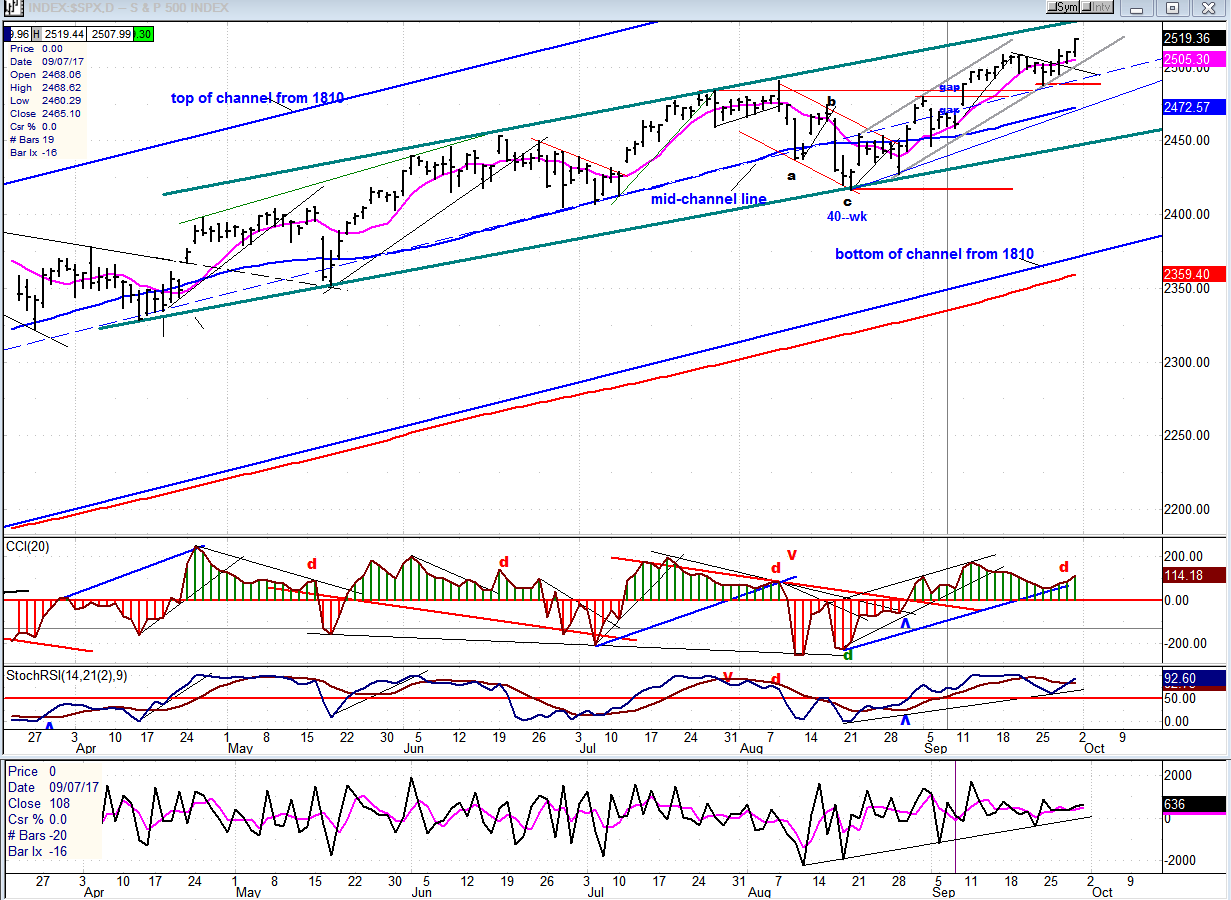
Every time I show the daily SPX chart, I mention the fact that since they started to rally, after the last important base was formed at the 1810 level, prices have settled into a trend defined by the large blue channel shown below. The channel is validated by the 233-DMA which runs along its base line, and the 55-DMA which, since the beginning of the year, has followed the path of the (dashed) mid-channel line. The bottoming of the 40-wk cycle took the index slightly below that line recently, but it immediately jumped back above and is continuing to use it as a support level. If we do get a little pull-back from Friday’s high, we may not get any weakness below the horizontal red line before continuing our journey toward the anticipated intermediate target.
If the latest upside projection is correct, we could expect a top to form at about 2530+, and we will have to wait for some distribution to accumulate in that area before we can get an accurate count for the following correction. The decline to 2083 was caused by the bottoming of the 40-wk cycle, as was the recent pull-back from the 2490 to 2417. The next 40-wk cycle is not due until next June, but other cycles bottoming over the next few weeks will probably keep the index in a downtrend until mid-January. In the meantime, we will have to see if P&F chart pattern which forms over the next few weeks keeps the index under the 2530-40 top. A break below 2490 would likely ensure that the projection level will not be surpassed.
Last week, I pointed out the similarity between the pattern currently forming in the CCI and that of August 7 which also showed negative divergence that led to an immediate sell signal. That was due to the topping of the 40-wk cycle waiting until the last minute before making its high. The anticipated top should form more gradually since the first important cycle low is not due until early December. This suggests that a fairly lengthy distribution process could first take place before we can break below 2490.
Hourly Chart
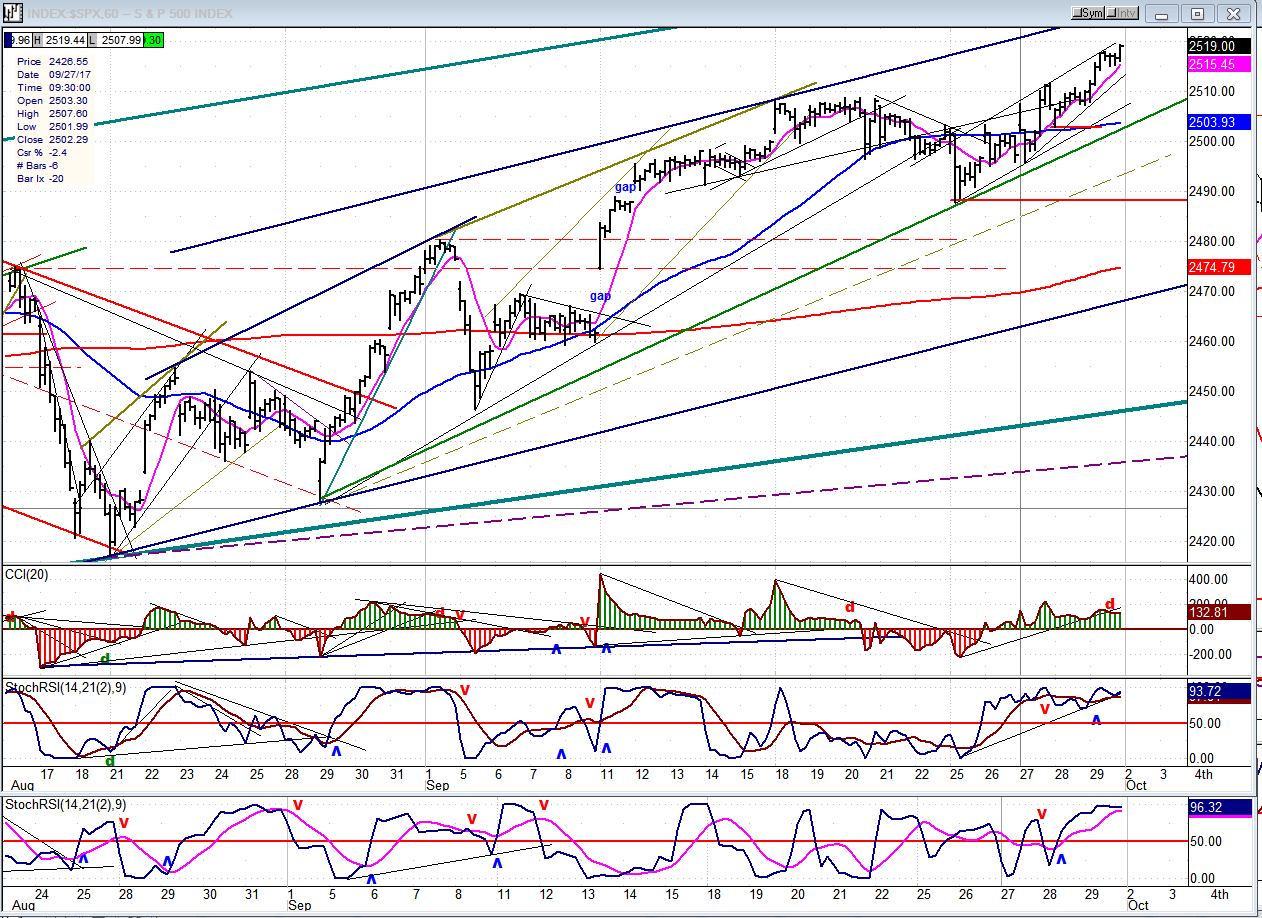
It has been less than six weeks since the 40-wk cycle made its low. It’s no wonder that we have not been able to generate an important sell signal since then! Small cycles bottoming in the interim have not had that much of an effect, and the dips recorded on the chart were primarily due to concerns generated by news over North Korea, or some other topic, which quickly dissipated.
On this chart you can also see how the 55-hr MA is dictating the trend, and has validated the more narrow channel which has contained the highs and lows during that period.
Friday’s 2519 stands a good chance of being a minor high since a partial count from the last established small base has been met, and it also coincides to the back-test of a previously broken trend line from the secondary low of 2428. The little last minute spike on Friday would also be typical of a near-term top which could arrest the advance until the 13-wk cycle has made it low, next Friday.
Even though there has been a steady uptrend since 2490, the CCI has stayed at a lower level than those reached at the last two peaks, with the divergence becoming more pronounced on Friday. The SRSI has made a double top and the A/D looks ready to roll over. I would not be surprised to see a minor correction starting as early as Monday.
An Overview Of Some Important Indexes (Daily Charts)
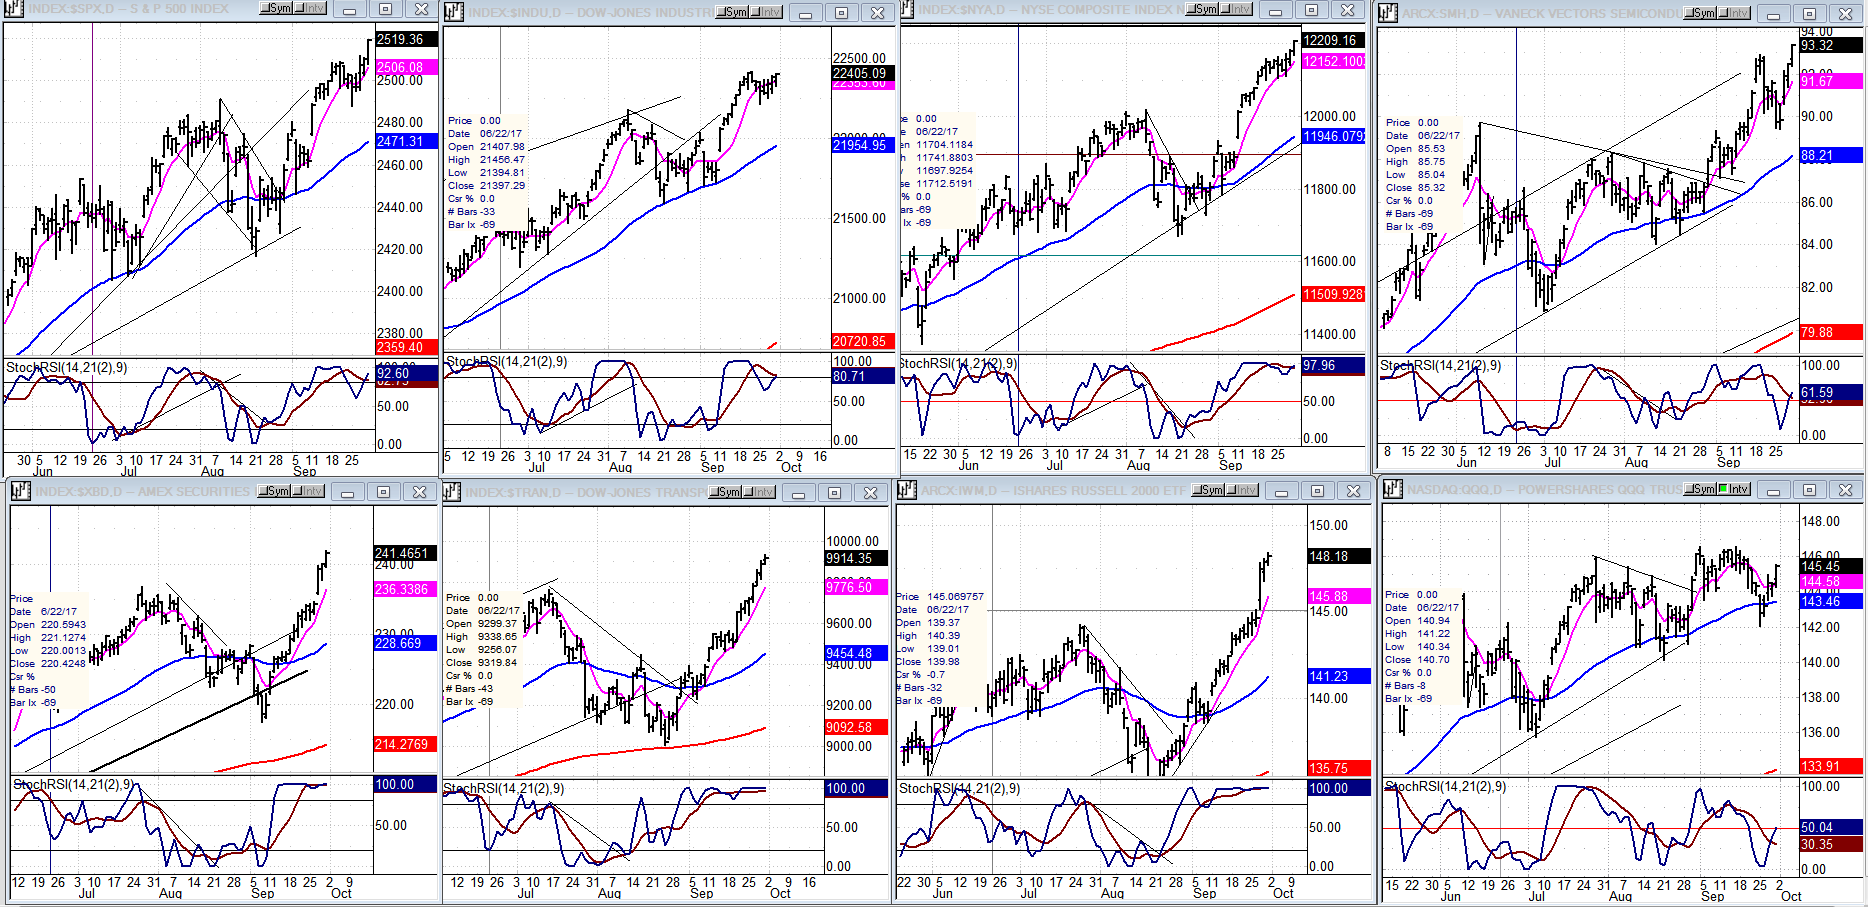
Participation in last week’s rally was widespread, with tech performance mostly responsible for lifting the SPX. The “weak” bottom tier made a strong recovery, but the refusal by the DJIA (top, second from left), and especially the QQQ, (bottom right) may be an early sign that we are reaching a fairly important top – if that underperformance continues in these two indexes over the next couple of weeks. The QQQ, especially, has undergone the greatest deceleration for over a month, compared to the other indexes.
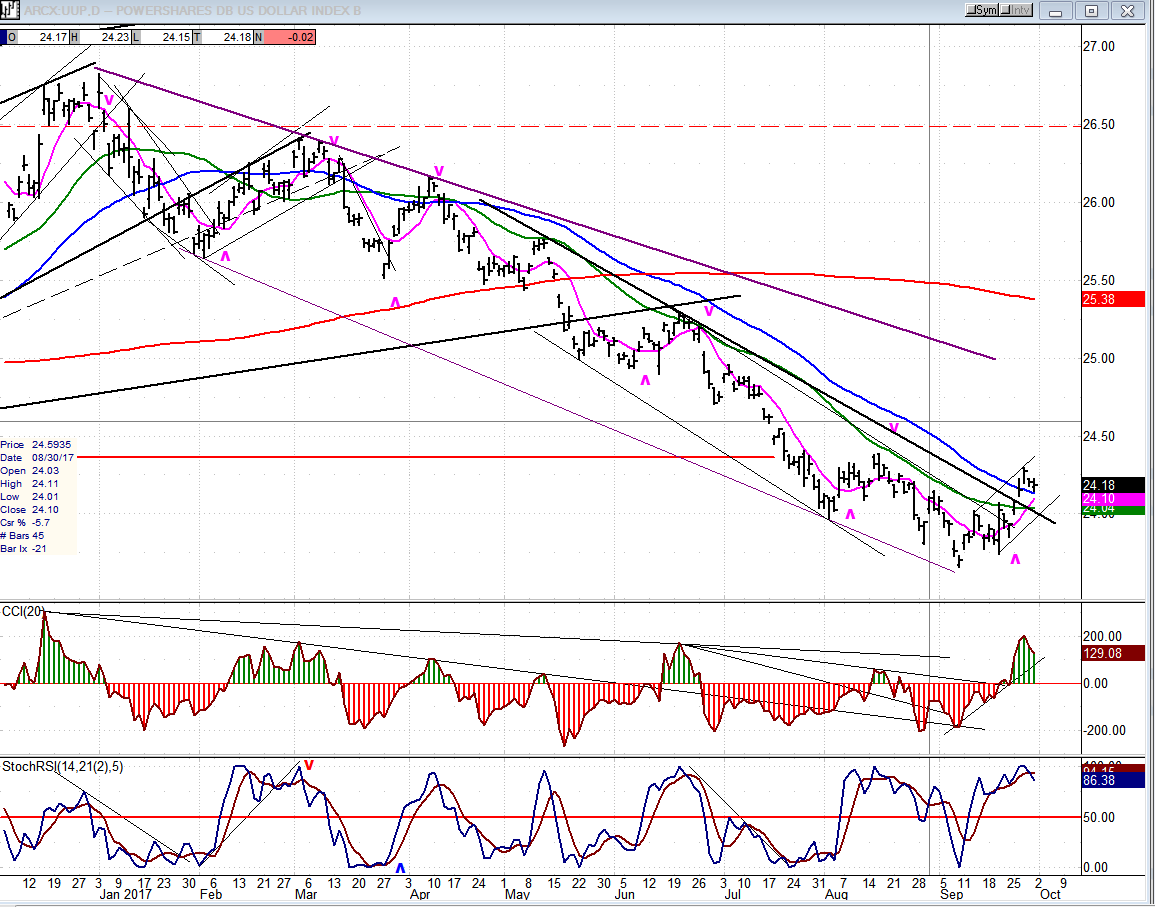
UUP (Dollar ETF)
UUP almost met its 23.50 projection before rallying, and may still do so in the near future. The last time the index experienced such weakness, it had to form an extensive base which took months to complete before it could start another significant uptrend.
GDX (Gold Miners ETF)
GDX has dropped to a support level and, with the help of a bottoming cycle, is forming a base before it is able to reverse. This reversal may have to wait until SPX has reached its final intermediate destination and is ready to undertake a significant correction. Since it has for some time steadily run against the direction of equities, the foreseen period of decline in SPX would be the best opportunity for GDX to experience a rally to new highs.

Note: GDX is now updated for subscribers throughout the day, along with SPX. Both, with their derivatives, are good trading vehicles, and you will receive detailed information on both.
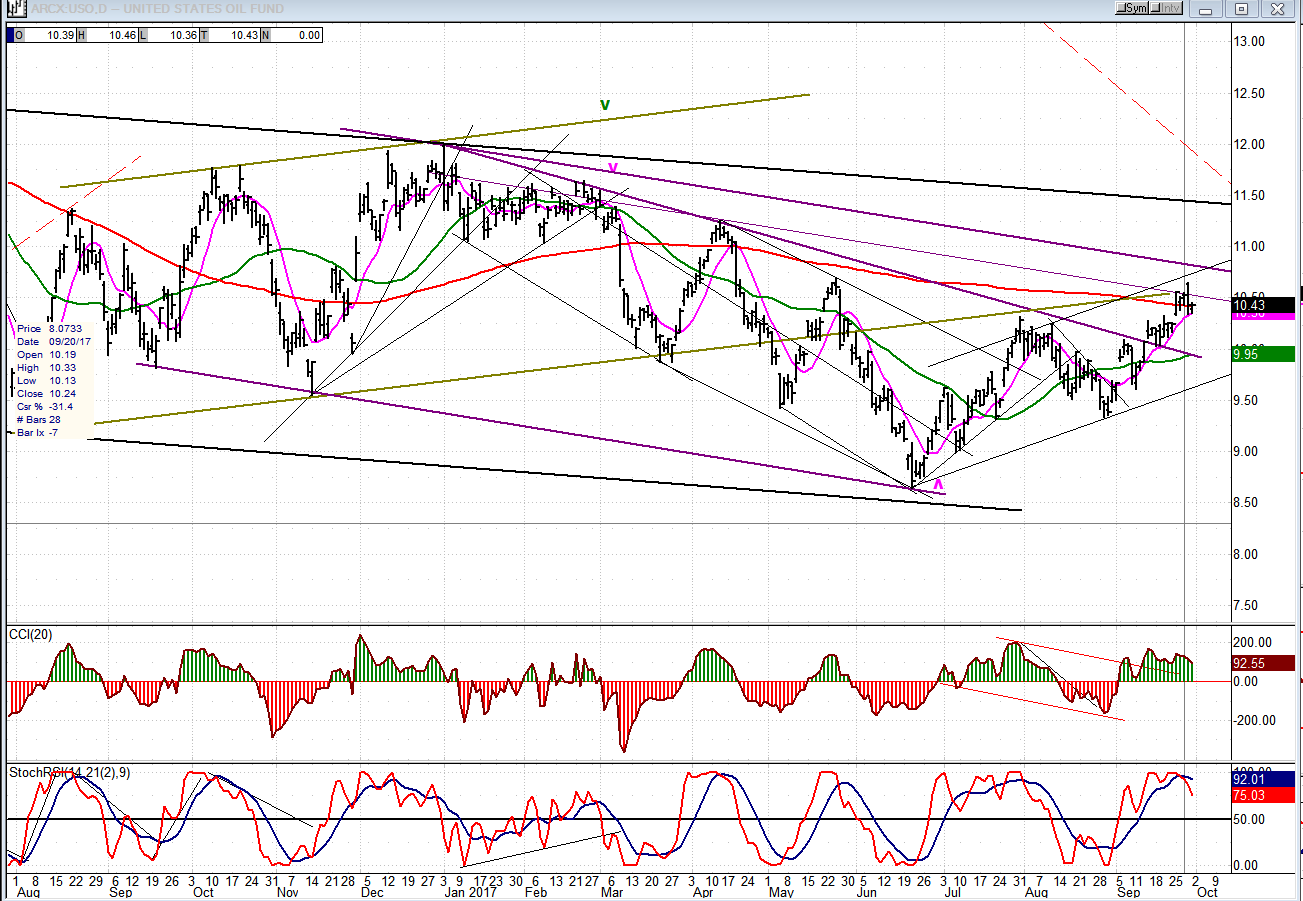
USO (United States Oil Fund)
USO has extended its move outside the secondary channel, but it is now running into strong resistance which can halt the advance and even reverse it.
Summary
Instead of starting a sizeable correction after reaching the 2500 projection, SPX created another re-consolidation pattern, and has now broken out of it on the upside. The projection target can now be raised to 2530-40 before we undertake that correction.
********
For a FREE 4-week trial, send an email to [email protected], or go to (and click on) “subscribe”. There, you will also find subscription options, payment plans, weekly newsletters, and general information. By clicking on "Free Newsletter" you can get a preview of the latest newsletter which is normally posted on Sunday afternoon (unless it happens to be a 3-day weekend, in which case it could be posted on Monday).
The above comments and those made in the daily updates and the Market Summary about the financial markets are based purely on what I consider to be sound technical analysis principles. They represent my own opinion and are not meant to be construed as trading or investment advice, but are offered as an analytical point of view which might be of interest to those who follow stock market cycles and technical analysis.

When Andre Gratian was a stock broker years ago, a friend introduced him to technical analysis of the market. Consequently, it is not an exaggeration to say that Andre fell in love with this approach! Ever since then, it has become an increasingly important part of his professional life. Gratian has studied the works of Wyckoff, Edwards & Magee, Edward J. Dewey (cycles) and many others. However, one of my most profitable undertaking has probably been to study Point & Figure charting, which he finds invaluable in analyzing stocks and indices. If he were restricted to one methodology, this is the one that he would choose. This well-rounded background has given him what he feels to be a special insight into the stock market, facilitating the recognition of meaningful patterns and the ‘turning points’ in all trends, whether they be short or long term. Andre feels very comfortable discussing the stock market and passing on meaningful information to others. His subscribers include individuals and money managers throughout the world. Moreover, his Newsletters are currently published on several financial sites, here and abroad.


