Technical Analysis Of The Markets


Current Position Of The Market
SPX: Long-term trend – The bull market is continuing with no sign of a major top in sight.
Intermediate trend – Soon coming to an end.
Analysis of the short-term trend is done on a daily basis with the help of hourly charts. It is an important adjunct to the analysis of daily and weekly charts which discusses the course of longer market trends.
Correction Phase
Market Overview
On 11/07, SPX appeared to make a short-term top at 2597.02 which was re-tested successfully the next day at 2595.47 before pulling back sharply down to the 2566 support. It was unfortunate that we did not go a little higher on the second top, since it looked as if an ending diagonal triangle was forming, and the higher high would have confirmed the “e” wave of the pattern. However, I have it on good authority (intelligentinvesting.com) that it does not matter, because the pattern still qualifies as an ending diagonal. That being the case, it is probable that the correction is not over and that lower prices will be seen before it is. That would not be surprising because there is a minor cycle due in a few days that could keep SPX moving in a southward direction until its low.
What is unclear is: do we continue our 2566-low b-wave bounce, or do we resume the downtrend as early as Monday. On Friday, corrective action formed a small base on the P&F chart which could take us to a new recovery high before the start of the c-wave. Guess we’ll just have to wait until Monday to find out.
Generally speaking, the market is getting closer and closer to an intermediate top – about another month would be my guesstimate – which would give us the first significant correction in some time. In a strong bull market, it takes a while before we have the right conditions, and these are fast approaching. The 40-wk cycle, which is responsible for the nearly straight-up trend which started in mid-August, is beginning to lose some of its mojo and that will make the index vulnerable to the cluster of important cycles bottoming in December and January. So, the bears should soon be able to breathe normally again, at least for a little while!
Chart Analysis (These charts and subsequent ones courtesy of QCharts)
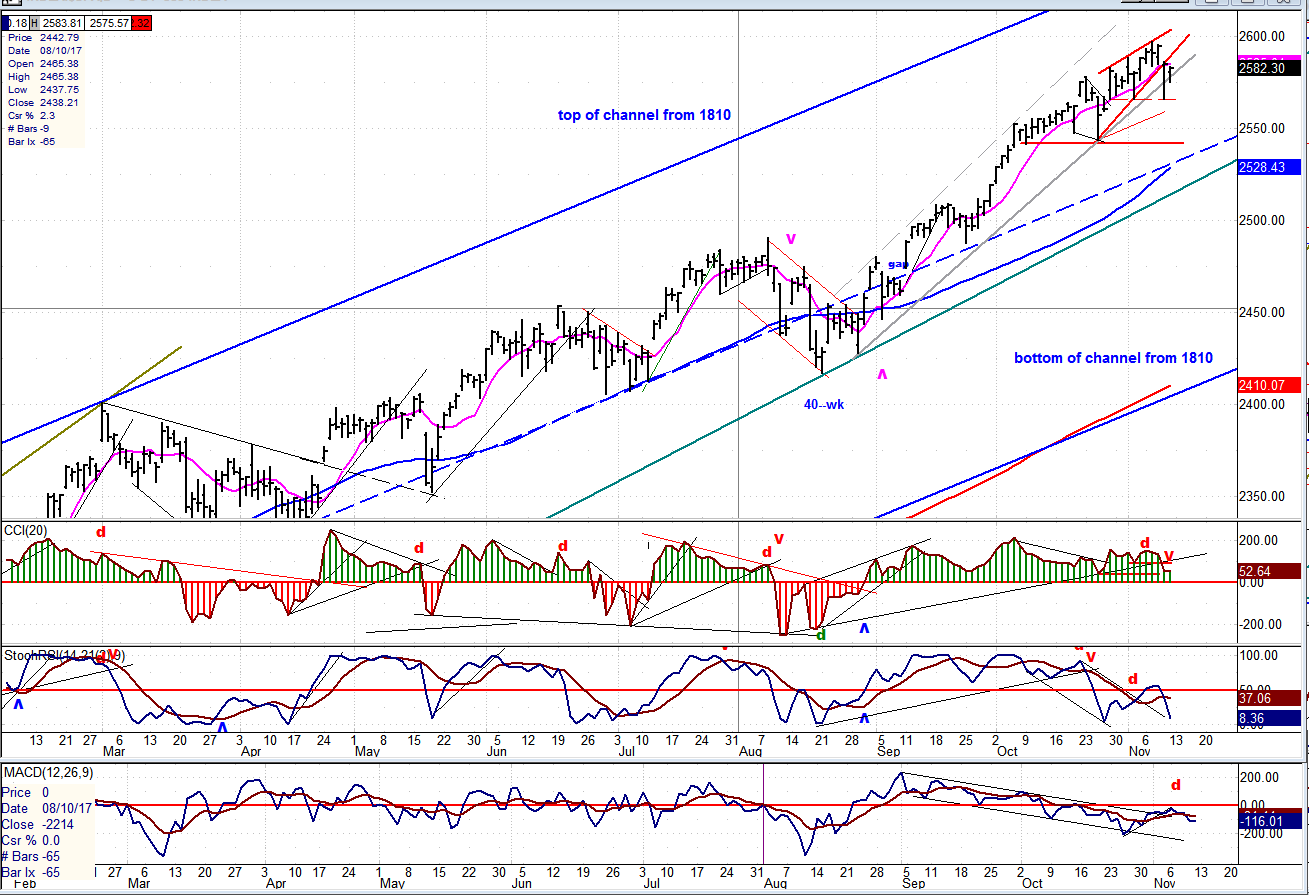
SPX Daily chart:
As noted on the chart, the blue channel delineates the bull market leg which started at 1810, in February 2016. I mentioned a couple of months ago how remarkable it was that the 233-DMA was tracing out the bottom of the channel, and the 55-DMA its mid-channel line. As you can see, this has continued in the same vein. But not for very much longer! We are about to have a correction that will dramatically alter this near-perfect relationship. I don’t yet have a measurement for the expected intermediate correction because, with the action of the last couple of weeks, the distribution top has just begun to form. You can see on chart that the price action is beginning to become congested, and this should increase as we continue to correct and make the final top in the next few weeks. Once that topping formation is complete, the P&F chart should give us a good count of what to expect.
The upward slanted red trend lines outline the ending diagonal triangle which has been forming. As you can see, the break of the bottom trend line was fast and sharp, and it immediately reversed on the same day that it broke from the first support level at 2566, giving the appearance that the correction was over. But it’s probably not! For one thing, diagonals tend to retrace their entire length to the point where they originated; in this case it would be to the heavy red horizontal line at 2544. Secondly, the cycle which is responsible for this correction (there is always one behind every correction) is not due to bottom for another few days. That gives us something on which to fix our “expectations”, with the caveat that the market does not always do what we expect!
As additional proof that we may be correct, the oscillators at the bottom of the chart have all reversed in patterns which are still weakening, and with no trace of reversing despite the two-day hold in the market. When they reverse, it should signal that the correction is over and that we are probably on our final short leg of this advance.
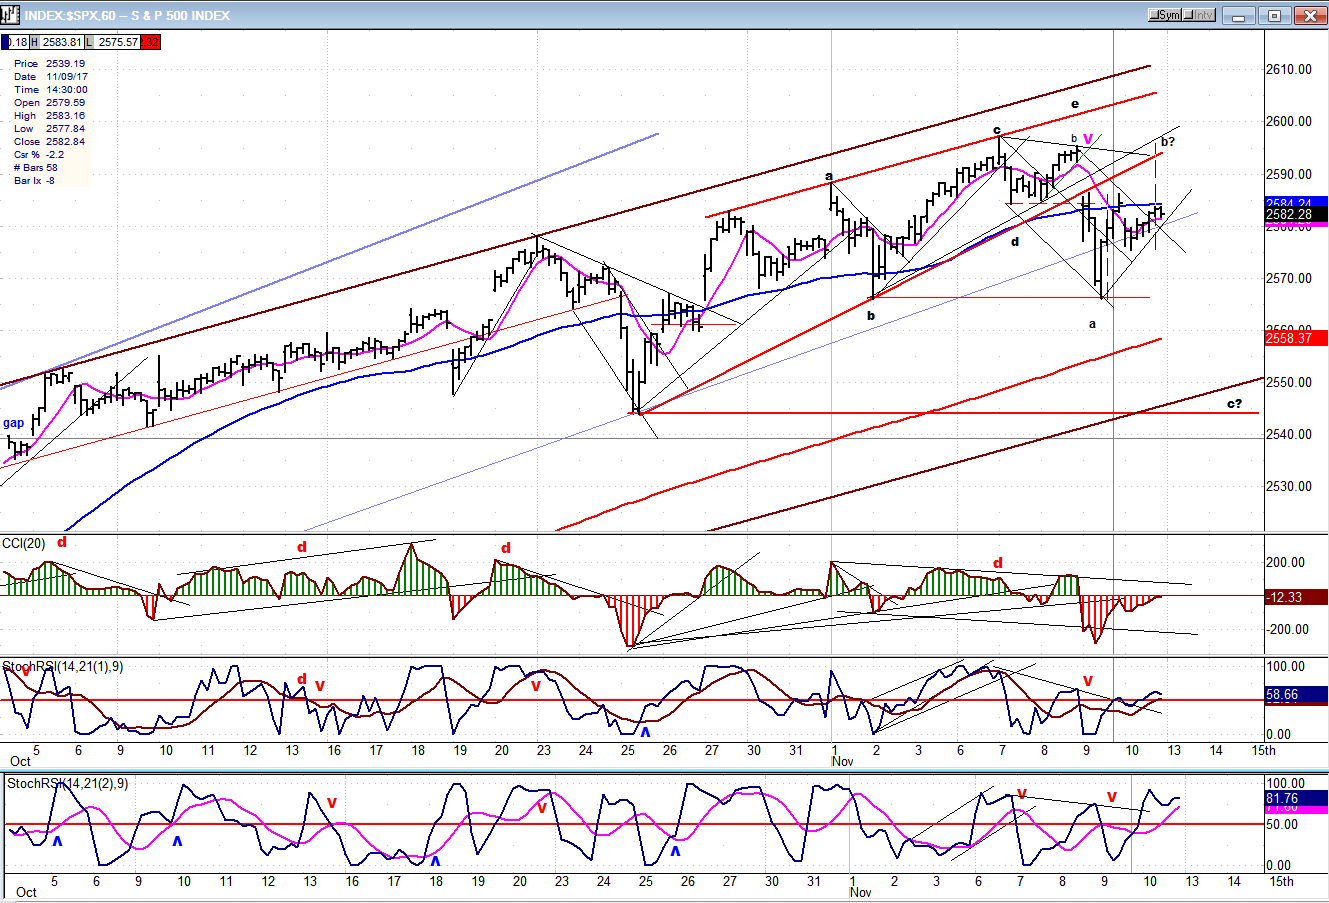
SPX Hourly Chart
Under the magnifying glass effect of the hourly chart, you can see the ending diagonal triangle, and how it broke suddenly when complete – well, almost complete, since we did not make a new high but had to be satisfied with a truncated wave “e”. In any case, it should not change the normal behavior of an EDT correction. The start of the correction was normal: a sudden break of 29 points, followed by a bounce of 20 points (all on the same day) before things started to settle down.
On Friday, we pulled back and did some basing which has a potential of taking us up to about 2495, before coming to the second down phase of the correction. Since a move to 2495 would give us a second bounce equal in length to the first, thereby creating a measured move, the odds are pretty good that this is what we will be doing before continuing the correction. The hourly oscillators tend to support this view, since the two lower ones have already gone positive, and the higher one is already at the zero line. But we’ll need some confirmation which should come as early as Monday morning.
An Overview Of Some Important Indexes (Daily Charts)
Last week I mentioned that IWM and TRAN had begun to assume the roles of market leaders. It is therefore no surprise that we are seeing a market correction take hold. For the first time in a while, all the indices are pulling back from their highs in concert, although, to be sure, the degree varies greatly from the two leaders. Nevertheless, this is telling us that, over the short to intermediate term, the bulls will no longer be on easy street.

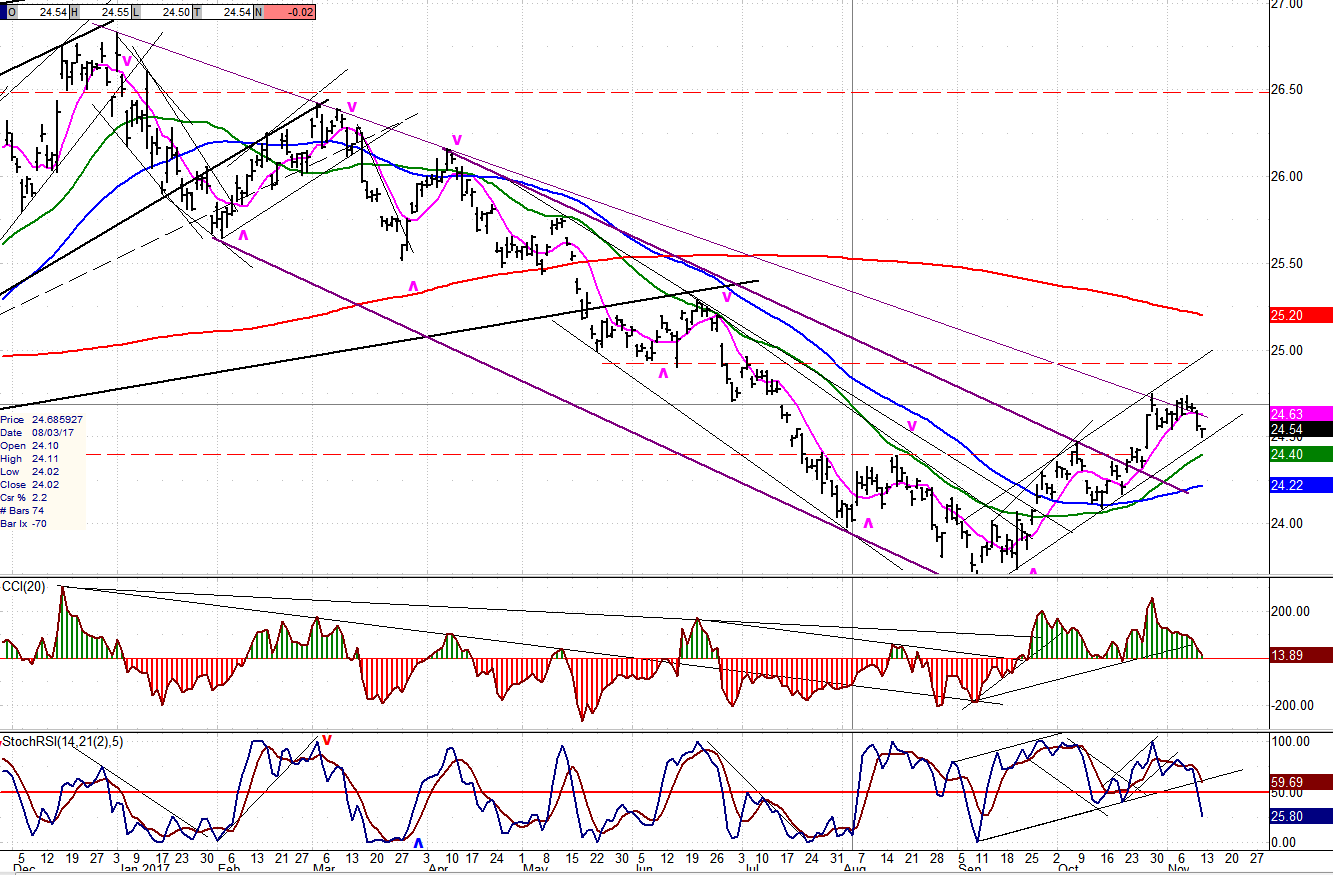
UUP (Dollar ETF)
UUP is consolidating its recent gain and is still expected to move higher over the near term. This could change if it starts to trade below the horizontal dashed line.
GDX (ETF For Gold)
GDX has concluded its rally in a downtrend which was fostered by the 6-wk cycle low. It is succumbing, once again, to the louder sirens of the larger cycles due toward the end of the year. While there could be some holding in this area, new lows are likely over the next few weeks.

USO (United States Oil Fund)
USO has now risen to the level of the resistance lines drawn on the chart, and will not find it so easy to continue its uninterrupted rise from the secondary test of its low. Although the daily indicators appear ready to correct, the weeklies suggest that no real weakness is anticipated, and more strength could push the index to the former high of 12.00. If, after some consolidation takes place between 11 and 12, USO is able to get to 12.50 or 13.00, it could be ready to move into the higher teens or even low 20s – over the longer term.

Summary
The current correction in SPX is likely to continue a little longer and deeper. It is also expected to be the last one before an intermediate top is struck.
*********
FREE TRIAL SUBSCRIPTON
Market Turning Points is an uncommonly dependable, reasonably priced service providing intra-day market updates, explanations, and commentary, plus detailed weekend reports. It is ideally suited to traders, but it can also be valuable to longer-term holders since price projections are provided using Point & Figure analysis along with best-time estimates obtained from cycle analysis.
For a FREE 4-week trial, Send an email to: [email protected]
For further subscription options, payment plans, and for general information, I encourage you to visit my website at www.marketurningpoints.com.
The above comments about the financial markets are based purely on what I consider to be sound technical analysis principles. They represent my own opinion and are not meant to be construed as trading or investment advice, but are offered as an analytical point of view which might be of interest to those who follow stock market cycles and technical analysis.

When Andre Gratian was a stock broker years ago, a friend introduced him to technical analysis of the market. Consequently, it is not an exaggeration to say that Andre fell in love with this approach! Ever since then, it has become an increasingly important part of his professional life. Gratian has studied the works of Wyckoff, Edwards & Magee, Edward J. Dewey (cycles) and many others. However, one of my most profitable undertaking has probably been to study Point & Figure charting, which he finds invaluable in analyzing stocks and indices. If he were restricted to one methodology, this is the one that he would choose. This well-rounded background has given him what he feels to be a special insight into the stock market, facilitating the recognition of meaningful patterns and the ‘turning points’ in all trends, whether they be short or long term. Andre feels very comfortable discussing the stock market and passing on meaningful information to others. His subscribers include individuals and money managers throughout the world. Moreover, his Newsletters are currently published on several financial sites, here and abroad.


