Technical Analysis Of The Markets


Current position of the market
SPX: Long-Term trend – The bull market is continuing with no sign of a major top in sight.
Intermediate-Trend – Soon coming to an end.
Analysis of the short-term trend is done on a daily basis with the help of hourly charts. It is an important adjunct to the analysis of daily and weekly charts which discusses the course of longer market trends.
More Correction Ahead?
Market Overview
Cycles and structure are fundamental to price progression in the stock market. With the 6/7-year cycle making its low in January 2016, the SPX is still in a long-term uptrend. In addition, the 9-yr cycle bottomed in the fall of 2011 and its half-span, the 4.5-yr cycle, also bottomed in January 2016. Knowing this, we can understand why the index has remained so strong. However, some intermediate cycles will soon cause the trend to turn down in what will probably be the best correction since the 1810 low.
Structure is an important adjunct to cycles, and the two are highly synchronized. Therefore, if a noteworthy, cycle-induced reversal is about to take place, it should not be surprising that a fairly important wave structure is about to be completed. Although we cannot say precisely to the day when the reversal will take place, we can say with a certain amount of confidence that an intermediate reversal should take place relatively soon, probably in two to three weeks. Being aware of this, we should be able to pin-point a more exact date with technical indicators, and by the sudden shift in market mood.
Ideally, the correction from 2597 should continue a little longer, and it should be followed by a final rally which may or may not exceed the previous high -- although getting to 2600 or slightly above would be ideal. Note that I used the word “ideal” twice in this paragraph! Market tops can be tricky
Chart Analysis (These charts and subsequent ones courtesy of QCharts)
SPX Daily chart:
You can see that, over the last couple of weeks, it has not been all buying! Some profit-taking has taken place, but not enough selling to cause the trend to reverse, just yet. Buying off the dips is still taking place, and this sends prices right back up. This is the normal process of distribution which occurs at the top of a trend before supply overcomes demand and the trend is reversed. It is best seen on a Point & Figure chart, and the larger the pattern, the more important the following decline will be. Naturally, one has to distinguish between the activity at a genuine top formation and that of accumulation which precedes an extension of the trend. This is why it is important to know where we are in the market structure, and what cycles will be bottoming just ahead of us.
In addition to our expectation that an important change of trend is about to take place, once the top-building process is complete and we have reversed, we have tools to estimate how deep the correction will be. We can use the P&F chart pattern that has been created to take a “count” across the formation. This will give us a good idea of the extent of the coming decline. It is also possible to take the same measurement by using Fibonacci ratios, based on EWT methodology. But this is slightly beyond my area of expertise, and I leave it to EWT experts to come up with the right prognosis.
As a warning that we are approaching the expected reversal point, the top momentum oscillator (CCI) has gone negative for the first time since the August low (which was caused by the bottoming of the 40-wk cycle). As the trend reverses and the correction begins, it should increase its negativity and remain in the red zone for a period of time, until the correction is complete.

SPX Hourly Chart:
The correction, which started at 1297 on 11/07, appeared to come to an end last Wednesday when a weak opening broke the 2567 level which had served as support on two previous occasions, causing SPX to decline 10 points lower. However, a rebound immediately took place and brought prices back above the support level. After a few hours of consolidation, Thursday saw prices rise sharply above the top of the corrective channel, strongly suggesting that the correction was over by stopping only 7 points below the previous high. As expected, Friday dipped at the opening into the low of a minor cycle but, although the A/Ds confirmed the cycle low by rising from -600 to 1000, prices remained stagnant, and after trading in a narrow range for most of the day, they dipped below the cycle low by the close. This causes us to question if the correction is really over!
The cycle may have failed because a higher degree cycle whose low is due in a week is already exerting downward pressure on prices. If that’s the case, a decline may already have started to retest the recent low and perhaps even go below. On the other hand, the end of the day weakness may simply have been cautious selling ahead of the weekend. We’ll know more on Monday.
All three oscillators pretty much followed the contour of prices and ended neutral. If they go negative on Monday morning, we may be looking at another down-phase of the corrective move from 1297.

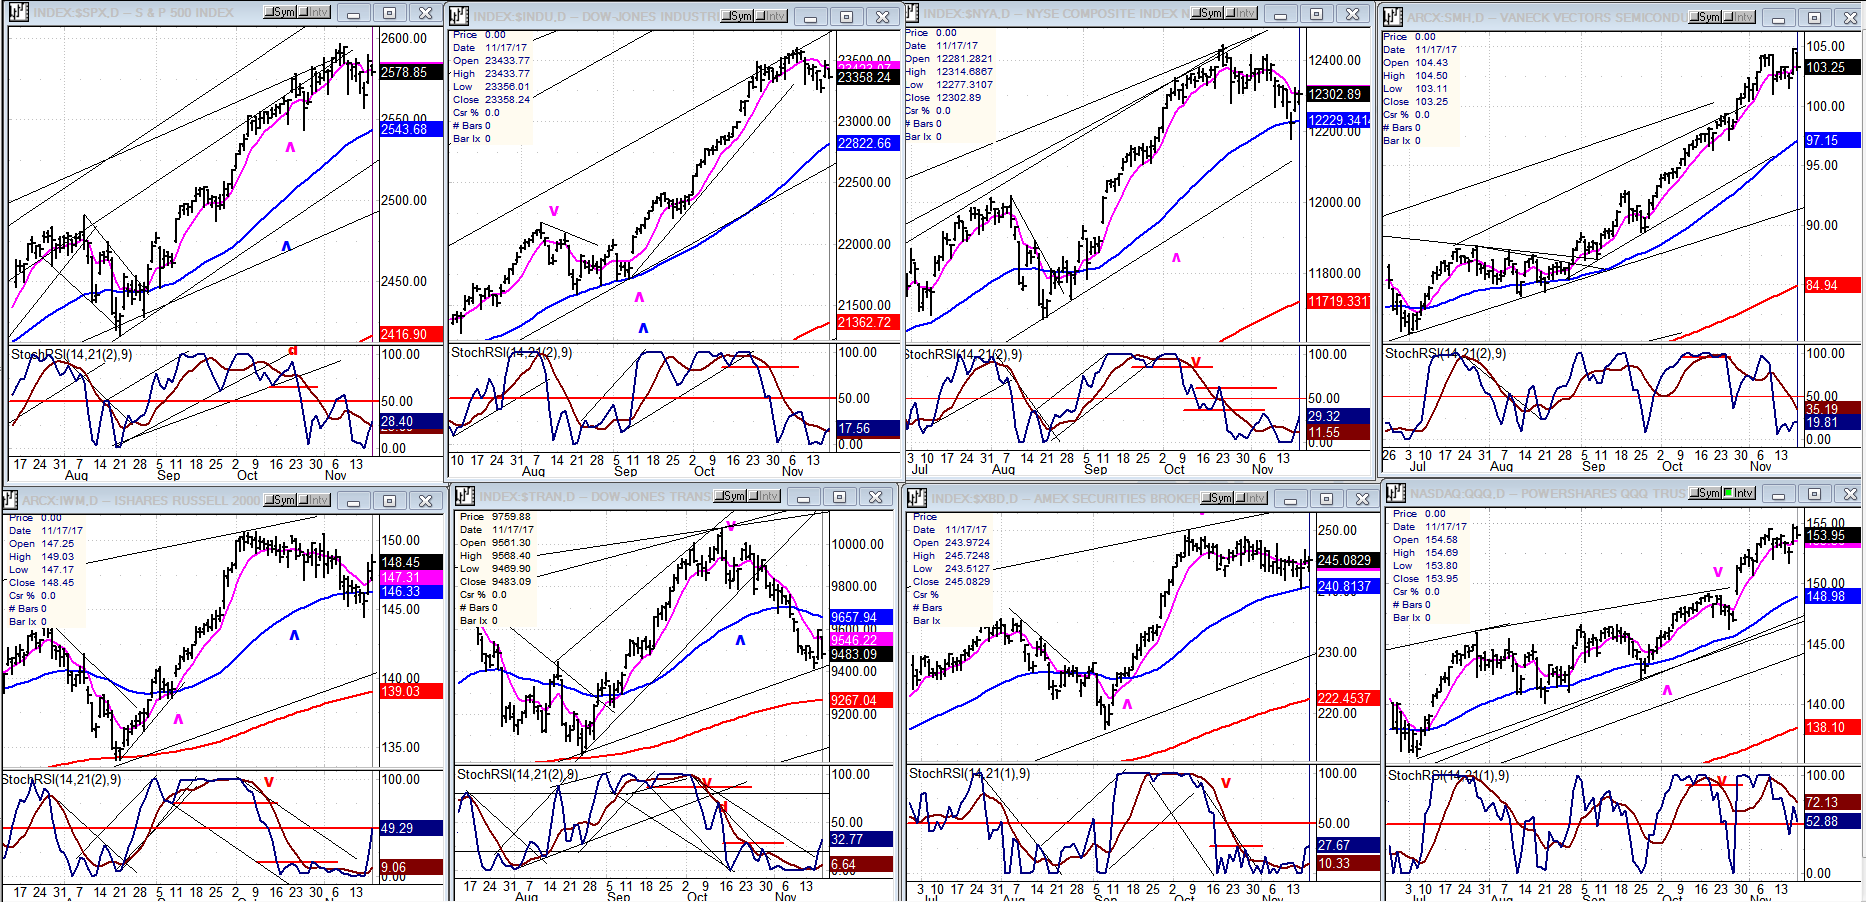
An Overview Of Some Important Indexes (Daily Charts)
Now that the indices have somewhat stabilized from their initial spell of weakness, we can plainly see the ones that were the most affected. The two standouts are TRAN (second bottom) and NYA (third top). The tech sector was the least affected and contributed to the strength in the SPX recovery. That index will likely not begin a strong correction until the tech sector is ready for it.
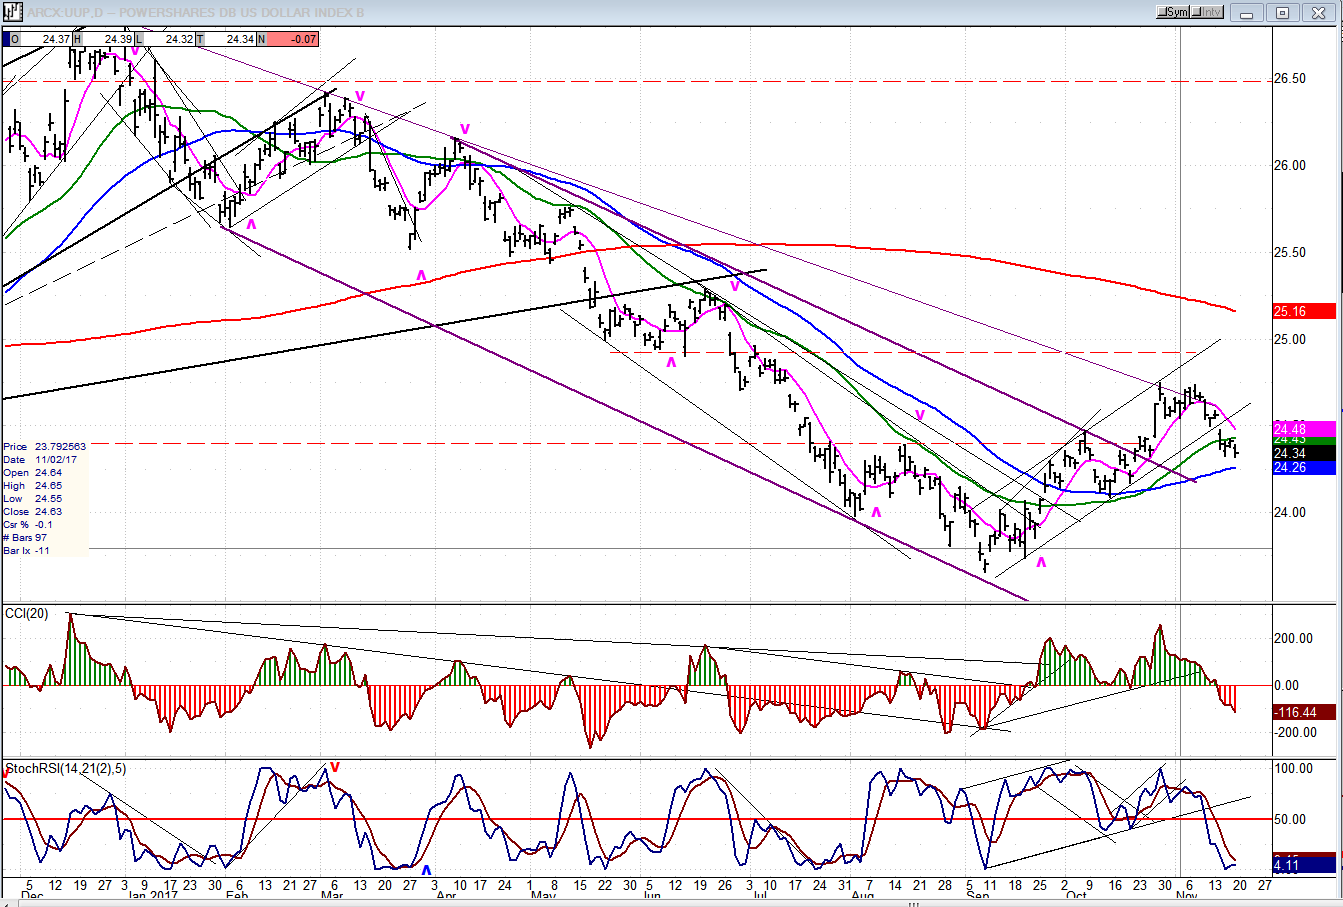
UUP (Dollar ETF)
UUP is consolidating its recent uptrend. It will turn into something more if it drops below the blue 55-DMA.
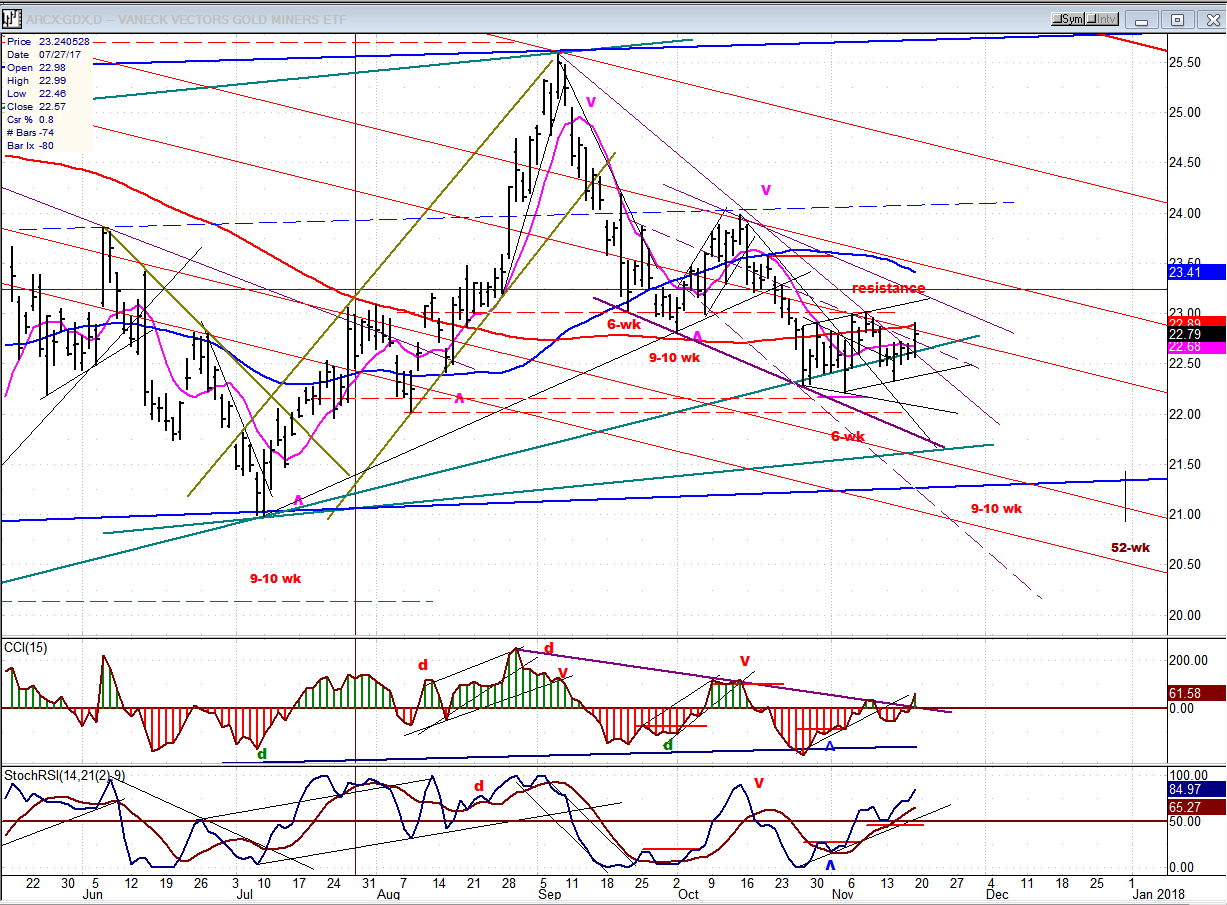
GDX (Gold Miners ETF)
The bottoming of the 6-wk cycle only served to keep GDX in the tight, slanted trading range of the past month. While there was a seeming breakout of the downtrend line on Friday -- confirmed by the top indicator (CCI) which turned positive -- one cannot expect too much strength to ensue due to the larger cycles that still lie ahead. Targeting the top of the slanted channel which has been built around the green support line would be a reasonable expectation,
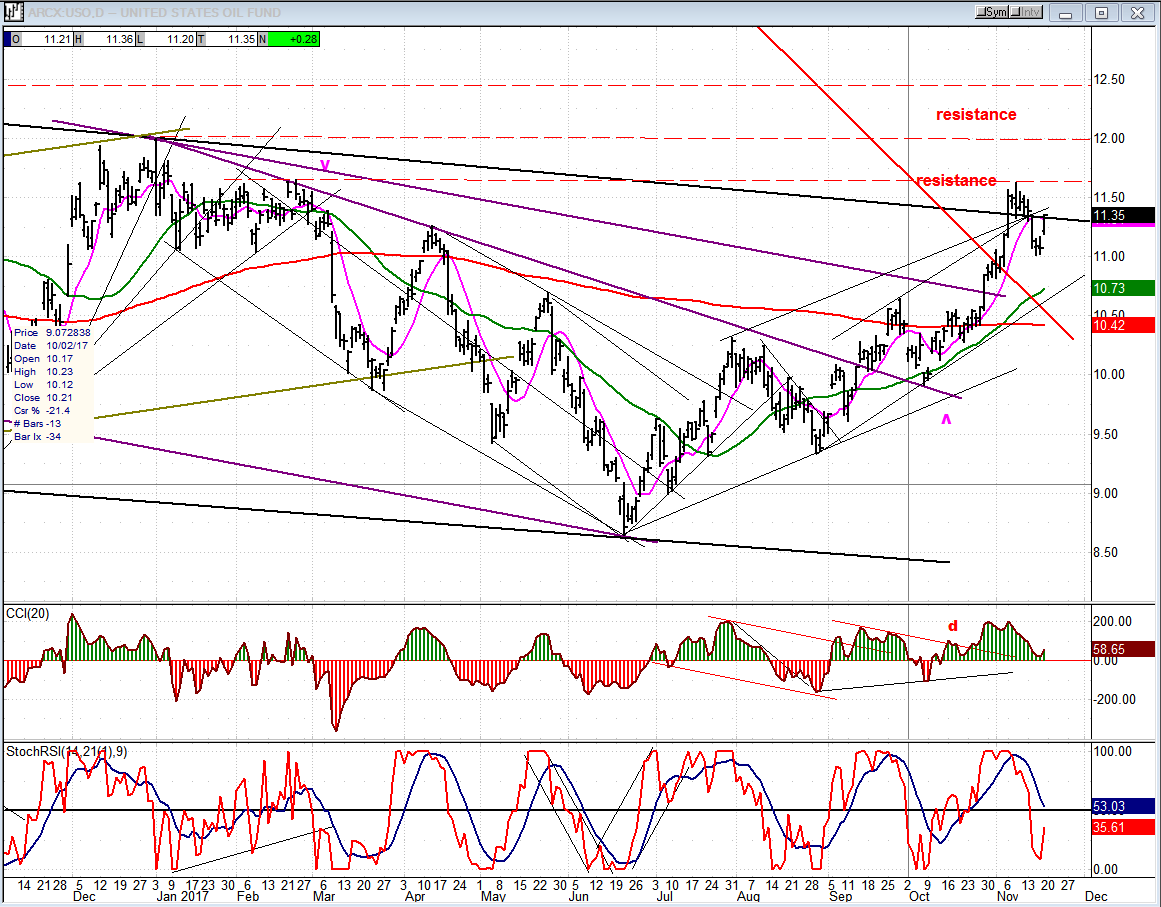
USO (United States Oil Fund)
USO met with resistance where expected. Some consolidation at this level would be normal, but if it tries to extend its gains right away, more resistance lies immediately ahead.
Summary
It is unclear if SPX has concluded its correction from the 2597 level and is now ready for the final up-phase of the rally. A fairly important – but still minor – cycle low is only a week away and this could extend the correction.
*********
FREE TRIAL SUBSCRIPTON
Market Turning Points is an uncommonly dependable, reasonably priced service providing intra-day market updates, explanations, and commentary, plus detailed weekend reports. It is ideally suited to traders, but it can also be valuable to longer-term holders since price projections are provided using Point & Figure analysis along with best-time estimates obtained from cycle analysis.
For a FREE 4-week trial, Send an email to: [email protected]
For further subscription options, payment plans, and for general information, I encourage you to visit my website at www.marketurningpoints.com.
The above comments about the financial markets are based purely on what I consider to be sound technical analysis principles. They represent my own opinion and are not meant to be construed as trading or investment advice, but are offered as an analytical point of view which might be of interest to those who follow stock market cycles and technical analysis.

When Andre Gratian was a stock broker years ago, a friend introduced him to technical analysis of the market. Consequently, it is not an exaggeration to say that Andre fell in love with this approach! Ever since then, it has become an increasingly important part of his professional life. Gratian has studied the works of Wyckoff, Edwards & Magee, Edward J. Dewey (cycles) and many others. However, one of my most profitable undertaking has probably been to study Point & Figure charting, which he finds invaluable in analyzing stocks and indices. If he were restricted to one methodology, this is the one that he would choose. This well-rounded background has given him what he feels to be a special insight into the stock market, facilitating the recognition of meaningful patterns and the ‘turning points’ in all trends, whether they be short or long term. Andre feels very comfortable discussing the stock market and passing on meaningful information to others. His subscribers include individuals and money managers throughout the world. Moreover, his Newsletters are currently published on several financial sites, here and abroad.


