Technical Analysis Of The Markets


Gold

Short-Term Update:
The small bullish triangle that we thought was developing on the Intraday Chart has been eliminated in the overnight session. However, the new trading patterns on the Intraday Chart may suggest that gold still have some further upside above the 1097.20 high.
The challenge we have with being very bullish on gold at the moment, is that GDX and other related gold stocks have patterns that suggest lower prices, which can likely only happen if gold heads back to the 1045.80 low.
The USDX may now being breaking higher out of its wave .iv. triangle, which will also likely pressure gold to head lower.
In the overnight session had a range between a high of 1094.30 and 1082.50, at the time that this Post started being written. At the moment we are lot closer to the 1082.50 low! Longer term, all of our current Options remain valid, and are described in detail below:
Option 1: Wave .b. is now complete at the 1112.20 high:
In this option wave .a. of would have had to end as failure at 1046.80, as shown on the attached Daily Gold Chart and our count for wave .b. is:
*a* = 1081.40;
*b* = 1056.50;
*c* = 1113.10.
We are now heading lower in wave .c. to at least the 1045.40 low to complete all of wave .c. of -v- of (c). This option is now our preferred as the drop in gold is starting to accelerate, although we do NOT have a clear impulsive sequence from the 1113.10 high.
This option will be eliminated if we now rally above the 1112.20 high.
Option 2: A major low in gold has occurred at 1146.80 in wave 4 or wave ii of 3:
In this option are would be working on a series of bullish subdividing impulsive wave sequences as follows::
*i* = 1081.40;
*ii* = 1056.50;
*iii*:
^i^ = 1112.20
^ii^ = 1071.10, if complete.
^iii^ rally will be next.
Retracements for the end of wave ^ii^ are:
61.8% = 1077.80;
78.6% = 1068.40.
A drop below the 78.6% retracement level would eliminate this option.
A sharp rally now above the 1112.20 high, would support this outcome.
Option 3: Wave .b. is still underway but is becoming more complex:
We had assumed that wave .b. was going to become a simple *a*, *b*, *c* rally, but in this Option something more complex is now happening white which will include a series of *a*, *b*, *c* patterns.
This option is the most difficult to identify in real time. We need a rally above the 1112.20 high to keep this option alive. As we noted above, the overlapping wave structure on the drop from 1112.20 to the current low of 1071.10, might be suggesting this outcome.
Long-Term Update:
Wave .b. is now complete at the 1112.20 high and we should now be heading lower in wave .c. to complete a major low in gold, in either wave 4 or wave ii of 3.
There is an outside chance that all of wave 4 or wave ii of 3 is complete at the 1045.40 low also. A break above the upper red down trend line connecting waves -ii- and -iv-, as shown on the attached Daily Gold Chart would confirm that wave 4 or wave ii of 3 ended at 1045.40.
Active Trading Positions: Long 20 positions, with protective put options at 1085.00!
Crude
Short-Term Update:
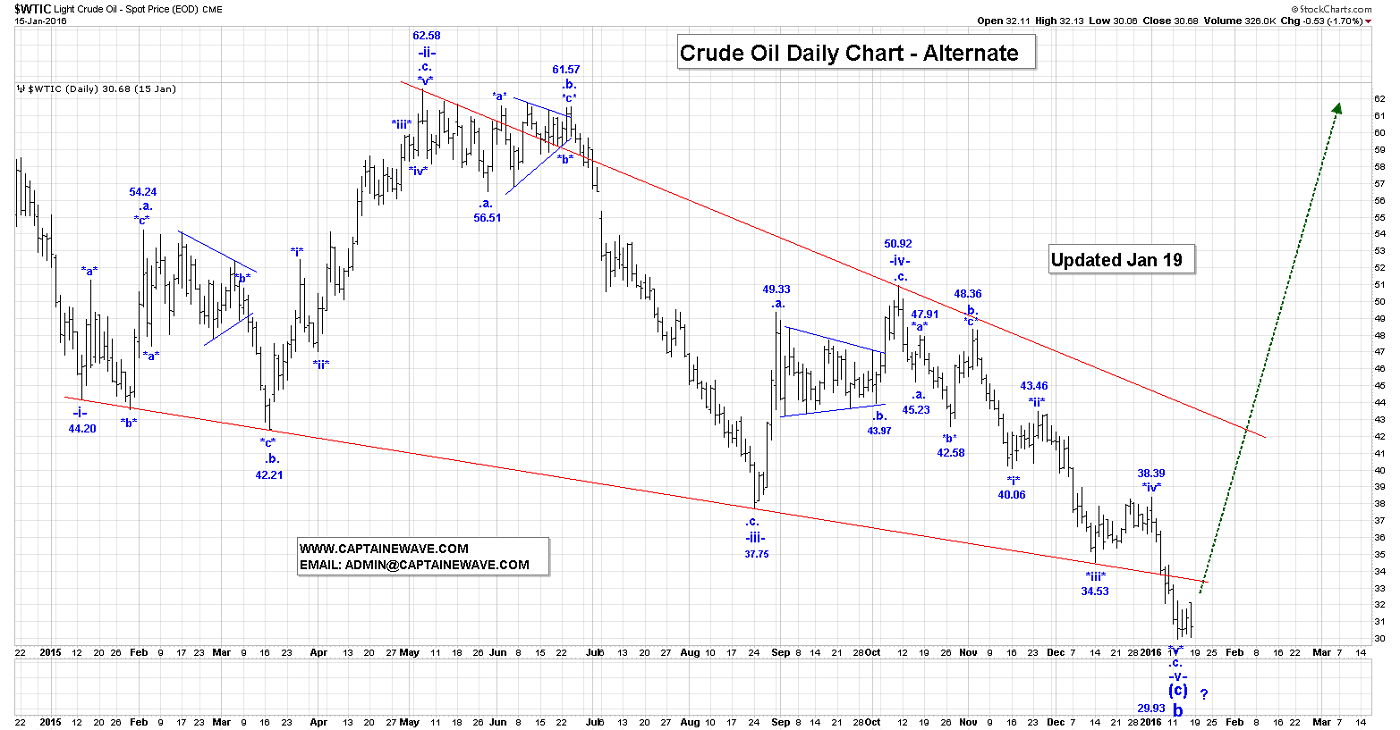
Crude was higher in the overnight session, with the February front month contract reaching 30.21. On the Intraday Chart the rally from 28.36 to the current high of 30.21 does NOT appear impulsive, at the moment, so we suspect that lower prices are still coming for this market.
In fact, on the more actively traded March Chart, it is possible to see a bearish triangle formation developing. If that observation is correct, then once this triangle ends we should expect a thrust lower to at least the 28.36 low.
This thrust down might be the final low in crude.
We expect sideways trading for most of today, as this triangle formation continues to develop. On the March Chart, if we break above the 32.19 high, then this triangle formation will be eliminated and something more bullish might finally be happening in this market.
Long-Term Update:
If our current analysis is correct a major low in wave b of B is at hand and crude is starting a new run back to the $150 area.
Active Trading Positions: Long 15 positions, with 42.00 puts, as stops, plus long 5 positions with 37.00 puts, as stops!
S&P500
Short-Term Update:
The S&P500 Futures market was sharply higher in the overnight session, being up about 27 points, at the time that this Post was being written. As we pointed out in yesterday’s Morning Post we have a lot of confusion in this market from an Ewaves point of view.
On the S&P Daily Continuous Chart we still have a valid wave (iv) triangle formation as follows:
-a-= 1815.25;
-b- = 2134.00;
-c- = 1831.00;
-d- = 2110.25;
-e- = 1849.25, if complete.
Until the wave -c- low is challenged at 1831.00, the above triangle formation will remain valid, and we know could he heading higher in wave (v).
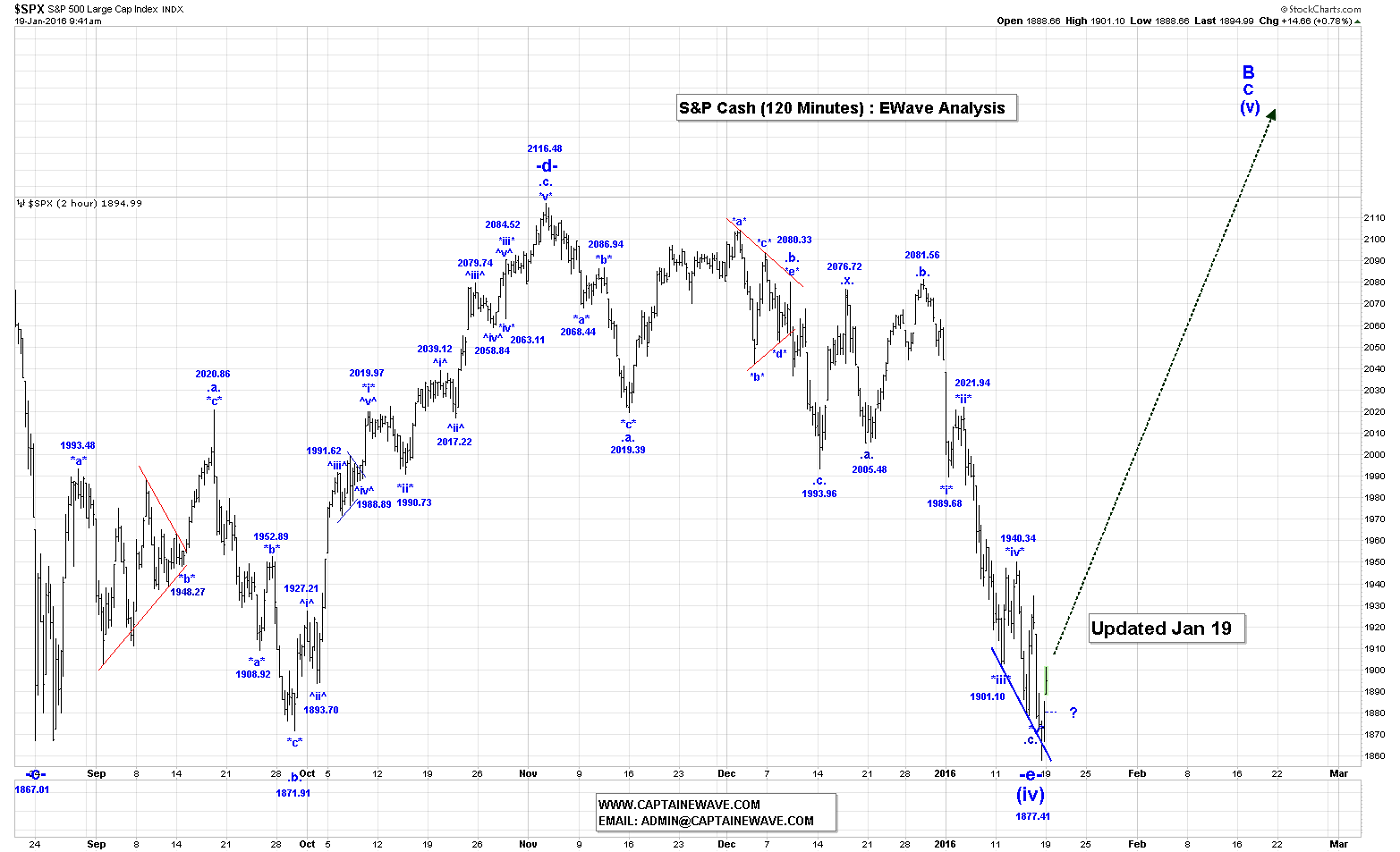
On the S&P Daily Cash Chart, our wave (iv) triangle has been eliminated and we now have the following options to consider:
Option 1: Our wave (iv) triangle is expanding and only wave -c- ended at 1057.83:
In this case our triangle is expanding, and as long as we stay above the wave -a- low of 1820.66, then this option will remain valid. If this option is correct then we would now expect that the S&P will start to rally in a complex wave -d- pattern that will be full of overlapping waves.
This option also indicates that the S&P will be range bound for most of 2106, as waves -d- and -e- of our wave (iv) triangle unfold.
Option 2: All of wave B ended at 2134.72 or 2116.48:
Our major top in the S&P is in at either 2134.72 or 2116.48. From an Ewaves analysis point of view we are not sure how this option would be valid, unless we base our analysis on a bunch of failed market tops.
We’re not yet sure which Option will win the day and what is the S&P Futures Chart telling us also.
In the short term, however, we should at least see a rather large relief rally due to the aggressive selling since the start of 2016.
We may choose to take profits on our long positions, as we see what type of wave patterns this expected rally develops into. For the time being our preferred is now Option 1.
Long-Term Update:
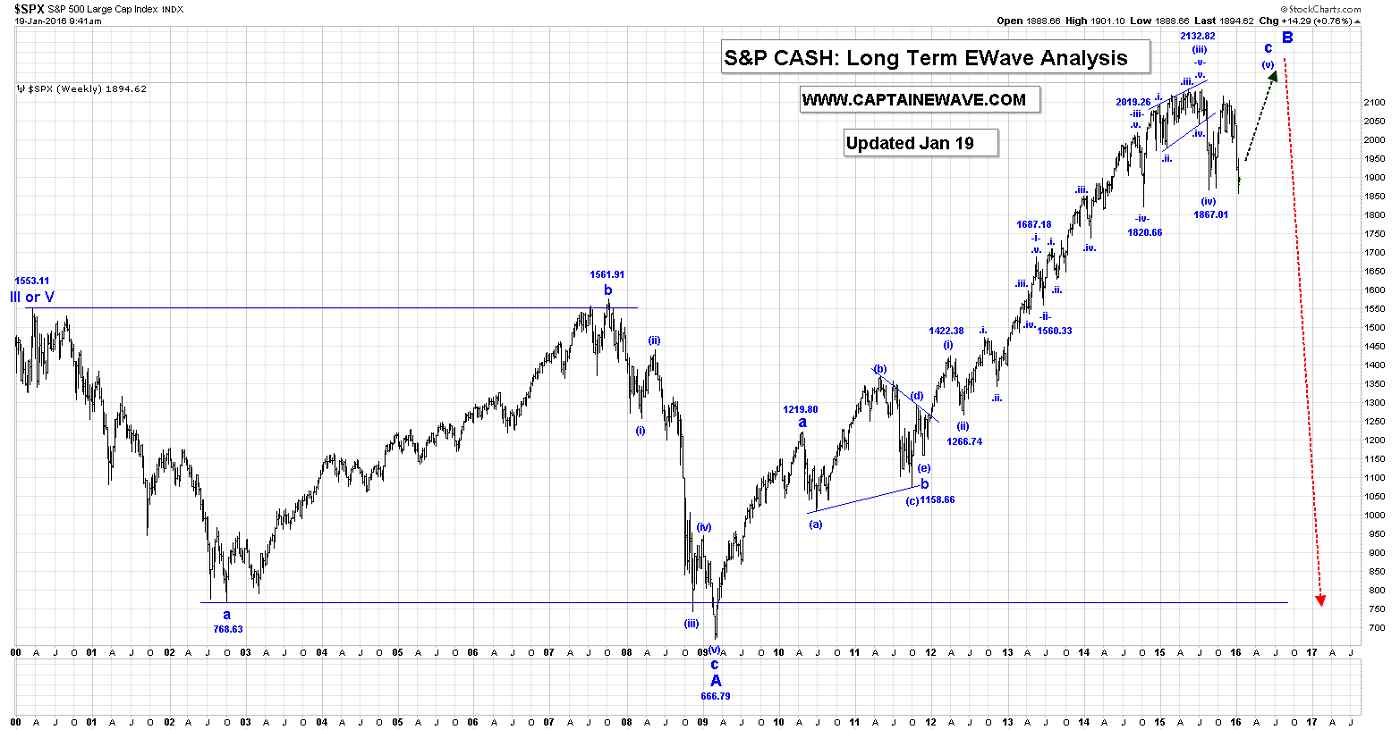
We have just completed wave -c- of our wave (iv) triangle and now expect a sloppy wave -d- rally, as the next big event. We expect that to be followed by a crash that will be remembered for generations, just like 1929!
Active Trading Positions: Long 5 positions, with 1900 puts as stops, but we will exit if we break below the 1857.83 low!
USDX

Short-Term Update:
In the overnight session, the USDX has now broken above our upper trend line connecting waves *b* and *d*. The overnight session high is 99.39, at the time that this Post was being written.
A break above 99.40 would the first positive step for the bulls, but we will need a clean break above the 99.73 high to eliminate the possibility that our current formation is expanding and extending.
If this triangle formation is complete at the 98.42 low then the next big event will be a wave .v. thrust that has a minimum target of 100.71.
Do not forget that triangles can expand and extend! Our current updated wave .iv. triangle count is as follows:
*a* = 97.72;
*b* = 99.73;
*c* = 98.14;
*d*= 99.40;
*e* = 98.42, if complete, to complete all of wave .iv. triangle.
If we break above the wave *d* high of 99.40, and then fail to break above 99.73 and then fall back, then it is likely that this triangle is expanding and extending.
Long-Term Trading Update:
We are now working on a wave .iv. triangle formation. Once this formation is complete we should expect a final thrust in wave .v., to reach at least eh 100.71 high.
Our current count for all of wave -v- is:
.i. = 96.64;
.ii. = 93.83;
.iii. = 100.58;
.iv. = 98.64, if complete (detailed count above);
.v. rally to go to at least the 100.71, wave -iii- high.
The other much more bearish count is shown on the attached Weekly USDX(Alternate) Chart. In this our second (a), (b), (c) pattern from the wave i low of 71.33, ended at 100.72 and we are now falling in another 3 wave pattern.
Within this 3 wave pattern we are working on wave -c-, with projections of 88.35 and 80.79.
All of our alternate counts will become valid if we drop below the 96.64 high.
Active Trading Positions: We are long 10 positions, risking to 97.20!
NatGas
Short-Term Update:
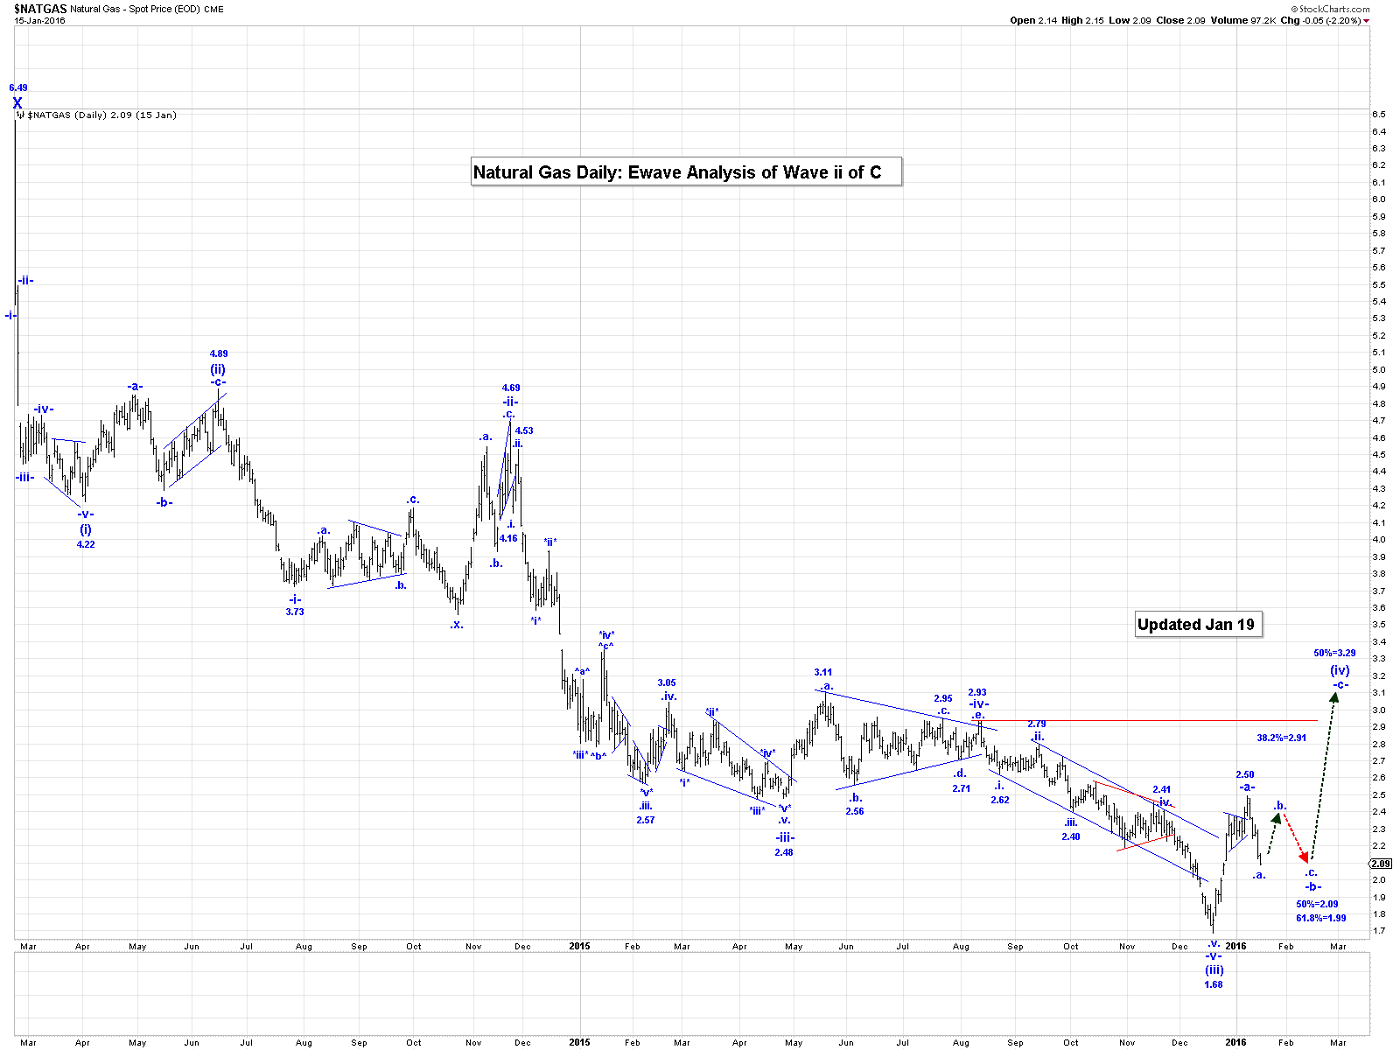
NG reached a high of 2.170 in the overnight session, before falling back. We are working on the assumption that wave .a. of -b- ended at 2.045,and that the current rally is wave .b.
On the Intraday Chart the drop from 2.494 to 2.045 looked impulsive, so we are expecting that this wave .b. rally will be corrective looking and finally reach our retracement levels as follows, before it ends:
50% = 2.271;
61.8% = 2.324
On the Intraday Chart, the rally from 2.045 to the current high of 2.170 is looking corrective, with overlapping waves. This support our idea that we are rallying in wave .b. of -b-, and not wave -c-.
Upon completion of wave .b. we expect one more drop in wave .c. to at least the wave .a. low of 2.045 to complete all of wave -b-..
There is still a very slim chance that ALL of wave -b- is complete at the current low of 2.045.
Retracement levels for the end of wave -b- are:
50% = 2.089;
61.8% = 1.993
Long-Term Trading Update:
Our retracement levels for all of wave (iv):
38.2% = 2.91;
50% = 3.29.
For the time being we will assume that wave (iv) is a simple -a-, -b-, -c- pattern, and within that count we have :
-a- = 2.494;
-b:
.a. = 2.045, if complete;
.b. rally has begun;
.c. drop to at least the wave .a. low of 2.045, to complete all of wave -b-;
-c- rally to at least the wave -a- high, but more likely to our 38.2%/50% retracement zone shown above.
Active Trading Positions: Long 5 at 2.05, risking to 1.69!
HUI/GDX and Selected Gold Stocks:
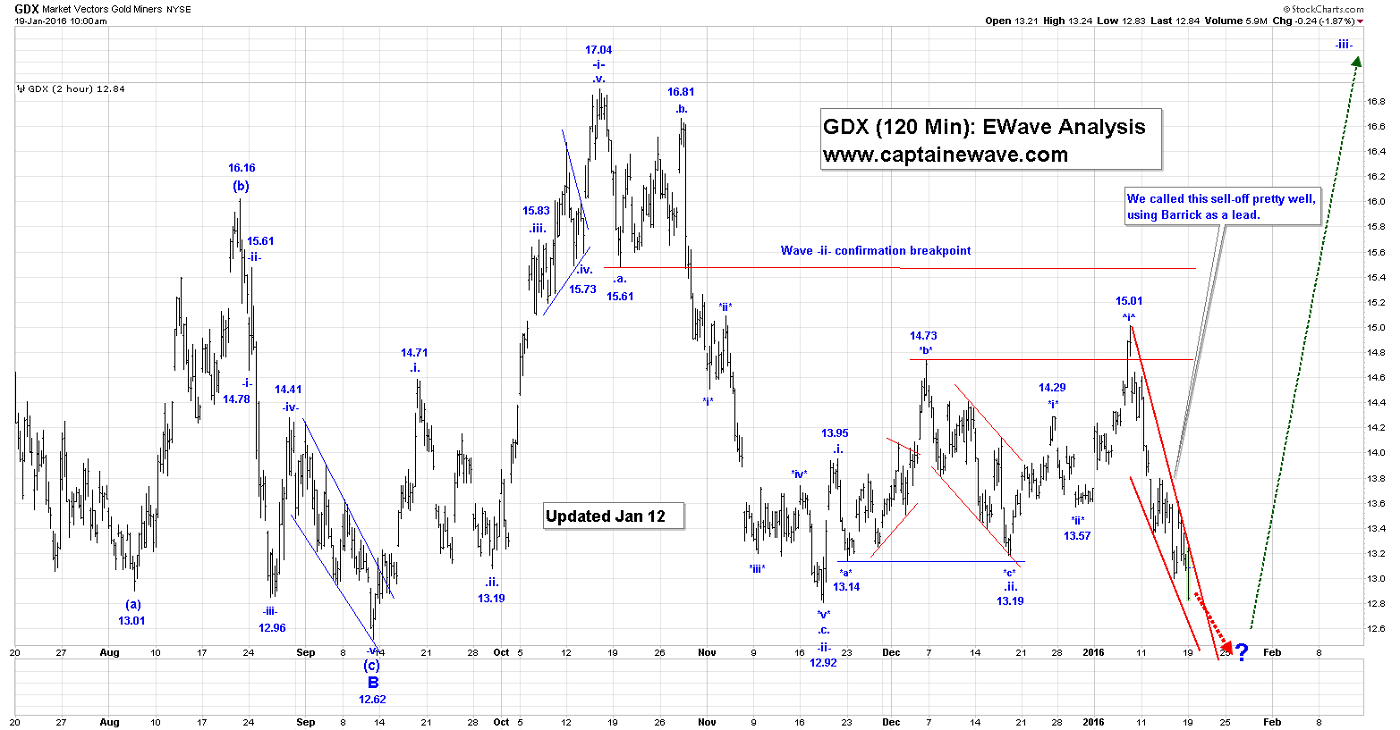
Short-Term Update:
We still expect a test of 12.62 low in the GDX before we can get more bullish on this market.
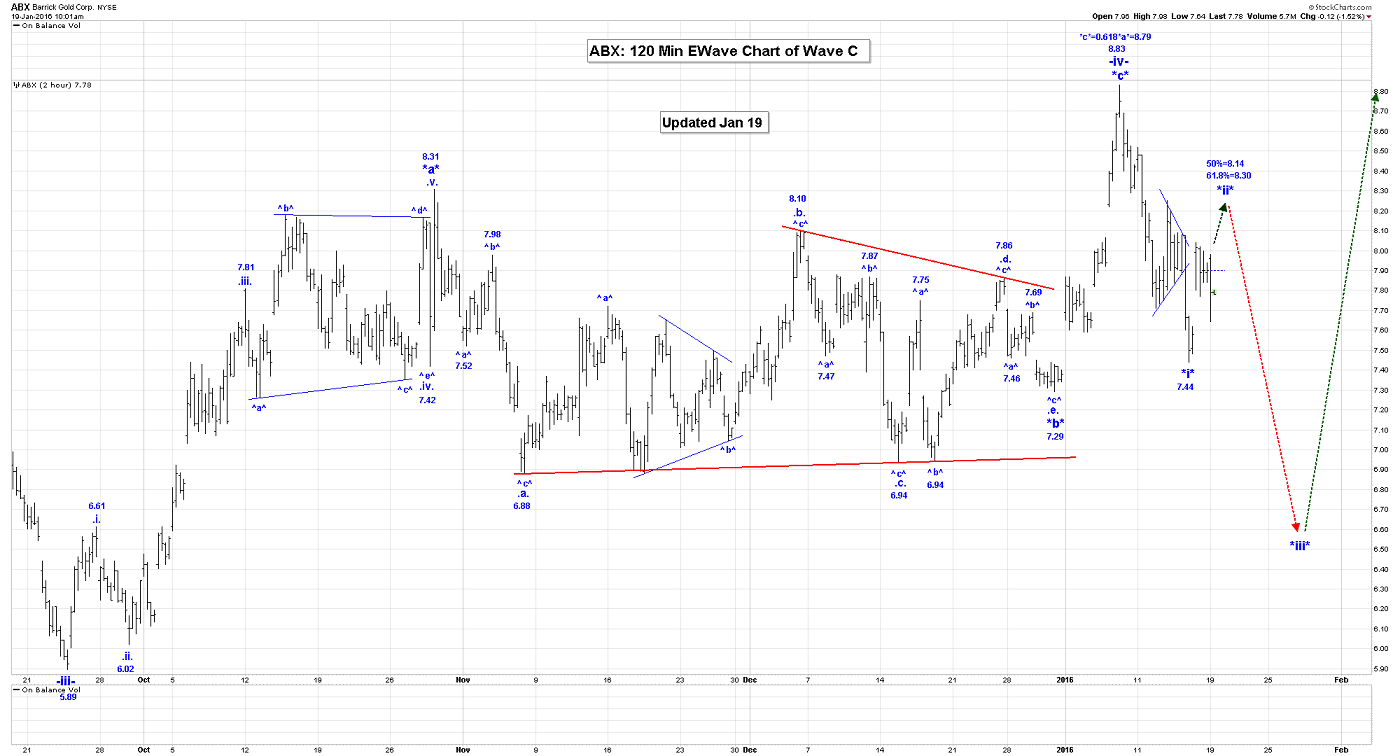
Long-Term Update:
We are now likely heading to at least the 12.62 low for GDX, to complete all of wave B.

The major breakouts in ABX and Kinross have failed which could suggest much lower prices ahead. Kinross is likely now heading to the 1.07 low and ABX back to 5.89.

The good news: CRJ is likely completing wave ^iv^ and should be heading higher in wave ^v^, or wave ^iv^ could become a triangle!
Active Trading Positions: We are long the GDX, ABX, KGC, NEM, CRJ, and TSX:XGD with no stops!
Email: [email protected]
Website: www.captainewave.com
Risk: CAPTAINEWAVE.COM IS AN IMPERSONAL ADVISORY SERVICE. AND THEREFORE, NO CONSIDERATION CAN OR IS MADE TOWARD YOUR FINANCIAL CIRCUMSTANCES. ALL MATERIAL PRESENTED WITHIN CAPTAINEWAVE.COM IS NOT TO BE REGARDED AS INVESTMENT ADVICE, BUT FOR GENERAL INFORMATIONAL PURPOSES ONLY. TRADING STOCKS DOES INVOLVE RISK, SO CAUTION MUST ALWAYS BE UTILIZED. WE CANNOT GUARANTEE PROFITS OR FREEDOM FROM LOSS. YOU ASSUME THE ENTIRE COST AND RISK OF ANY TRADING YOU CHOOSE TO UNDERTAKE. YOU ALSO AGREE TO BEAR COMPLETE RESPONSIBILITY FOR YOUR INVESTMENT RESEARCH AND DECISIONS AND ACKNOWLEDGE THAT CAPTAINEWAVE.COM HAS NOT AND WILL NOT MAKE ANY SPECIFIC RECOMMENDATIONS OR GIVE ADVICE TO YOU OR ANY OF ITS CLIENTS UPON WHICH THEY SHOULD RELY. CAPTAINEWAVE.COM SUGGESTS THAT THE CLIENT/MEMBER TEST ALL INFORMATION AND TRADING METHODOLOGIES PROVIDED AT OUR SITE THROUGH PAPER TRADING OR SOME OTHER FORM OF TESTING. CAPTAINEWAVE.COM, ITS OWNERS, OR ITS REPRESENTATIVES ARE NOT REGISTERED AS SECURITIES BROKER-DEALERS OR INVESTMENT ADVISORS EITHER WITH THE U.S. SECURITIES AND EXCHANGE COMMISSION OR WITH ANY STATE SECURITIES REGULATORY AUTHORITY. WE RECOMMEND CONSULTING WITH A REGISTERED INVESTMENT ADVISOR, BROKER-DEALER, AND/OR FINANCIAL ADVISOR. IF YOU CHOOSE TO INVEST WITH OR WITHOUT SEEKING ADVICE FROM SUCH AN ADVISOR OR ENTITY, THEN ANY CONSEQUENCES RESULTING FROM YOUR INVESTMENTS ARE YOUR SOLE RESPONSIBILITY.
ALL INFORMATION POSTED IS BELIEVED TO COME FROM RELIABLE SOURCES. CAPTAINEWAVE.COM DOES NOT WARRANT THE ACCURACY, CORRECTNESS, OR COMPLETENESS OF INFORMATION AVAILABLE FROM ITS SERVICE AND THEREFORE WILL NOT BE LIABLE FOR ANY LOSS INCURRED. DUE TO THE ELECTRONIC NATURE OF THE INTERNET, THE CAPTAINEWAVE.COM WEBSITE, ITS E-MAIL & DISTRIBUTION SERVICES AND ANY OTHER SUCH "ALERTS" COULD FAIL AT ANY GIVEN TIME. CAPTAINEWAVE.COM WILL NOT BE RESPONSIBLE FOR UNAVAILABILITY OF USE OF ITS WEBSITE, NOR UNDELIVERED E-MAILS, OR "ALERTS" DUE TO INTERNET BANDWIDTH PROBLEMS, EQUIPMENT FAILURE, OR ACTS OF GOD. CAPTAINEWAVE.COM DOES NOT WARRANT THAT THE TRANSMISSION OF E-MAILS, OR ANY "ALERT" WILL BE UNINTERRUPTED OR ERROR-FREE. CAPTAINEWAVE.COM WILL NOT BE LIABLE FOR THE ACTS OR OMISSIONS OF ANY THIRD PARTY WITH REGARDS TO CAPTAINEWAVE.COM DELAY OR NON-DELIVERY OF THE CAPTAINEWAVE.COM NIGHTLY EMAILS OR "ALERTS". FURTHER, WE DO NOT RECEIVE ANY FORM OF PAYMENT OR OTHER COMPENSATION FOR PUBLISHING INFORMATION, NEWS, RESEARCH OR ANY OTHER MATERIAL CONCERNING ANY SECURITIES ON OUR SITE OR PUBLISH ANY INFORMATION ON OUR SITE THAT IS INTENDED TO AFFECT OR INFLUENCE THE VALUE OF SECURITIES.
THERE IS NO GUARANTEE PAST PERFORMANCE WILL BE INDICATIVE OF FUTURE RESULTS. NO ASSURANCE CAN BE GIVEN THAT THE RECOMMENDATIONS OF CAPTAINEWAVE.COM WILL BE PROFITABLE OR WILL NOT BE SUBJECT TO LOSSES. ALL CLIENTS SHOULD UNDERSTAND THAT THE RESULTS OF A PARTICULAR PERIOD WILL NOT NECESSARILY BE INDICATIVE OF RESULTS IN FUTURE PERIODS. THE RESULTS LISTED AT THIS WEBSITE ARE BASED ON HYPOTHETICAL TRADES. PLAINLY SPEAKING, THESE TRADES WERE NOT ACTUALLY EXECUTED. HYPOTHETICAL OR SIMULATED PERFORMANCE RESULTS HAVE CERTAIN INHERENT LIMITATIONS. UNLIKE AN ACTUAL PERFORMANCE RECORD, SIMULATED TRADES DO NOT REPRESENT ACTUAL TRADING. ALSO, SINCE THE TRADES HAVE NOT ACTUALLY BEEN EXECUTED, THE RESULTS MAY HAVE OVER OR UNDER COMPENSATED FOR THE IMPACT, IF ANY, OF CERTAIN MARKET FACTORS SUCH AS LACK OF LIQUIDITY. YOU MAY HAVE DONE BETTER OR WORSE THAN THE RESULTS PORTRAYED. NO REPRESENTATION IS BEING MADE THAT ANY ACCOUNT WILL OR IS LIKELY TO ACHIEVE PROFITS OR LOSSES SIMILAR TO THOSE SHOWN. NO INDEPENDENT PARTY HAS AUDITED THE HYPOTHETICAL PERFORMANCE CONTAINED AT THIS WEBSITE, NOR HAS ANY INDEPENDENT PARTY UNDERTAKEN TO CONFIRM THAT THEY REFLECT THE TRADING METHOD UNDER THE ASSUMPTIONS OR CONDITIONS SPECIFIED HEREAFTER. WHILE THE RESULTS PRESENTED AT THIS WEBSITE ARE BASED UPON CERTAIN ASSUMPTIONS BELIEVED TO REFLECT ACTUAL TRADING CONDITIONS, THESE ASSUMPTIONS MAY NOT INCLUDE ALL VARIABLES THAT WILL AFFECT, OR HAVE IN THE PAST AFFECTED, THE EXECUTION OF TRADES INDICATED BY CAPTAINEWAVE.COM. THE HYPOTHETICAL RESULTS ON THIS WEBSITE ARE BASED ON THE ASSUMPTION THAT THE CLIENT BUY AND SELLS THE POSITIONS AT THE OPEN PRICE OF THE STOCK. THE SIMULATION ASSUMES PURCHASE AND SALE PRICES BELIEVED TO BE ATTAINABLE. IN ACTUAL TRADING, PRICES RECEIVED MAY OR MAY NOT BE THE SAME AS THE ASSUMED ORDER PRICES.


