Technical Analysis Of The Markets


Current Position of the Market
SPX: Long-term trend – The bull market is continuing with no sign of a major top in sight.
Intermediate trend – Soon coming to an end – 2 wks?
Analysis of the short-term trend is done on a daily basis with the help of hourly charts. It is an important adjunct to the analysis of daily and weekly charts which discusses the course of longer market trends.
At Minor Top
Market Overview
This should be one of the last minor tops before the arrival of a much more serious correction, most likely the most serious one since the 1810 low in the SPX. From a time standpoint: a little more time is required. Price-wise: a few more points as well. More specific information regarding the date and the top projection has already been made available to subscribers (including trial subscribers).
In the last letter, I pointed out that we just had the largest correction since August, but needed to confirm that it was over. That confirmation came when we went up on Monday instead of re-testing the 2567 low one more time, and Thanksgiving week brought about a new all-time high for the SPX. It is anticipated that there is more to go, but not immediately. If Friday was not the top of the move from 2557, Monday should be. There is a minor cycle bottoming over the next week which will give us a few days of consolidation/correction before we resume the intermediate move which started nearly two years ago, at 1810. More important cycles bottoming in January/February will place a limitation on how far the next upward push can extend over the near-term.
Chart Analysis (These charts and subsequent ones courtesy of QCharts)
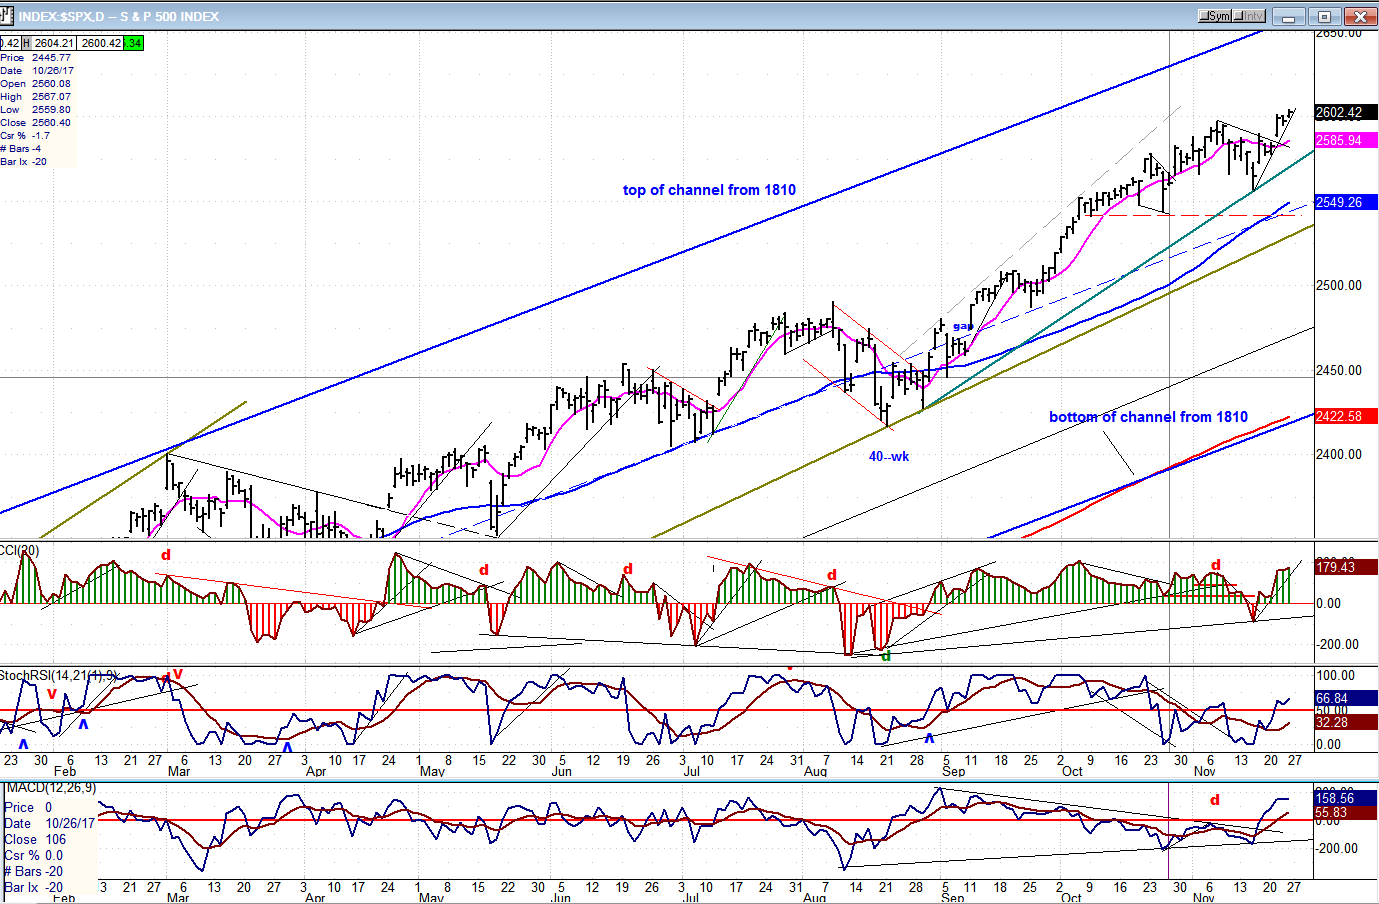
SPX Daily Chart:
The next minor cycle is due in 3-4 days, and Friday’s action was rather tepid, but since it was only a shortened session, we’ll give the index the benefit of the doubt and allow for another potential few points on the upside before the cyclic rhythm starts to pull prices down. Whether we start retracing right away or a little later in the day, Monday looks like a good day for a cycle peak – unless it was Friday.
Since a .382 retracement of the move from 2557 would bring the index back to about 2585, and that level corresponds to good support, that would be a good point for the minor correction to end -- this is assuming that we start retracing right away! At 2585, the index would also benefit from support at the green trend line.
There is no good reason why we should go much higher before correcting, and the oscillators, which lost their upside momentum on Friday, seem to bear this out. The structure from 2557 also appears complete.
SPX Hourly Chart:
The last uptrend finished with a somewhat unorthodox ending diagonal triangle, since wave-e did not make a new high. It was also unorthodox in the sense that it did not retrace all the way down to the beginning of the formation, as diagonals are prone to do. The pattern that we are currently completing also has the appearance of an EDT, but since the waves are not overlapping, it is probably an impulse wave which may have completed 5 waves up on Friday and may already have begun to correct. We should have some indication of this as soon as 6:00 pm ET Sunday when Globex trading is reported.
Supporting this view is the fact that the oscillators all show negative divergence and the SRSI has even started to roll over. Confirmation will come as soon as the index makes a new hourly low and closes below the green trend line (different from the one mentioned on the daily chart). As you can see, upside progression is limited by another trend line directly above Friday’s price which has already provided resistance on numerous previous occasions.

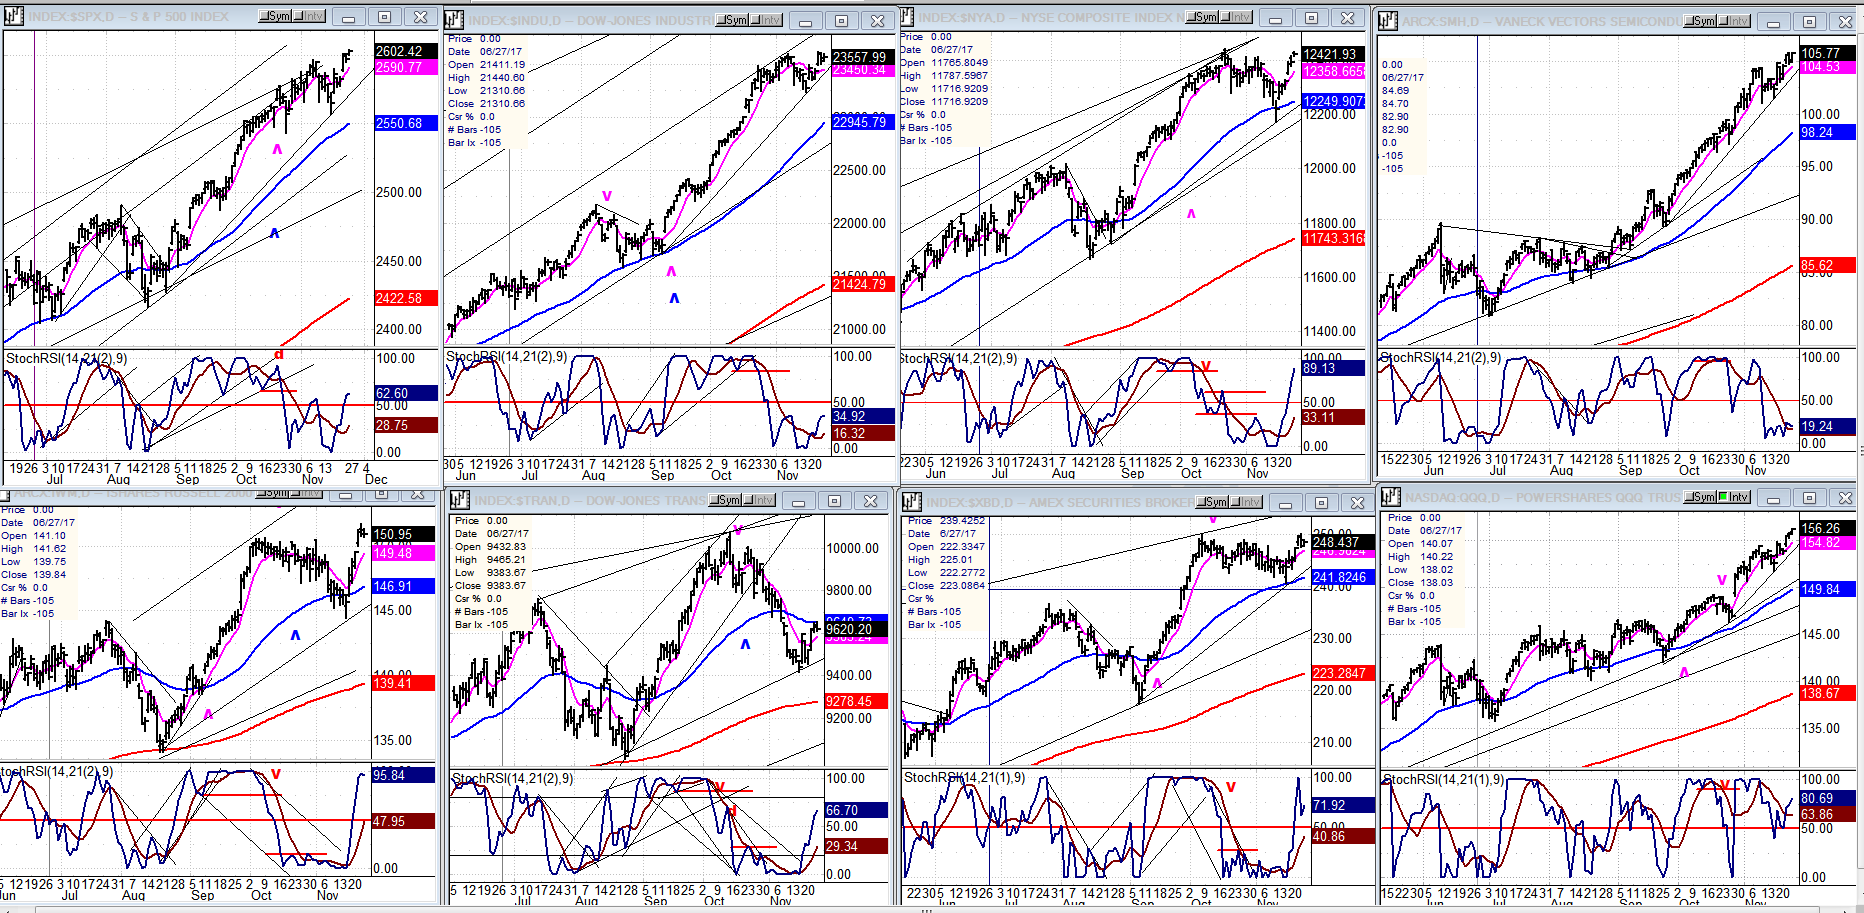
An Overview Of Some Important Indexes (Daily Charts)
Some diversity is clearly showing in the indexes posted below. The biggest change of behavior is in IWM (bottom left) which has gone from warning of a pending correction to initiating a strong rally in which it was only joined in making a distinct new high by SPX (above) and the two tech representatives on the right. The middle indices showed a little more reluctance at participating, with TRAN (second from left, bottom) reverted to its historic role as the harbinger of a more protracted correction coming in the near future.
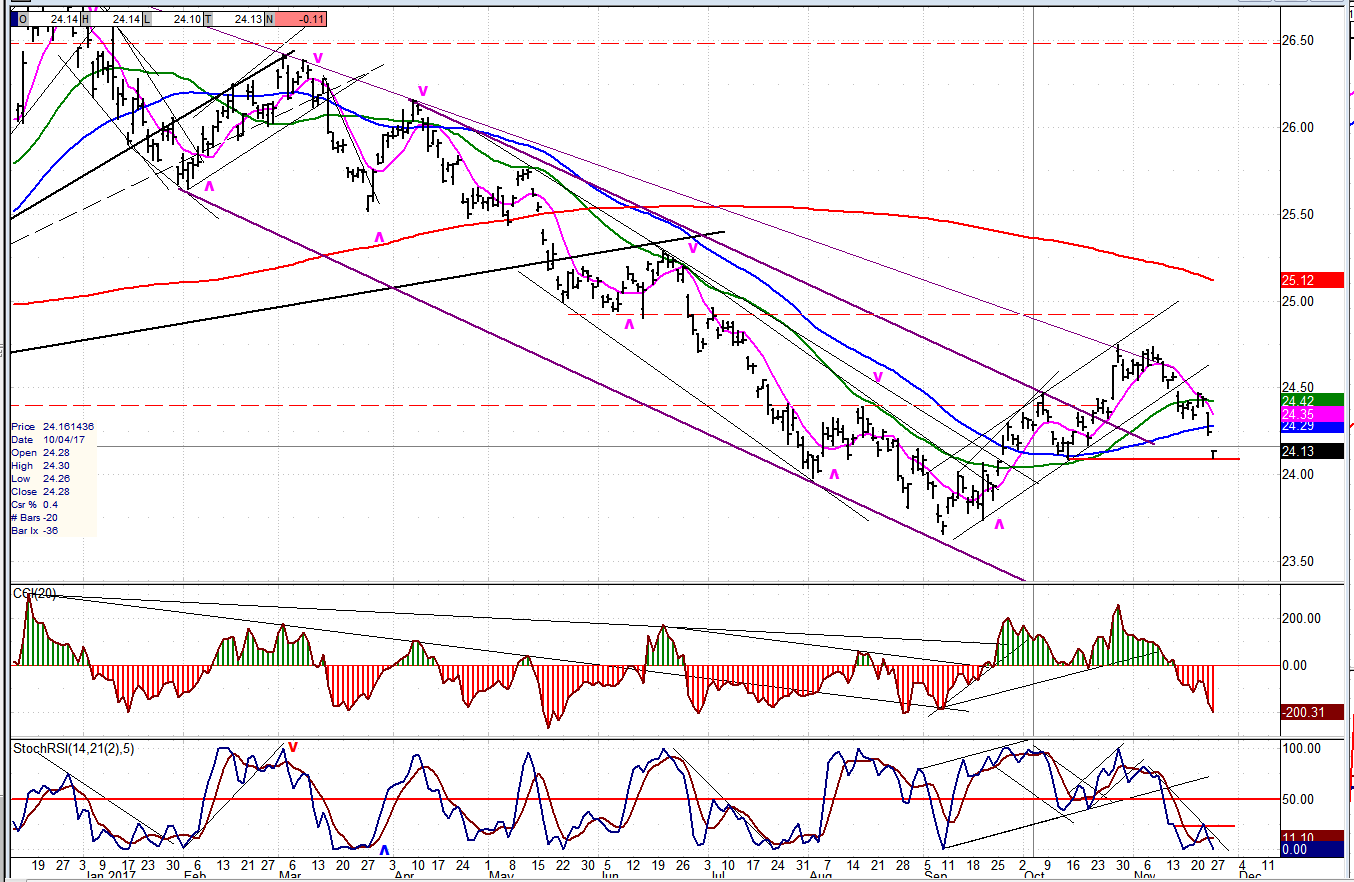
UUP (Dollar ETF)
UUP had its moment of glory, but it only proved to be an oversold rally. It was not able to overcome its main downtrend line and has declined to the support provided by the last short-term low. While it could be ready to firm up, its likely future path will be one of more correction after a short rally.
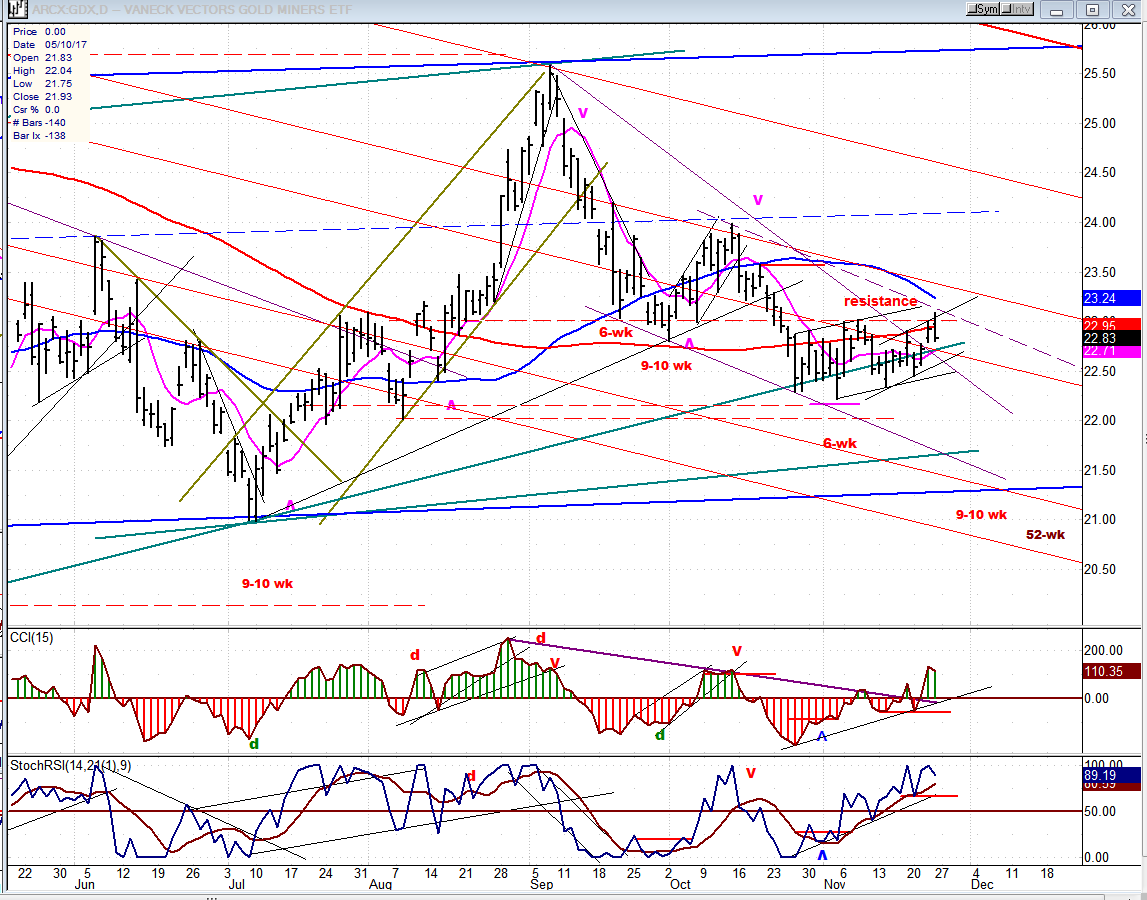
GDX (Gold Miners ETF)
As forecast last week, GDX rallied to the top of its slanted corrective pattern where it met some resistance and was pushed back. It may still hover in this area for a little longer but, as you can see, important cycle lows lie directly ahead that should determine the index’s trend for the next couple of weeks.
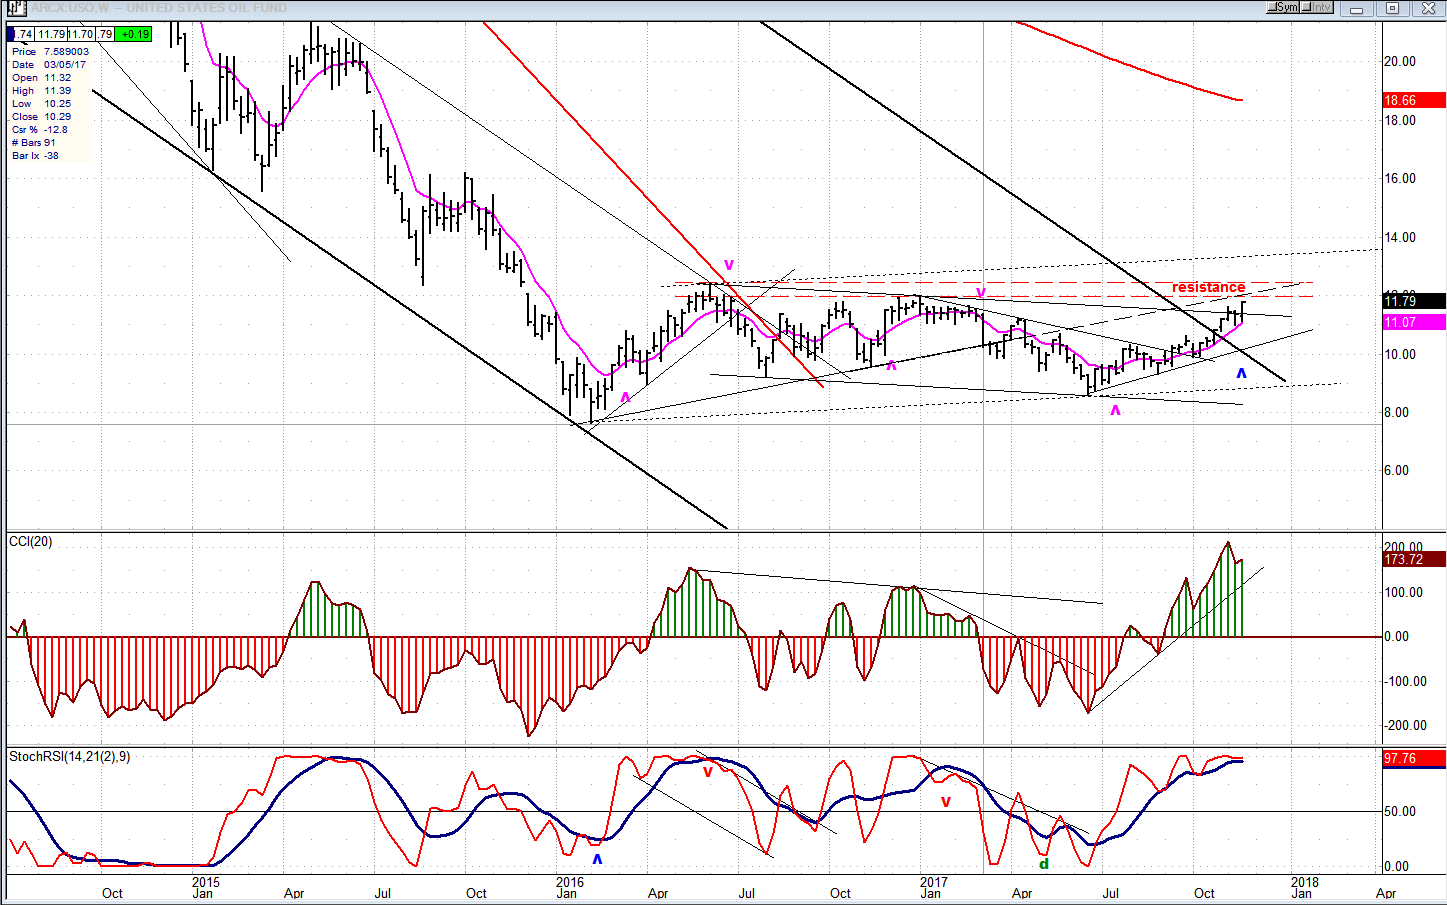
USO (United States Oil Fund)
A weekly chart of USO better portrays the significant basing action of the past two years which preceded the nmove out of its major corrective channel. In spite of the resistance which lies directly overhead, the P&F chart projects an immediate move to about 13, followed by a longer term target to 18-20 which could even be revised higher, eventually.
Summary
SPX appears to have completed its initial rally phase from the 2557 correction low, and is now ready to consolidate/correct for a few days, after which it should resume its final climb to an intermediate top.
*********
FREE TRIAL SUBSCRIPTON
Market Turning Points is an uncommonly dependable, reasonably priced service providing intra-day market updates, explanations, and commentary, plus detailed weekend reports. It is ideally suited to traders, but it can also be valuable to longer-term holders since price projections are provided using Point & Figure analysis along with best-time estimates obtained from cycle analysis.
For a FREE 4-week trial, Send an email to: [email protected]
For further subscription options, payment plans, and for general information, I encourage you to visit my website at www.marketurningpoints.com.
The above comments about the financial markets are based purely on what I consider to be sound technical analysis principles. They represent my own opinion and are not meant to be construed as trading or investment advice, but are offered as an analytical point of view which might be of interest to those who follow stock market cycles and technical analysis.

When Andre Gratian was a stock broker years ago, a friend introduced him to technical analysis of the market. Consequently, it is not an exaggeration to say that Andre fell in love with this approach! Ever since then, it has become an increasingly important part of his professional life. Gratian has studied the works of Wyckoff, Edwards & Magee, Edward J. Dewey (cycles) and many others. However, one of my most profitable undertaking has probably been to study Point & Figure charting, which he finds invaluable in analyzing stocks and indices. If he were restricted to one methodology, this is the one that he would choose. This well-rounded background has given him what he feels to be a special insight into the stock market, facilitating the recognition of meaningful patterns and the ‘turning points’ in all trends, whether they be short or long term. Andre feels very comfortable discussing the stock market and passing on meaningful information to others. His subscribers include individuals and money managers throughout the world. Moreover, his Newsletters are currently published on several financial sites, here and abroad.
More from Gold-Eagle


