Technical Analysis Of The Markets


Current Position of the Market
SPX: Long-term trend – The bull market is continuing with a top expected in the low 3000s.
Intermediate trend – A short-intermediate term top is re-forming at a higher level
Analysis of the short-term trend is done on a daily basis with the help of hourly charts. It is an important adjunct to the analysis of daily and weekly charts which discusses the course of longer market trends.
Deceleration/Distribution
Market Overview
“We have entered the potential target range that is suggested…”
Last week’s letter mentioned that the seemingly exponential move in the SPX was unsustainable, especially since we had reached the projection range assigned by the re-accumulation level which formed at 2685. The index was quick to confirm this diagnosis with a new high Tuesday, immediately followed by a 38-point retracement after the opening hour. The next day saw a re-test of the high, with a little more progress being made by the end of the week, as it eked out a slightly new high in the hope that we could avoid a government shut-down. This did not happen, but a compromise could still be reached over the week-end.
Since the consolidation pattern formed around 2685, the index had shown little congestion on the way to the new high except for a rest stop at about 2755, but from Tuesday’s high to Friday’s, we have 105 reversals on the 1X P&F chart for the 4-day week of trading, half of it taking place between Thursday and Friday in a tight range of about 15 points.
With the government shut-down, it’s reasonable to think that we should see a sell-off starting on Monday unless, of course, an agreement is reached before then. But it’s doubtful that this would be the beginning of an important correction or even that the high of the move from the August low has already been made. As discussed last week, a cycle inversion is expected in the January-February time frame, and we may just have reached its western edge. After the little dust devil caused by Friday’s event clears up, we can better see how the final stages of this rally will develop.
Chart Analysis (These charts and subsequent ones courtesy of QCharts)
SPX Daily Chart
Since the new uptrend which started in August of last year (after the 40-wk cycle made its low), we have been trying to determine when it would end. But the normal deceleration process which occurs at the end of a trend has repeatedly been postponed, and acceleration increased instead! Last week however, after SPX reached its target zone, this condition started again to show negative divergence, something which had occurred ahead of the 20-wk cycle low, but that cycle was almost entirely neutralized by year-end bullishness and the passage of the tax bill. Things have now settled down, new divergence has formed, and we even materialized a catalyst which has helped to produce the anticipated behavior at this stage of the uptrend.
The structural action since August is expected to bring an end to a larger structure which started much lower and, consequently, should bring about a more substantial correction than even the 70-point decline in August. We have been on a wave-ending watch for several weeks, but have only been frustrated by an index which just kept moving higher and higher instead of topping. This time, it’s different! Really!
We can quantify the size of the correction phase which is about to start with the pattern just created on the P&F chart; but I think it will, at best, be limited to the count formed by congestion in the second half of last week. As always, the exact projection will be passed on to subscribers (including trial members). Its duration should depend on how long it takes for the warring parties in Washington to come to an armistice.
Note that the momentum oscillators (upper two) are still very positive, though decelerating, but the A/Ds index has been advertising a top for a couple of weeks. At the very least, we should violate the steepest (thinnest) trend line during this correctio; but trend line #1 could very well contain price this time around.

SPX Hourly Chart
On Friday, the index closed at a new high, in spite of the looming government shut-down at midnight! If the politicians are still at each-other’s throats by Monday morning, with no agreement in sight, it’s a fair bet that the market will gap down at the opening. Even though we closed near the high of the day, a little diagonal triangle pattern was formed, suggesting that we are ready for a pull-back. Actually, there was a slightly higher count established at the last re-accumulation level but the only way I could see us reaching it, is if things are settled in Washington by the opening bell. We’d better wait and see where we are in the negotiations by then, and not make any hard and fast prognostications.
Just for the record, all three oscillators closed positive!

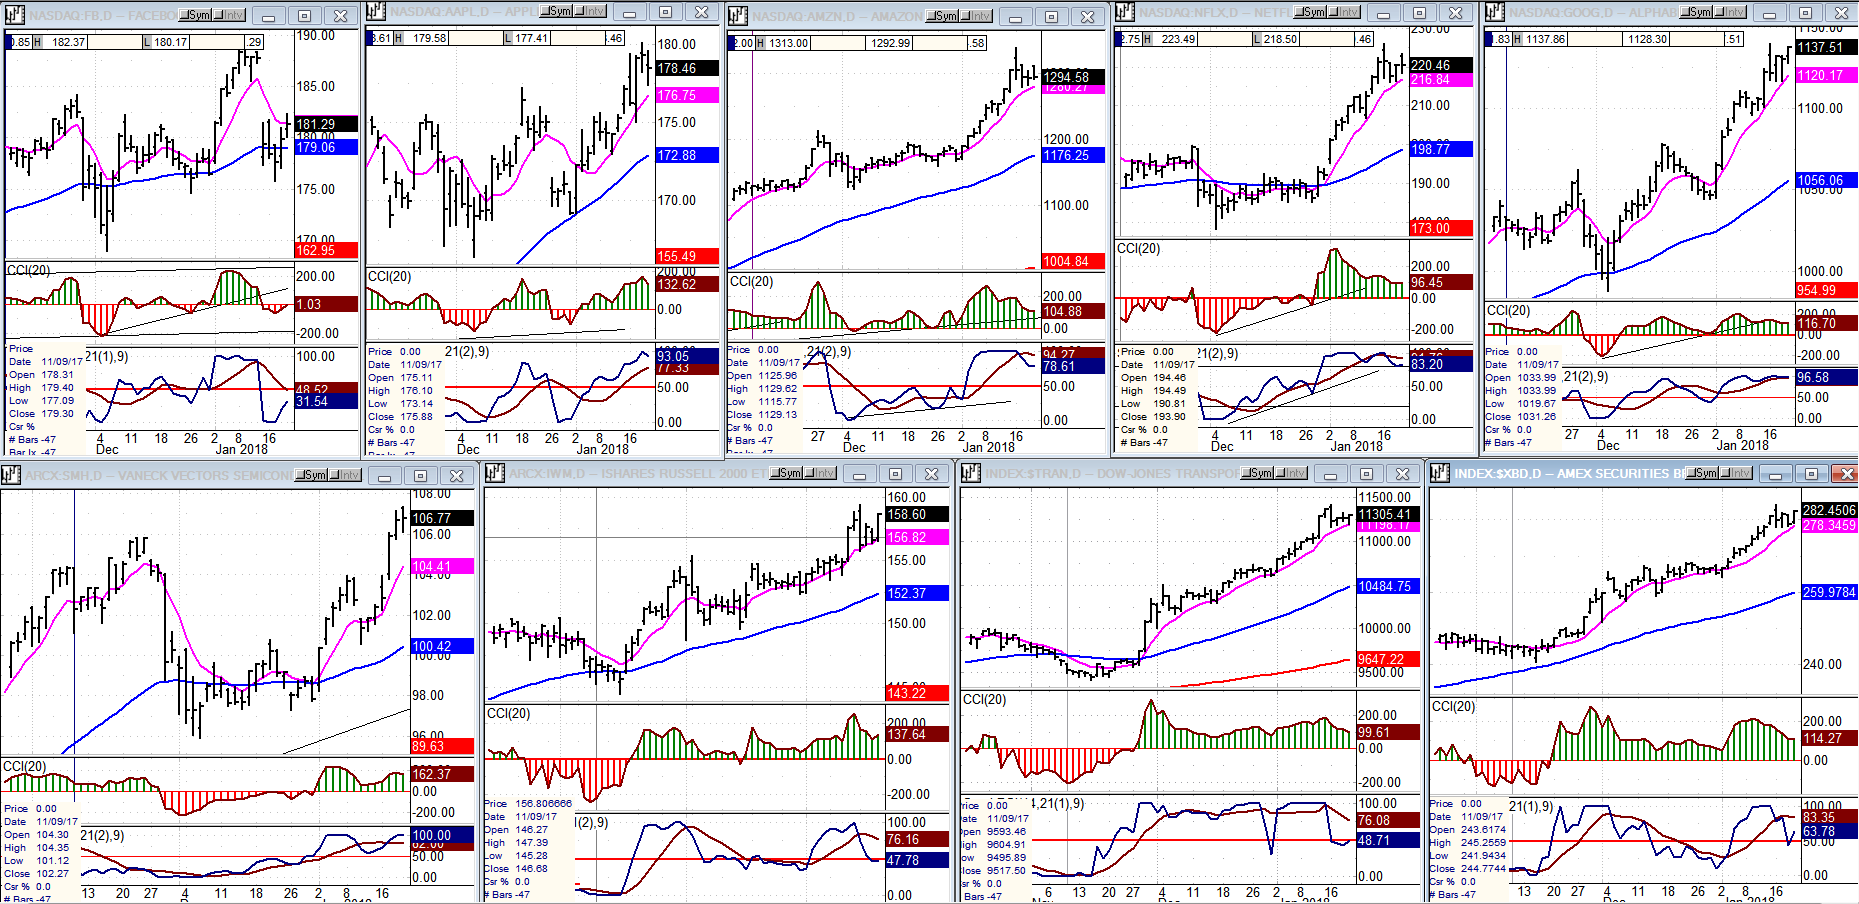
An Overview Of Some Important Indexes (Daily Charts)
Only Facebook (top, left) is showing signs of profit-taking in the FAANGS (top tier). After consolidating, SMH and IWM (bottom, 1&2) have resumed their uptrend. It’s clear that no serious selling has yet taken place.
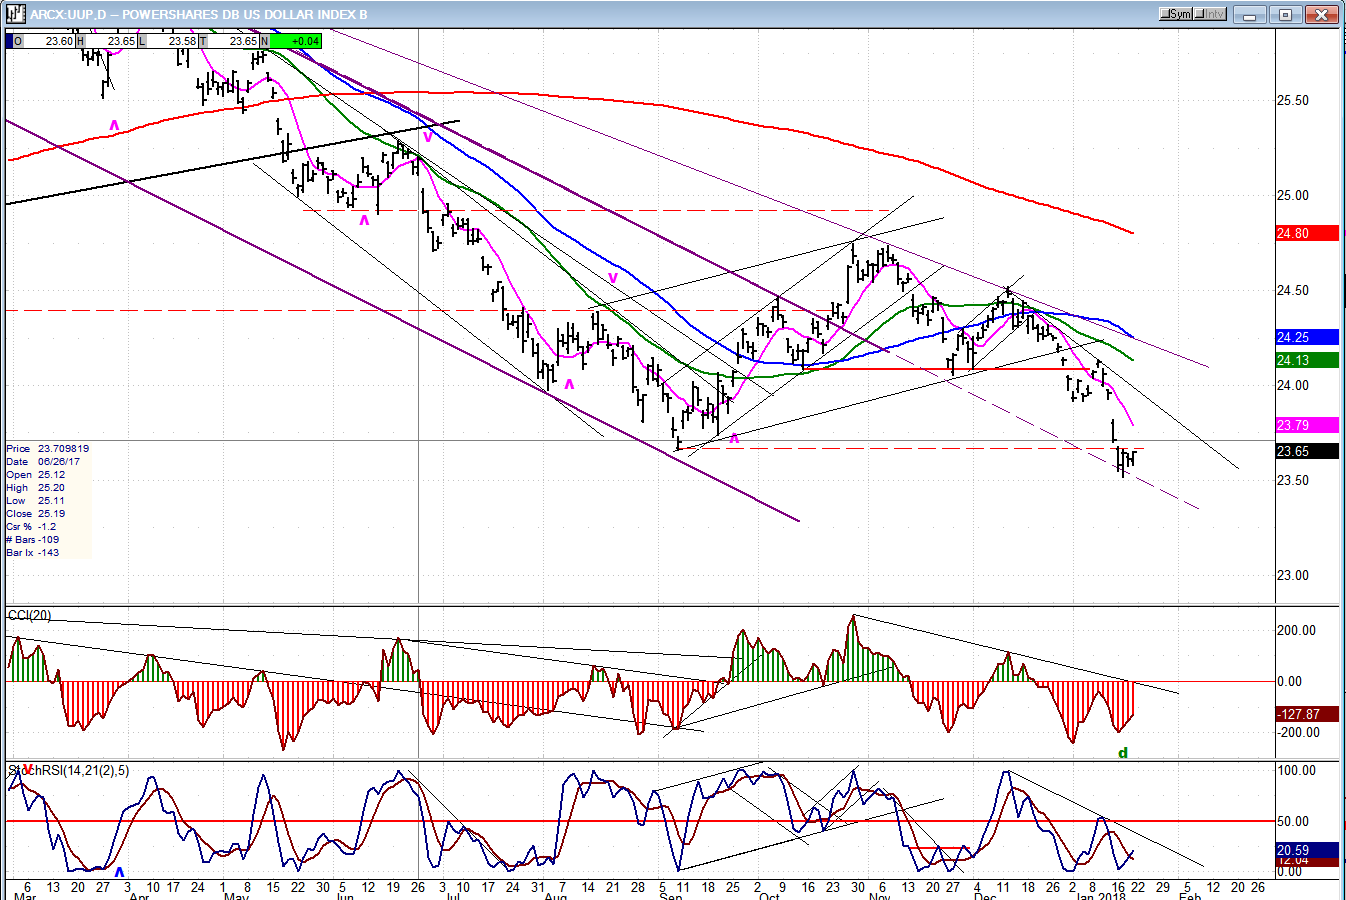
UUP (Dollar ETF)
UUP just made a new low for the intermediate correction which started a year ago. For now, It has found support on the extension to its downtrend line. Let’s see if it can hold this level, and for how long.
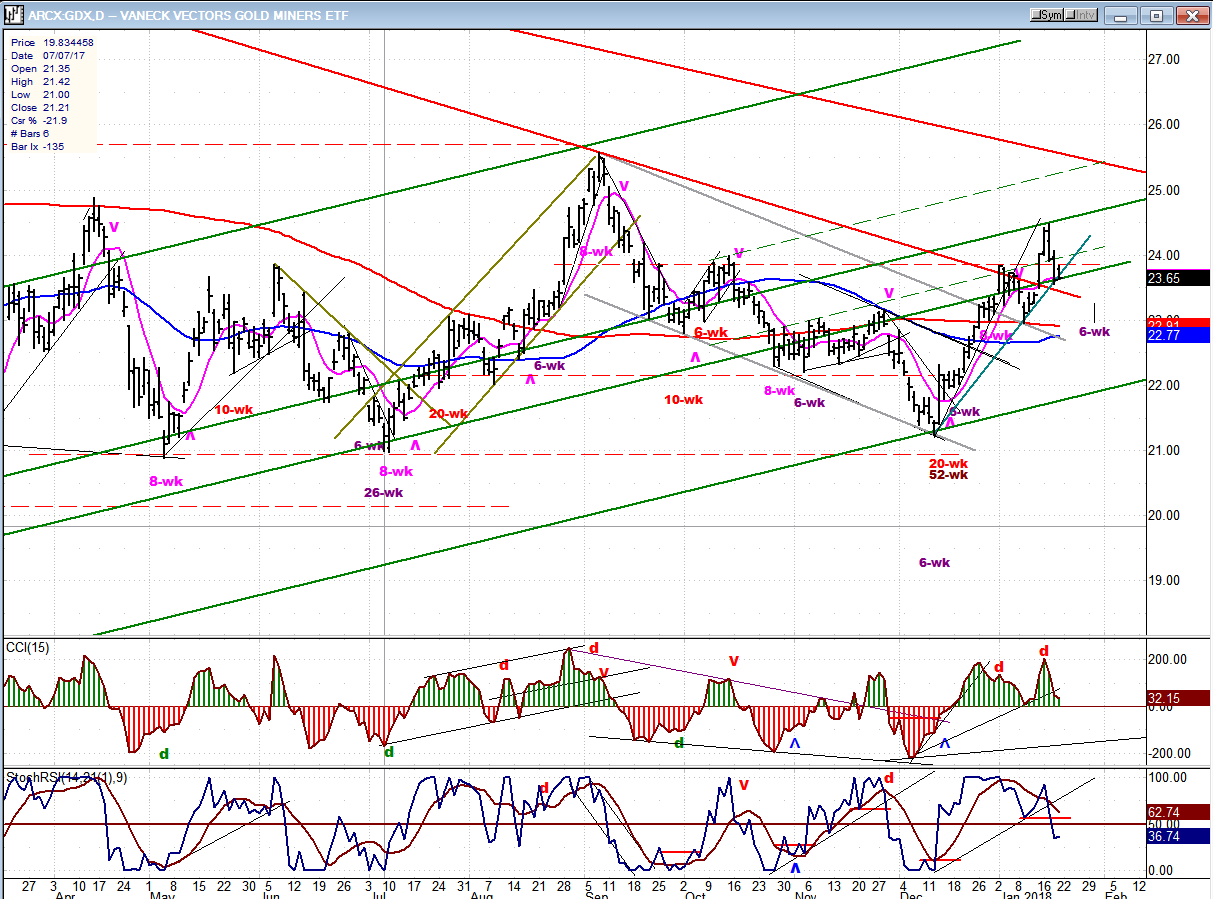
GDX (Gold Miners ETF)
GDX has completed an initial break-out wave and has started the normal consolidation process that follows. A minor cycle is just ahead which could keep this phase going for another week or so. However, larger cycles due in the middle of next month could invert and cause range-bound trading for an extended period of time. Not quite sure how this is going to play out. Will need to observe price action for clues.
USO (United States Oil Fund)
USO is reaching its initial projection target and may soon start to consolidate its advance from the June low.

Summary
SPX entered its projection zone at the beginning of last week, and has begun to show signs of a profit-taking/distribution phase which should eventually lead to the formation of a fairly important top and the deepest correction since late 2016. However, within the context of the entire bull market, this should still be fairly insignificant, and by no means an indication that it is coming to an end.
*********
FREE TRIAL SUBSCRIPTON
With a trial subscription, you will have access to the same information that is given to paid subscribers, but for a limited time period. I think you will find that knowing how far a move can carry is one of the most useful benefits of this service, whether you are a trader or an investor -- especially when this price target is confirmed by reliable indicators which give advance warning of a market top or bottom. Furthermore, cycle analysis adds the all- important time element to the above price projections.
For a FREE 4-week trial, further subscription options, payment plans, and for general information, I encourage you to visit my website at www.marketurningpoints.com.
The above comments about the financial markets are based purely on what I consider to be sound technical analysis principles. They represent my own opinion and are not meant to be construed as trading or investment advice, but are offered as an analytical point of view which might be of interest to those who follow stock market cycles and technical analysis.

When Andre Gratian was a stock broker years ago, a friend introduced him to technical analysis of the market. Consequently, it is not an exaggeration to say that Andre fell in love with this approach! Ever since then, it has become an increasingly important part of his professional life. Gratian has studied the works of Wyckoff, Edwards & Magee, Edward J. Dewey (cycles) and many others. However, one of my most profitable undertaking has probably been to study Point & Figure charting, which he finds invaluable in analyzing stocks and indices. If he were restricted to one methodology, this is the one that he would choose. This well-rounded background has given him what he feels to be a special insight into the stock market, facilitating the recognition of meaningful patterns and the ‘turning points’ in all trends, whether they be short or long term. Andre feels very comfortable discussing the stock market and passing on meaningful information to others. His subscribers include individuals and money managers throughout the world. Moreover, his Newsletters are currently published on several financial sites, here and abroad.


