Technical Analysis Of The Markets


SPX: Long-term trend: Severe correction underway.
SPX: Intermediate trend – counter-trend rally!
Analysis of the short-term trend is done on a daily basis with the help of hourly charts. It is an important adjunct to the analysis of daily and weekly charts which discuss longer market trends.
COUNTER-TREND RALLY
Market Overview
With oil deciding to end its decline in climactic fashion on Wednesday, SPX went along for the ride and ended its decline in a similar manner one phase projection lower than I predicted. Since then, it has been in a powerful counter-trend rally which is approaching at least a short-term top. On Friday, the index came to within a few points of its .382 retracement; that is also the proximity of a P&F and Fib projections from the low. After a correction, it is possible that we will have an extension to a higher level before resuming the primary trend, which is down. Should this be necessary, reaching a 50% retracement some 30 points higher would not be unreasonable.
That we are approaching (or at) a short-term high is evident in the deceleration which took place on Friday after the initial opening surge. It is especially apparent on hourly charts of the TRAN, DJIA and XBD (especially).
In the recent weeks, the market has been largely influenced by the declining price of oil. As you know, I had a long term low of “8” for USO (United States Oil Fund). This was finally achieved on Wednesday when it dropped to 7.92 and started to rally immediately, with WTIC doing the same thing. By Friday’s close, it had retraced to 9.27, the best rally since last August. WTIC rallied from its Wednesday low of 27.56 to Friday’s close of 32.25. I will discuss oil in more detail when I analyze USO.
SPX Chart Analysis
Daily Chart (This chart, and others below, are courtesy of QCharts.com.)
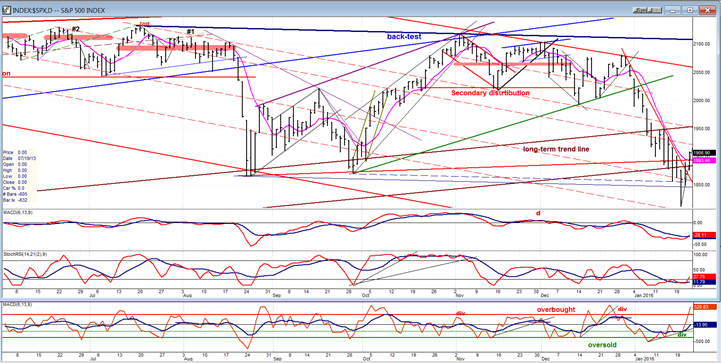
After almost three weeks of straight decline which spanned 267 points (longer in price and much longer in time than the August sell-off) SPX decided it was enough (for now) and started a sharp rally which, so far, measures 90 points. If we don’t count Wednesday’s reversal, Monday will be its third day. Very often, after three days of trading in one direction, a correction begins (some sort of Fibonacci thing, I suppose). What is not visible on this chart (but will be when we look at the hourly chart) is that a lot of deceleration occurred on Friday, making this phenomenon likely. Also, as mentioned above, we are within a few points of retracing .382 of the decline from 2082 -- another reason to expect a correction to start on Monday. We’ll have to see if it is, in fact, a correction or the resumption of the primary trend. Even if we fail to go higher, we could remain in this area for a few days, making a distribution pattern in preparation for the next decline. If only a correction, we would be completing wave “a” of an a-b-c pattern, most likely starting “b” on Monday. Since most analysts agree that we have started a bear market, I would limit myself to these options concerning market behavior over the next week or ten days instead of expecting last week’s action to be the completion of a large corrective pattern from the 2135 top with the prospect of a resumption of the long-term uptrend.
That we were coming into a low was forewarned by some minor positive divergence in the SRSI, and plenty of divergence in the A/D oscillator below -- usually the early bird. If, as expected, this is a bear market rally, it will be brief and sharp. The latter characteristic has already been satisfied with a 90-point surge in three days. For this reason, I would not expect the momentum indicators to extend to their fullest, especially the MACD which should show little upside progress before the beginning of the next downtrend.
Hourly Chart
During its entire decline from 2082, the downtrend line had to be readjusted a couple of times, but by small increments. The final plunge was climactic and even went outside of its lower channel line instead of exhibiting the normal pattern of deceleration which precedes a reversal. On the first attempt at reversing, SPX was stopped at the channel top, but after a 4-hour correction, blasted through on Friday. Note however, that after the first hour surge, nothing much happened. In addition, the entire rally has taken the form of an ascending wedge with an a-b-c pattern in place. When price breaks outside of a wedge, it tends to retrace back to the wedge’s point of origin, and since we are in a very volatile environment, it is entirely possible that the correction will be a violent decline to Wednesday’s low. This is far from a guarantee, and we could simply hold at the August low (about 1867) and extend the corrective rally to the 50% retracement point.
Adding to the perception that we are near the end of this rally phase, the deceleration is clearly visible in the momentum indicators, with the A/D oscillator showing negative divergence and already in the process of turning.

XBD (American Securities Broker/Dealer)
This week, we’ll take a look at XBD’s recent performance. It has grown increasingly weaker than SPX lately, starting with its September low going beyond the August level, and its recovery from that low failing to match that of SPX. This relative weakness continues with XBD reaching the low of its long-term bearish channel while SPX remained above. But where this weakness really shows is in the kind of rally that XBD experienced from last week’s low. Even though it did break outside of its short-term downtrend line, this action probably does not even deserve to be called a rally, but only a mere bounce. Look at how far it is from retracing to its .382 level. If we want some sign that there is more correction ahead, this index gives it to us.

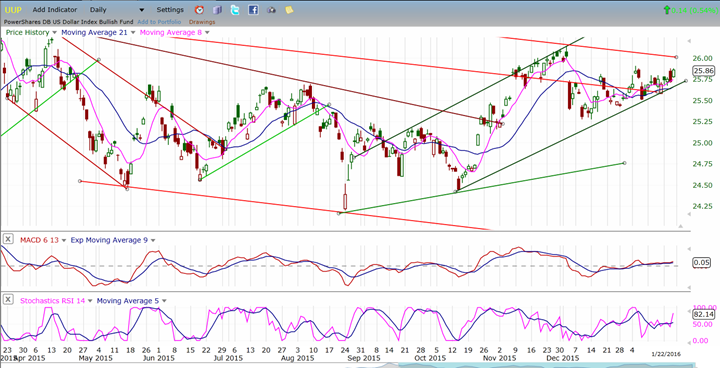
UUP (Dollar ETF)
The dollar is hanging in there and may even try to move out of its consolidation pattern. There is a hint of it in the indicators.
GLD (Gold Trust)
GLD has held its gains but has not been able to extend them at a time when cycles were favorable. This time frame is passing quickly and that could turn its price down once again in the near future; if so, it could be a matter of just holding the low and expanding the base, or perhaps even going for the 97/98 projection -- especially if the dollar manages to make some upside headway.

USO (United States Oil Fund)
USO finally reached my long-standing 8 projection target, but this initial rebound is not likely to lead to a major reversal. It is still possible that it will make a new low, although it would probably be only fractional. WTIC still has a potential for a slightly lower projection to about 25. Even if oil has essentially found its low point (for now, at least) that does not mean that it’s necessarily going to have a lasting positive effect on stocks. After this kind of a decline, and considering the fundamentals, a long period of base building is likely. In that case, the initial rejoicing in stocks will soon fade.

Summary
After an extended period of weakness during which it exceeded its August low, SPX finally found a temporary bottom and, after a climactic finish, started a counter-trend rally which looks just about complete. It’s now a question or whether this is all we get before continuing the correction or if, after a brief consolidation, there is another up-phase for this rally.
********
FREE TRIAL SUBSCRIPTON
Market Turning Points is an uncommonly dependable, reasonably priced service providing intra-day market updates, a daily Market Summary, and detailed weekend reports. It is ideally suited to traders, but it can also be valuable to investors since highly accurate longer-term price projections are provided using Point & Figure analysis and Fibonacci projections. Best-time reversal estimates are obtained from cycle analysis.
For a FREE 4-week trial, send an email to: [email protected]
For further subscription options, payment plans, weekly newsletters, and for general information, I encourage you to visit my website at www.marketurningpoints.com. By clicking on "Free Newsletter" you can get a preview of the latest newsletter which is normally posted on Sunday afternoon (unless it happens to be a 3-day weekend in which case it could be posted on Monday).
The above comments and those made in the daily updates and the Market Summary about the financial markets are based purely on what I consider to be sound technical analysis principles. They represent my own opinion and are not meant to be construed as trading or investment advice, but are offered as an analytical point f view which might be of interest to those who follow stock market cycles and technical analysis.

When Andre Gratian was a stock broker years ago, a friend introduced him to technical analysis of the market. Consequently, it is not an exaggeration to say that Andre fell in love with this approach! Ever since then, it has become an increasingly important part of his professional life. Gratian has studied the works of Wyckoff, Edwards & Magee, Edward J. Dewey (cycles) and many others. However, one of my most profitable undertaking has probably been to study Point & Figure charting, which he finds invaluable in analyzing stocks and indices. If he were restricted to one methodology, this is the one that he would choose. This well-rounded background has given him what he feels to be a special insight into the stock market, facilitating the recognition of meaningful patterns and the ‘turning points’ in all trends, whether they be short or long term. Andre feels very comfortable discussing the stock market and passing on meaningful information to others. His subscribers include individuals and money managers throughout the world. Moreover, his Newsletters are currently published on several financial sites, here and abroad.
More from Gold-Eagle


