Technical Analysis Of The Markets


Current Position of the Market
SPX: Long-term trend – The bull market is continuing with a top expected in the low 3000s.
Intermediate trend – The intermediate correction from 2873 has ended and a new intermediate uptrend has started with the bottoming of the 40-wk cycle on 5/29.
Analysis of the short-term trend is done on a daily basis with the help of hourly charts. It is an important adjunct to the analysis of daily and weekly charts which discusses the course of longer market trends.
SPX Unshackled
Market Overview
With the 40-week cycle having made its low and the corrective triangle structure completed, the last obstacle in the way of a new uptrend was the three-plus weeks of congestion that formed just prior to the cycle low. Now that it has been surpassed, SPX is free to aim for the top of the bull market which started in March 2009. A target of 3000 and more should be met over a period of several months, with consolidations and corrections along the way which will vary in size and length.
Now that we have the beginning of a clear uptrend confirmed, the Point & Figure charts have already established a specific target for the top of this bull market and, thanks to Eric Hadik ([email protected]), we have a fair idea of when this top will come (a hint: it will be this year, not next). Armed with this information, our subscribers will have a definite edge in making their market decisions.
Over the short-term, we have nearly arrived at a level from which a short-term consolidation should take place, and this could come as early as Monday. After a brief pull-back, the new uptrend, fueled by a brand new 20-wk cycle, should take prices to the vicinity of the former all-time high.
Chart analysis
(The charts that are shown below are courtesy of QCharts)
SPX Daily Chart
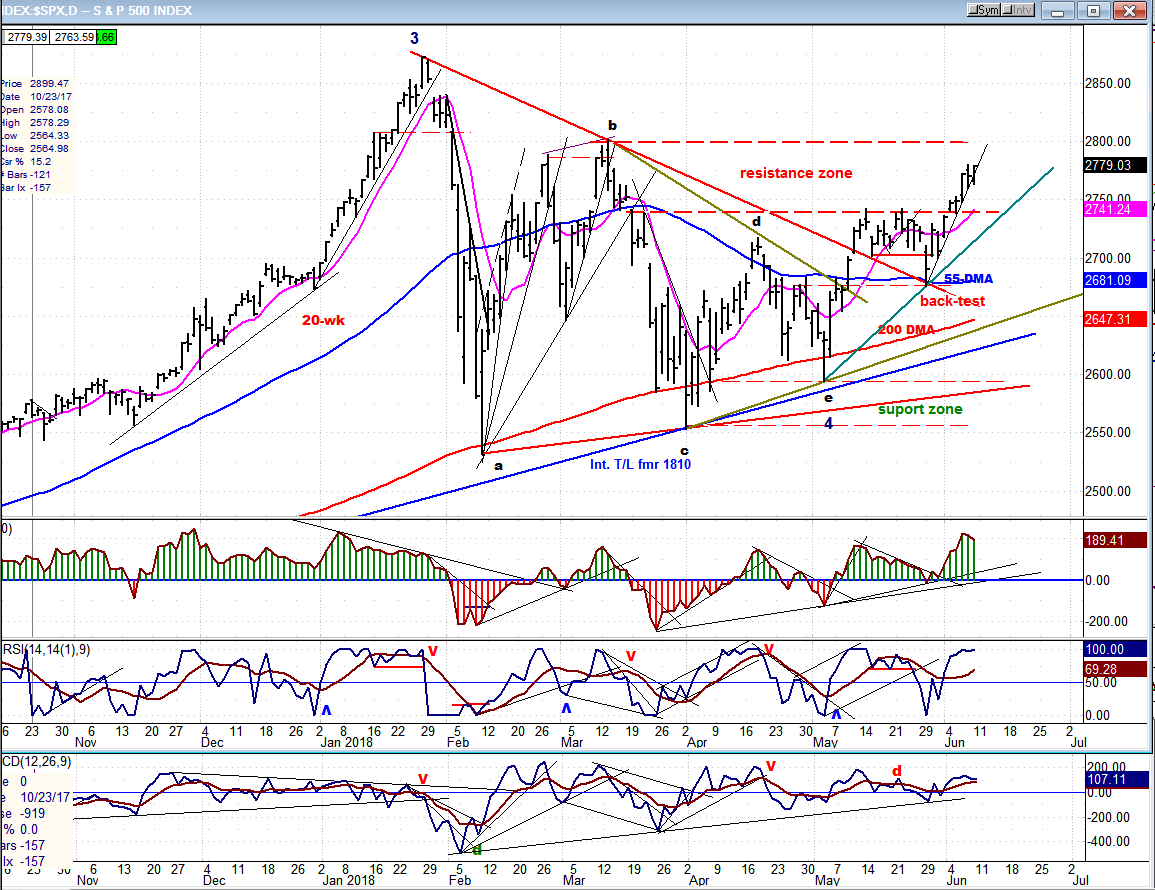
In retrospect, the 40-wk cycle probably made its low when SPX back-tested the red downtrend line for the second time on 5/29. This was the last retracement of significance in the index before it overcame the top of the congestion pattern and extended the new uptrend which had its start in early May, after the correction ended in the form of a triangle. Some have mentioned that date as the low of the 40-wk cycle, but that would have made the length of the last 20-wk cycle only 16 weeks, which I feel is much to short for a cycle which has historically shown remarkable phase regularity.
From the purported cycle low of 2676.86 to last Friday’s close of 2779, the index has advanced 102 points, and is ready for a short consolidation. This estimate is made with an analysis of structure, cycles and P&F projection which all point to an imminent short-term top. The length and depth of the retracement should be very brief and shallow, and could be determined by the next minor cycle low which is not very far away. The need for a consolidation can also be seen in the condition of the momentum oscillators which are at the top of their normal ranges and have started to reverse, as well as that of the A/D indicator which has shown increasing weakness in the past few days. All this will be even more apparent when we examine the hourly chart, next.
After this short pause in the uptrend, the index should go and challenge the former high of 2872; and if this takes place toward the end of June, a longer and deeper consolidation/correction pattern should follow.
SPX Hourly Chart
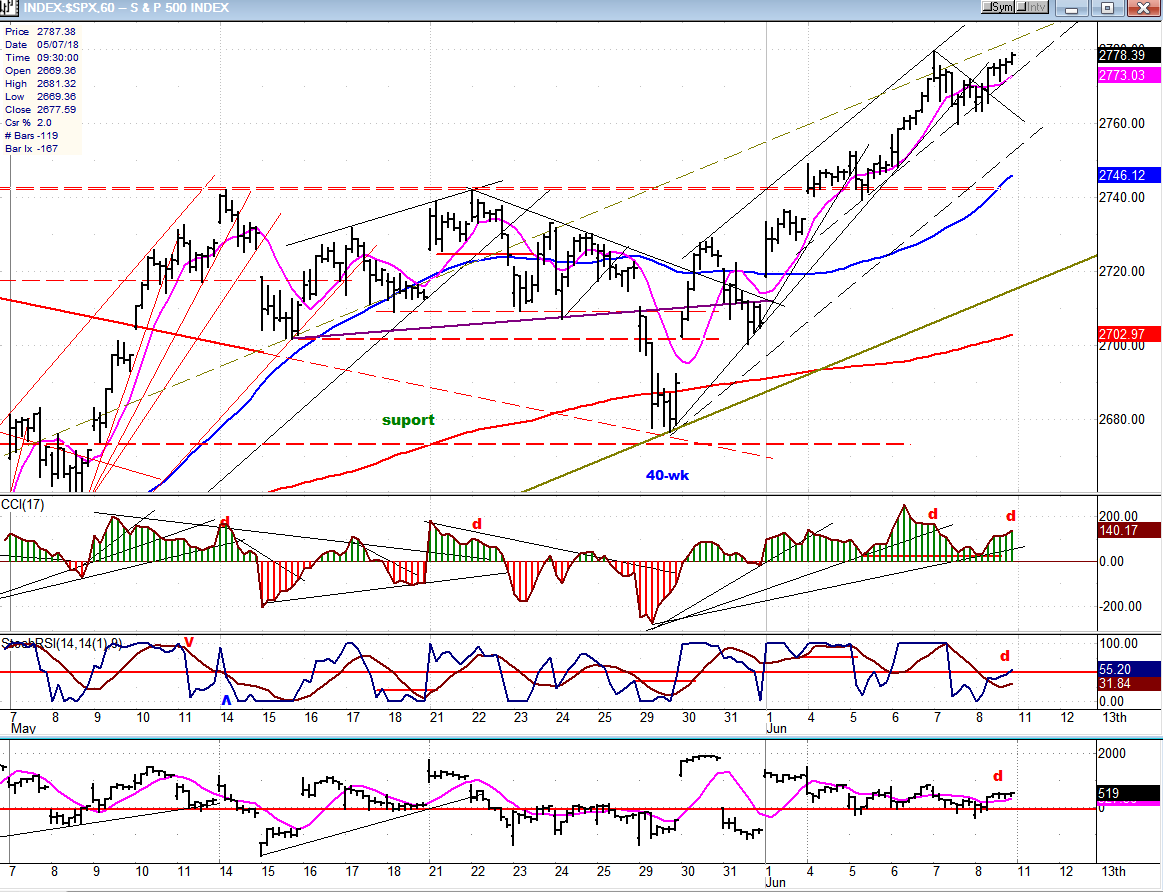
We can see on this chart that the final steep drop of about 65 points, followed by an immediate reversal and rally which matched the preceding decline in reverse, is probably all the evidence we need to pin-point the 40-wk cycle low, especially since this occurred within a couple of days of its ideal reversal date.
In last week’s letter, I mentioned that there were a couple of minor cycles which could bring about a final pull-back before we broke out of the congestion pattern, but they were overwhelmed by the strength of the new cycle which was only two weeks old, and they could only create a little sideways consolidation pattern of a few hours before the buyers returned in force and pushed prices higher.
The P&F chart pattern that was formed by the congestion phase just before the cycle low was transformed from a potential distribution phase to one of accumulation. A move above 2650 was expected to be a break-out which would result in a rally to 2770-2780, followed by a brief pull-back, and then an uptrend extension which would cause SPX to challenge its former high of 2872 before a more substantial correction takes hold.
By Friday’s close, strong warnings of an imminent top were issued by the three oscillators, which all showed negative divergence. This is enhanced by the proximity of a minor cycle low.
SPX vs TRAN, IWM (daily charts)
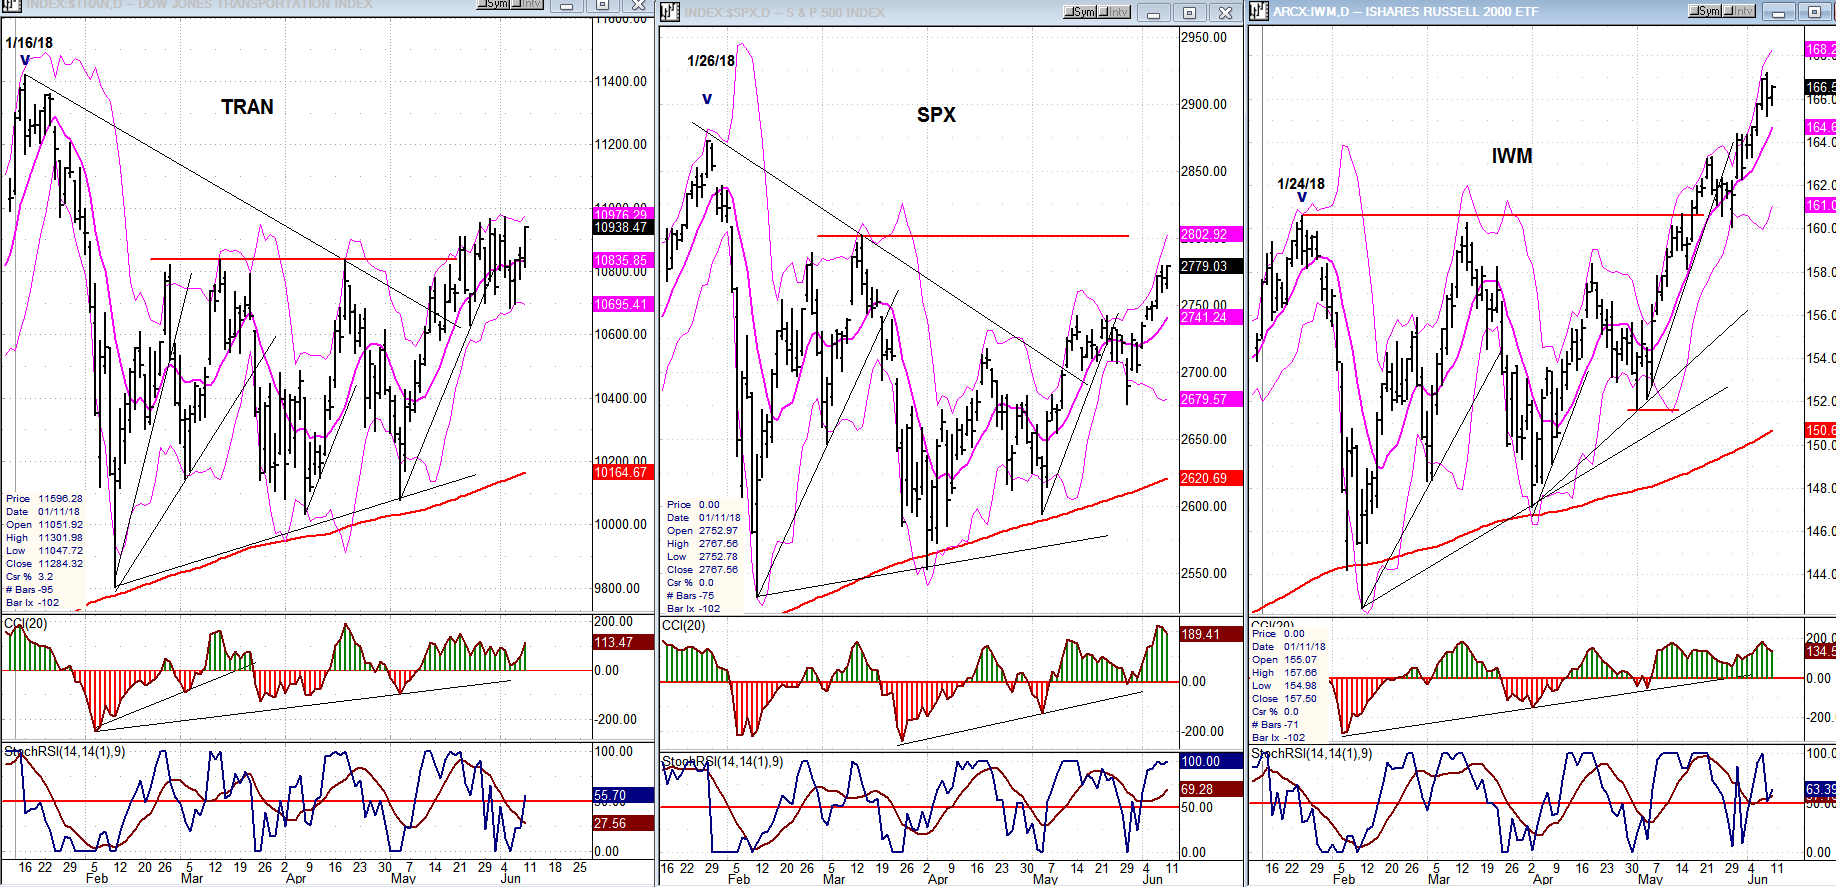
IWM has continued to push ahead of the other two indexes followed by TRAN, with SPX lagging behind. It would be more worrisome for the market if the roles were reversed! Best guestimate is that SPX will catch up and eventually surpass the others. The time to be cautious will be when negative divergence develops between SPX and the two leading indicators. As usual, TRAN should be the first to give a warning, but this is still weeks away.
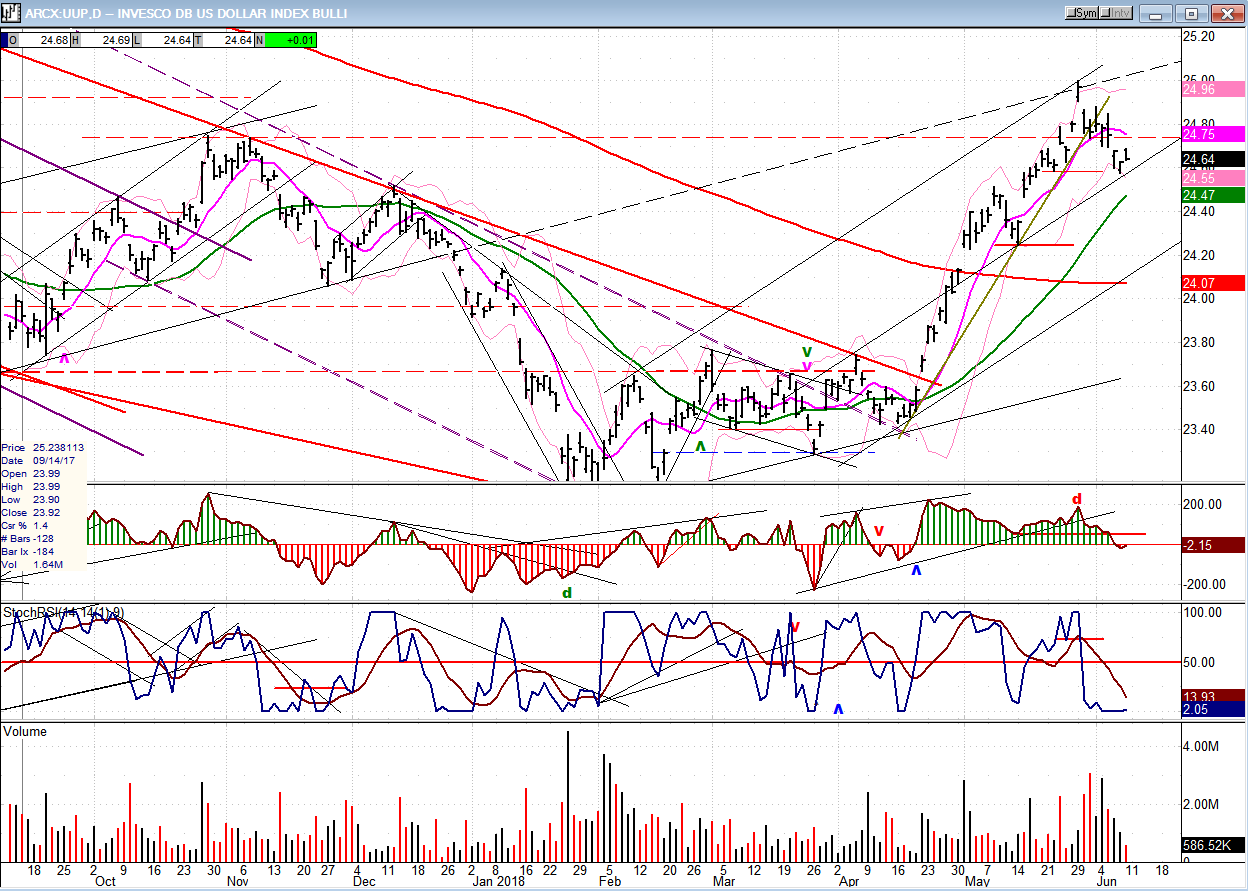
UUP (Dollar ETF) Weekly
After making and island reversal, UUP has started to correct. So far, there has only been mild selling pressure. This could change after next week since a 26-wk low in gold may have an opposite effect on the dollar. Let’s give it a little more time and review the progress next week.
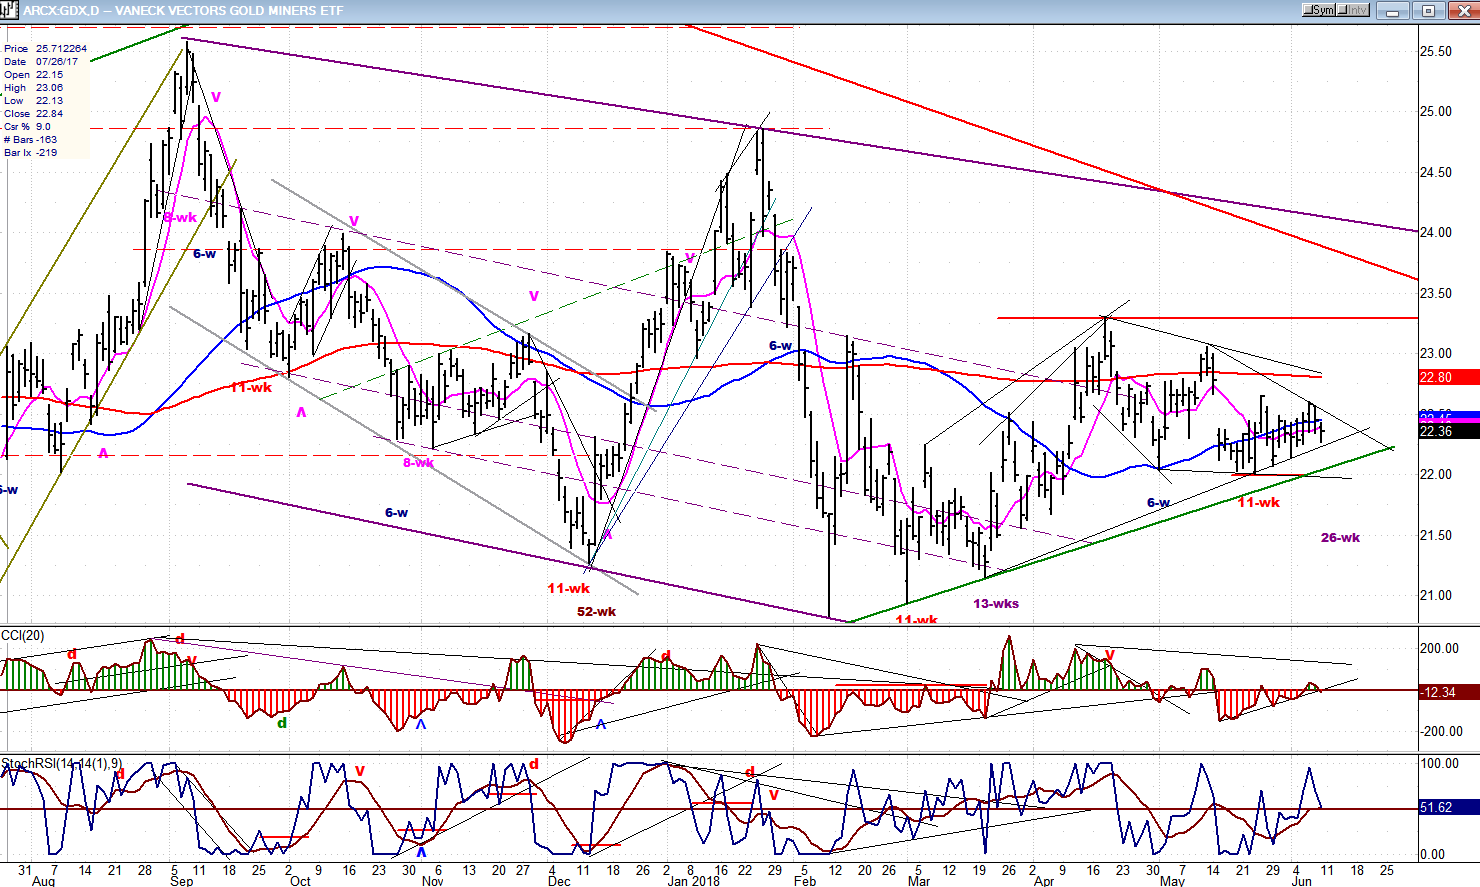
GDX (Gold Miners ETF)
The action in GDX is improving slowly with the chart pattern showing what looks like accumulation in preparation for an upside break-out. With the 26-wk low due ideally next week, and if no serious weakness is created over the next few days, we should be on alert for a potential upside thrust by GDX.
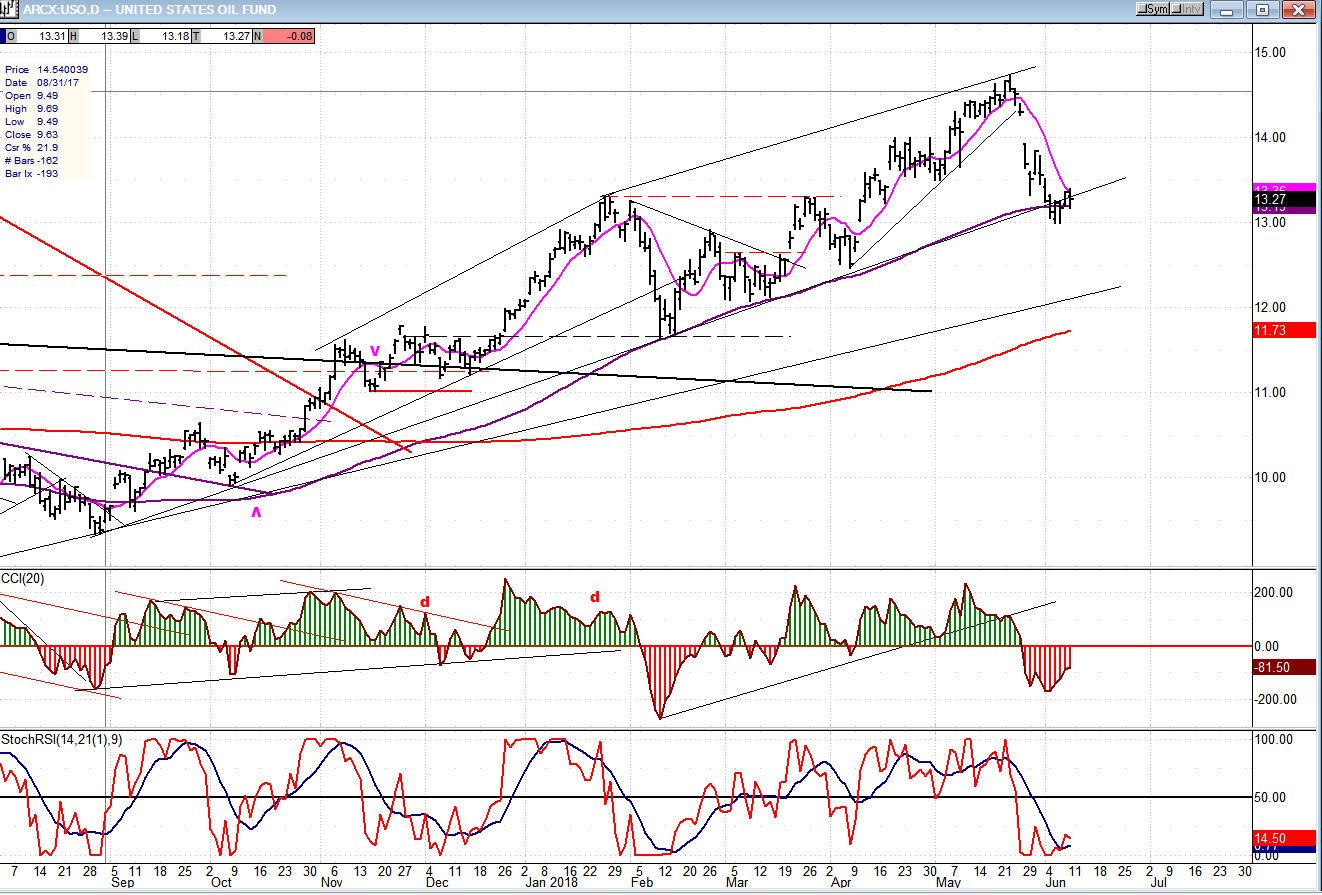
USO (United States Oil Fund)
USO continues to correct. It may be ready for a small bounce, but nothing much should be expected until this consolidation/correction has run its course.
Summary
SPX is probably on its way to challenge its former all-time high of 2872, but not before at least one little consolidation along the way which has a good chance of starting on Monday. I expect it to be brief and shallow. The next high point in the market should materialize toward the end of this month and could be important enough to deserve some caution.
*********
FREE TRIAL SUBSCRIPTON
With a trial subscription, you will have access to the same information that is given to paid subscribers, but for a limited time period. I think you will find that knowing how far a move can carry is one of the most useful benefits of this service, whether you are a trader or an investor -- especially when this price target is confirmed by reliable indicators which give advance warning of a market top or bottom. Furthermore, cycle analysis adds the all- important time element to the above price projections.
For a FREE 4-week trial, further subscription options, payment plans, and for general information, I encourage you to visit my website at www.marketurningpoints.com.
The above comments about the financial markets are based purely on what I consider to be sound technical analysis principles. They represent my own opinion and are not meant to be construed as trading or investment advice, but are offered as an analytical point of view which might be of interest to those who follow stock market cycles and technical analysis.

When Andre Gratian was a stock broker years ago, a friend introduced him to technical analysis of the market. Consequently, it is not an exaggeration to say that Andre fell in love with this approach! Ever since then, it has become an increasingly important part of his professional life. Gratian has studied the works of Wyckoff, Edwards & Magee, Edward J. Dewey (cycles) and many others. However, one of my most profitable undertaking has probably been to study Point & Figure charting, which he finds invaluable in analyzing stocks and indices. If he were restricted to one methodology, this is the one that he would choose. This well-rounded background has given him what he feels to be a special insight into the stock market, facilitating the recognition of meaningful patterns and the ‘turning points’ in all trends, whether they be short or long term. Andre feels very comfortable discussing the stock market and passing on meaningful information to others. His subscribers include individuals and money managers throughout the world. Moreover, his Newsletters are currently published on several financial sites, here and abroad.


