Technical Analysis Of The Markets


Current Position of the Market
SPX: Long-term trend – Bear market
Intermediate-trend – Bear market rally
Analysis of the short-term trend is done on a daily basis with the help of hourly charts. It is an important adjunct to the analysis of daily and weekly charts which discusses the course of longer market trends.
Counter-Trend Rally
Market Overview
“…it is becoming increasingly likely that the initial low of the bear market will occur at about 2600.”
That forecast published in last week’s letter turned out to be correct, as SPX made a climactic low at 2604 and immediately rallied 70 points in two days to seal the bottom of the A-wave of the bear market. This was followed by the typical backing and filling which comes after such a move. The retracement was about normal, a little less than 50% to 2640 before the rally continued another hundred points to 2741; until last Thursday where, for all intent and purposes, it should have topped had it not been for some very timely positive news about the trade war released by the administration. This had the effect of pushing it up to 2756 on Friday’s opening, after which it reversed exactly 3 hours later and started a correction down to 2700 before finding support and consolidating until the close. Volatility has not gone away!
What now? 2756 is deemed to be the top of the a-wave of a larger B-wave which should determine the extent of the bear market rally. The current b-wave has only retraced .382 of the rally from 2604 and does not look finished. Therefore, the index should add to its correction by seeing at least a 50% retracement to 2681, and perhaps even lower to 2662 for a .618 target. After this is complete, we can start on the c-wave of the larger B and see where that takes us, although there are some likely parameters already set for the second phase of this rally in a downtrend. Should they be exceeded, we may have to take another look at the notion that the bull market ended at 2941.
Chart Analysis (The charts that are shown below are courtesy of QCharts)
SPX Daily Chart
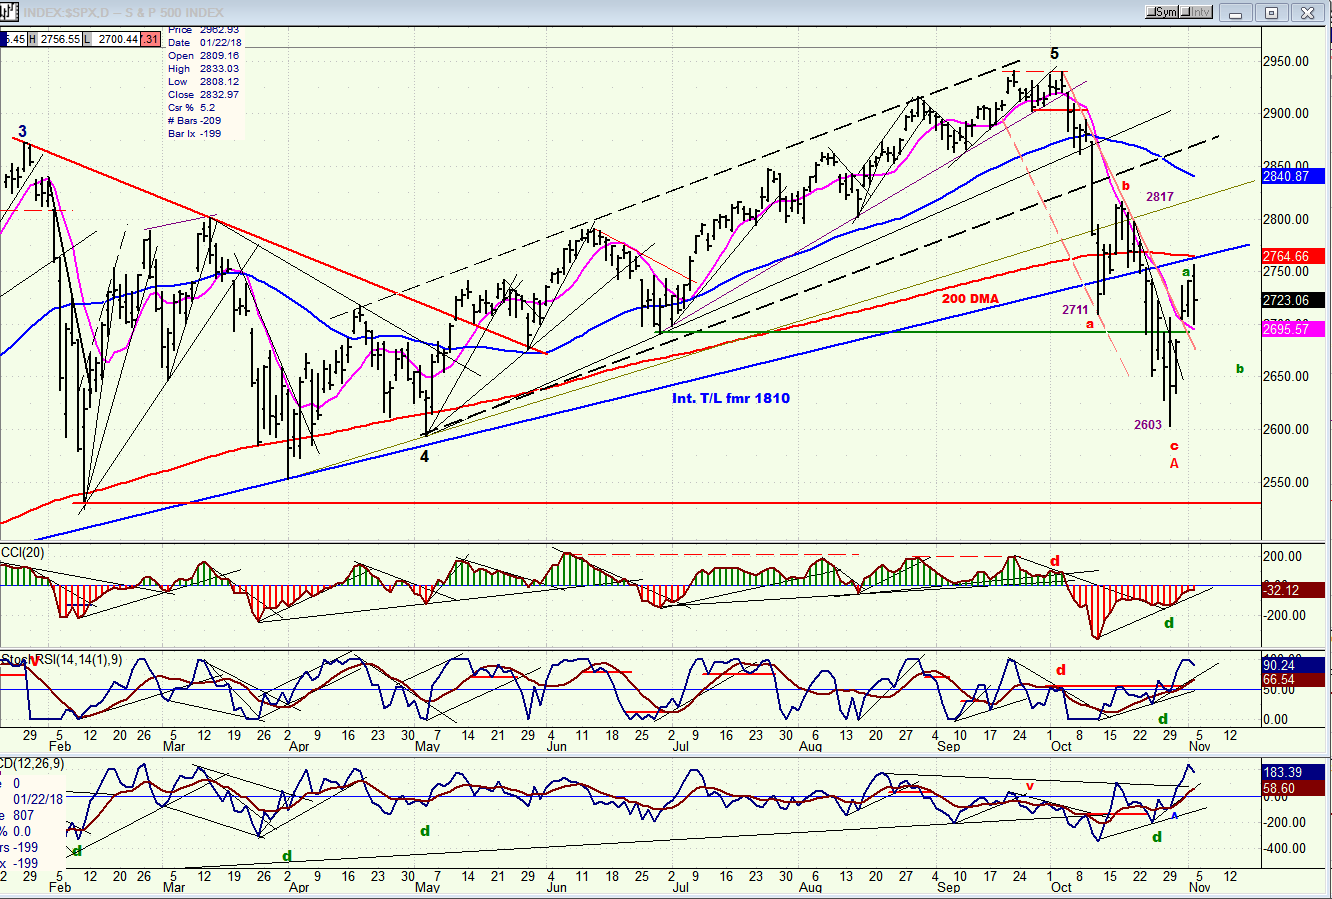
After SPX topped at 2941, the downside momentum of the subsequent selling wave was temporarily arrested by the long term trend line from 2016 and, after a brief rally, the index proceeded to its projected low of ~ 2600 (which turned out to be 2604). That move has created a clear a-b-c pattern for the initial corrective phase of the bear market which can be labeled as wave A. We are currently in a bear market rally whose first rebounding move stopped just below resistance consisting of back-testing the trend line from 1810 and approximating the 200-dma, making this a tough combination to overcome right away. The pull-back from that level has started a near-term correction which found initial support at the 9-dma, and just above the June low -- levels which just happened to coincide with a .382 retracement of the 152-point rally from the 2604 low. (Still think the stock market makes random moves?) On Friday, the index bounced off that support level, but it is not expected to make much more upside progress before continuing its correction and completing the b-wave by retracing .618 to ~2662 (favored) into Wednesday morning after the election results are known.
The B wave is expected to be about 208 points (.618 of the 337-point decline) which would give us a target of about 2812 for the top of the B wave. This is the level where we should be expecting the bear market rally to end and its next down-phase to begin. It took four days to get from the 2603 low to the top of the a-wave. I don’t want to impose too much time symmetry on the market but, if the b-wave completes on Wednesday, we could be done with wave C and resume the primary trend by the beginning of next week. The market has been be extremely volatile, and if this continues for the next week this could certainly happen -- with an emphasis on could! If the counter-trend rally goes appreciably beyond 2812, it should cause us to rethink our premise that we’ve seen the high of the bull market.
The two lower oscillators are already reversing after reaching the top of their range, but the CCI is still in the red. I would expect it to become positive by the time the B-wave rally is over, but it may not stay in that condition very long!
SPX Hourly Chart
“If this continues until the very end of the c-wave, it would be reasonable to expect another rally to the top trend line before a plunge to the final low.”
As you can see on the chart, this is in fact what happened! On Monday morning, a gap opening took the index up to the top trend line (blue asterisk), and it was all downhill into the 2604 low after that.
After the a-wave of the correction completed, the b-wave retraced exactly 50% of the decline from the top before completing the b-wave, and the c-wave was very close to duplicating the a-wave. Fibonacci retracements are very helpful in identifying structural price objectives. This is why it is the foundation of the EWT system. I have posted the Fib retracements of the first rally from the low. As pointed out above, there were other reasons for the index to find support at the 2700 level but, it was also a .382 retracement of the 152-point rebound rally from 2604.
For reasons which also involve Fib measurements beyond what is being presented here, I favor the low of this pull-back to end at about 2662 on Wednesday morning (marked on the chart). Although this is speculative, it is in part based on more Fib calculations that I won’t go into. The oscillators are still in a downtrend, but if we start up on Monday morning, they could quickly turn up also and trigger a buy signal to nullify our expectations.

DJIA, SPX, NDX, IWM (Daily)
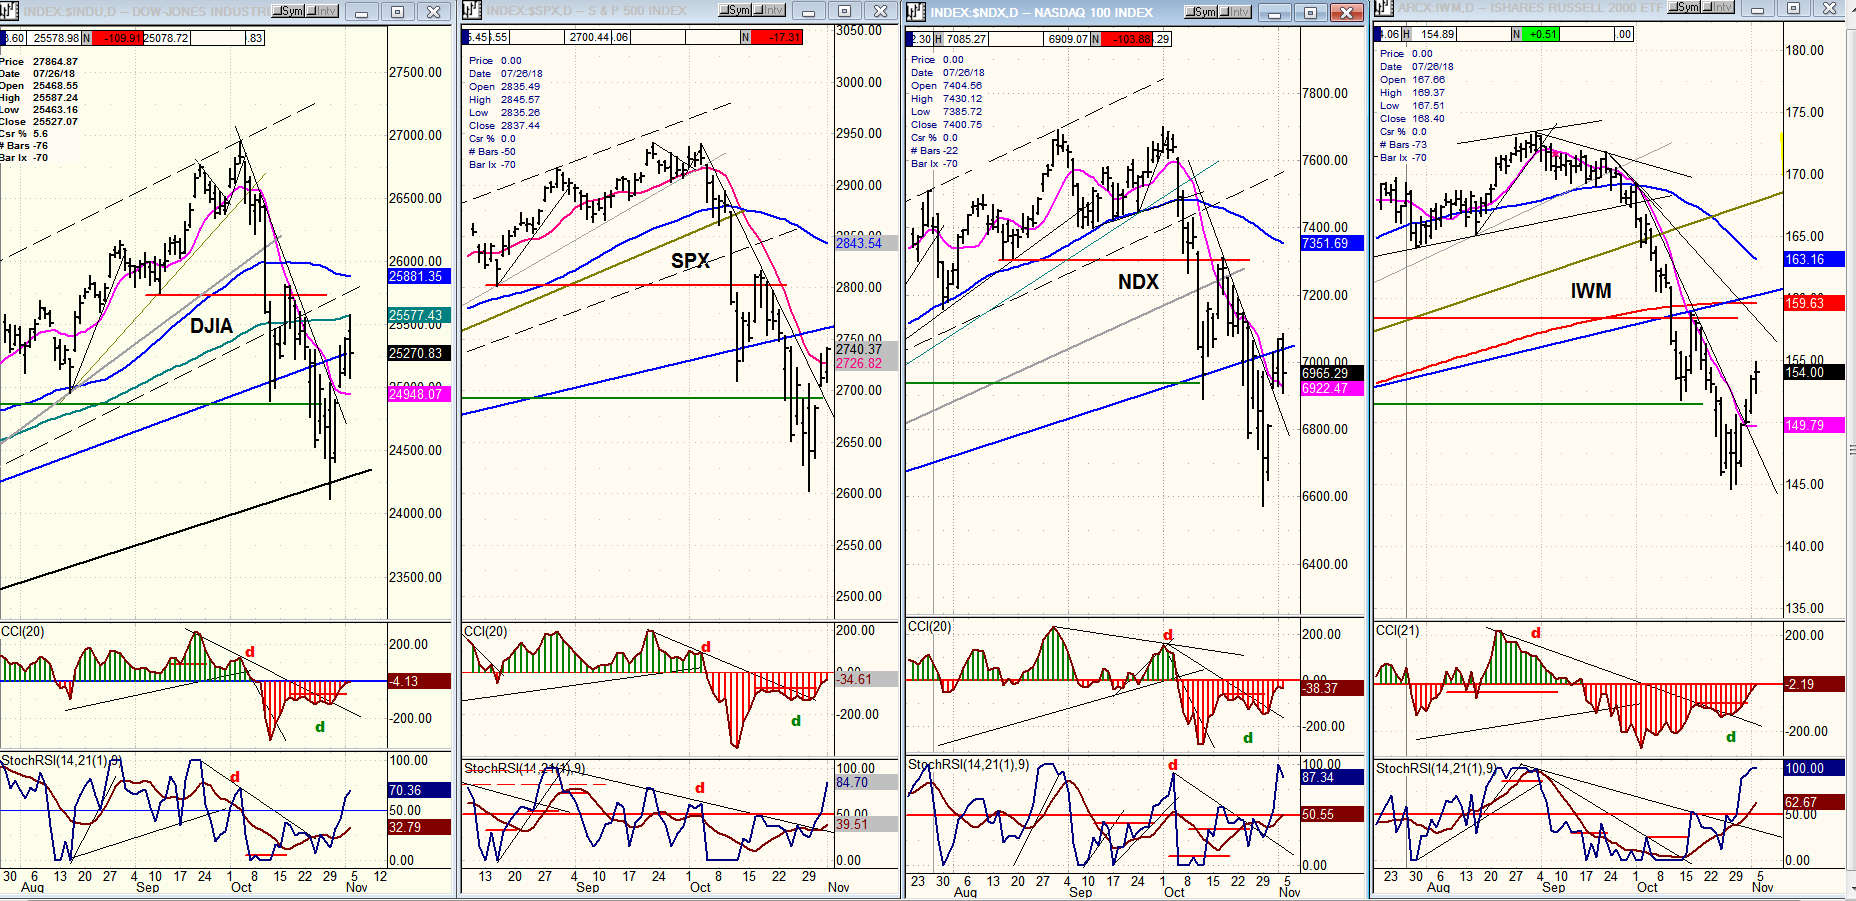
“DJIA remains the strongest, but IWM apears to be falling in line with the others instead of being the weakest. That too, could mean that we are aproaching a low point in this downtrend.”
Here, we had another hint that we were about to reach the low. There was also one more warning that came from the oscillators which had been showing positive divergence for the past few days. IWM is now in sync with the others over the short-term, but behind on the longer term since it is well below its long-term trend line.
I am not sure if will give us a warning about the top of the countertrend rally.
UUP (Dollar ETF) Wkly
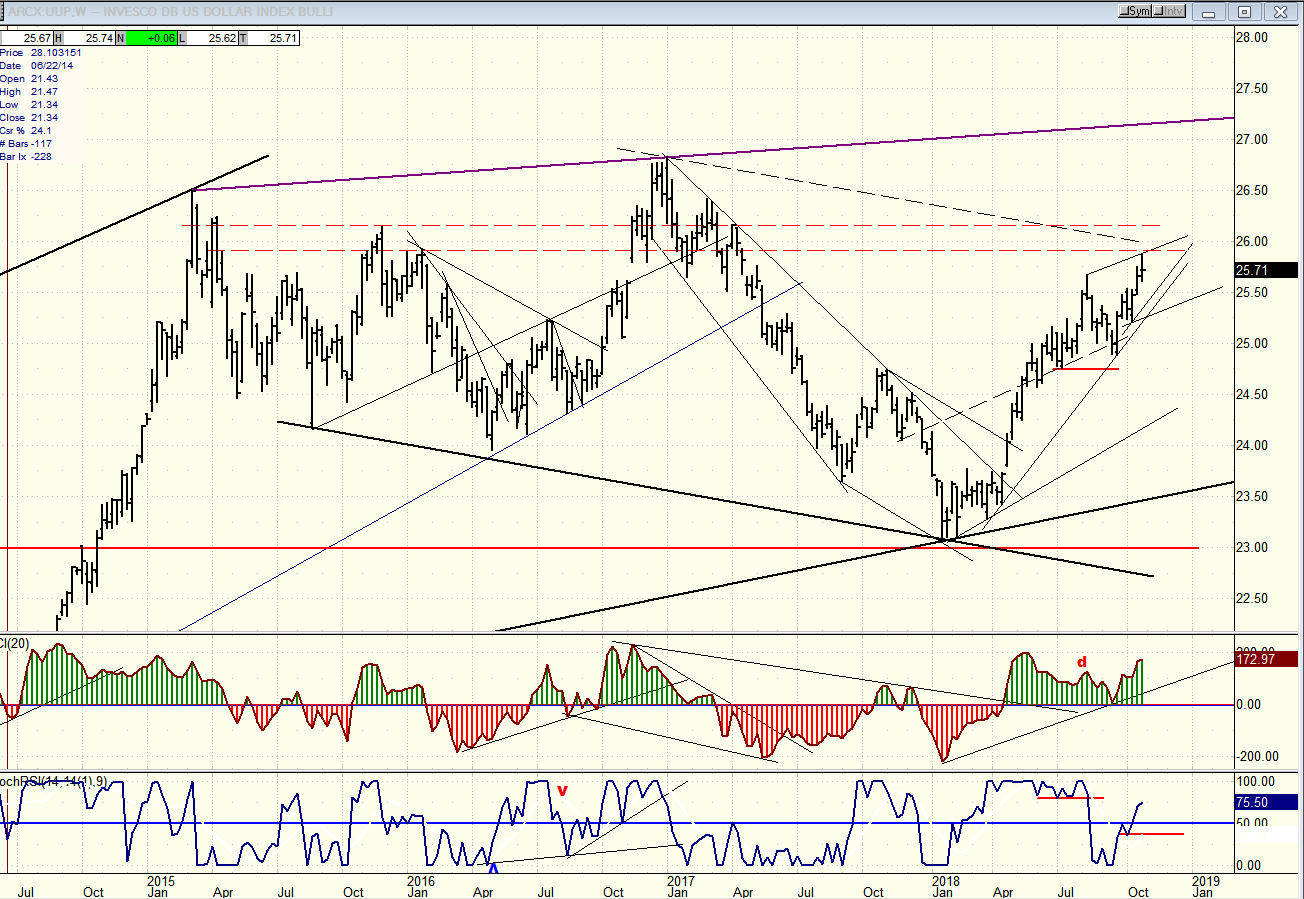
The weekly chart of UUP clearly shows its strength. The top of the intemediate move may still be a few weeks away at about 26-26.5. UUP is a slow mover, so we shouldn’t expect it to get there quickly. Also, theCCI is still firmly in the green with no sign of divergence appearing in that last thrust, and SRSI is still rising.
GDX (Gold Miners ETF) Daily
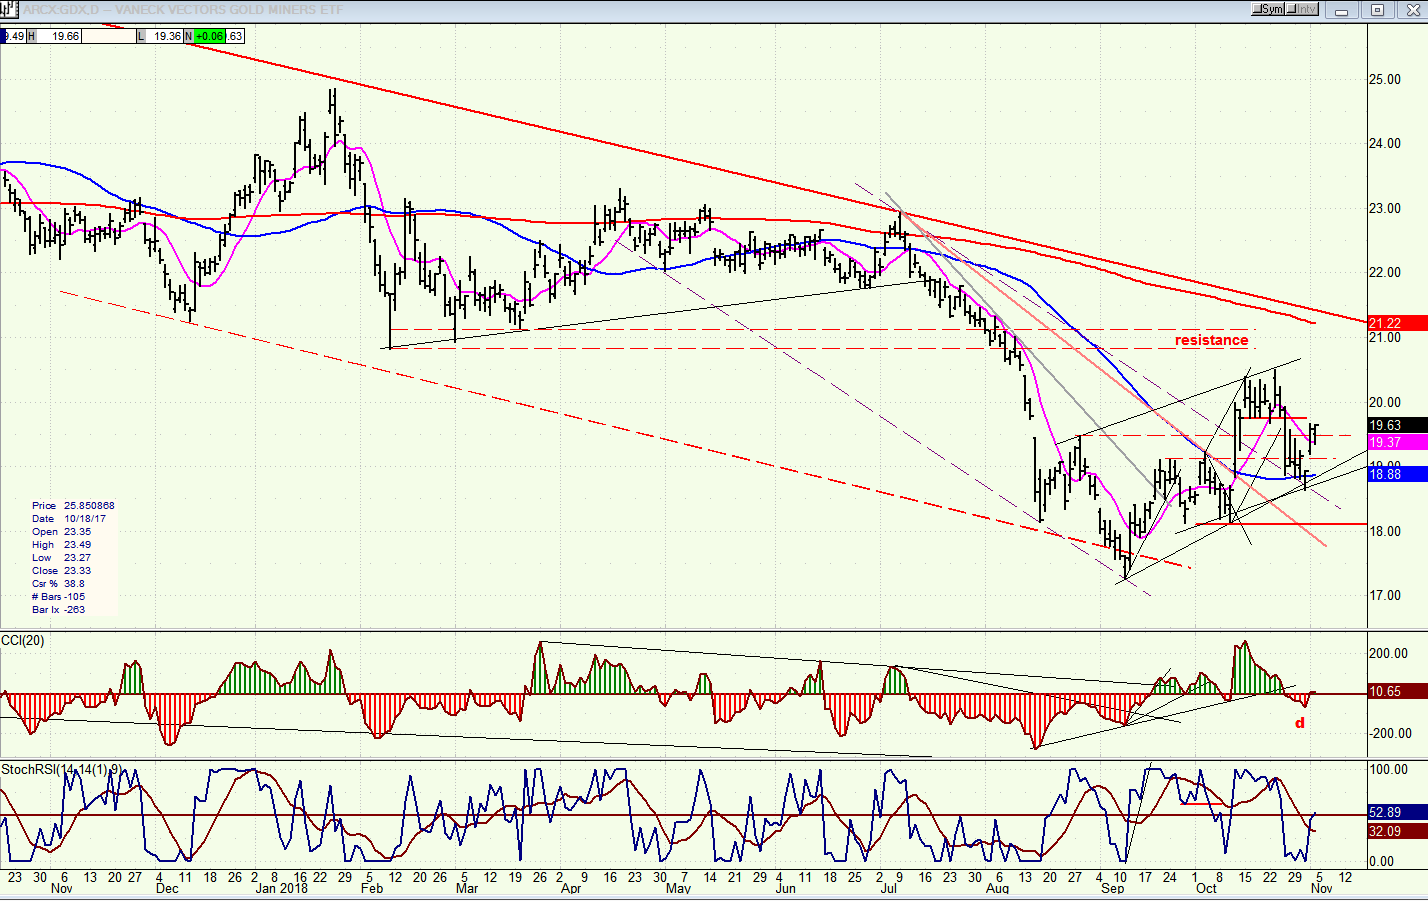
By contrast, GDX is building some negative divergence in the CCI, but it could still reach the 21.00 target if it can quickly overcome the negative divergence, which is building up at the hourly level. Its action over the next week will be critical.
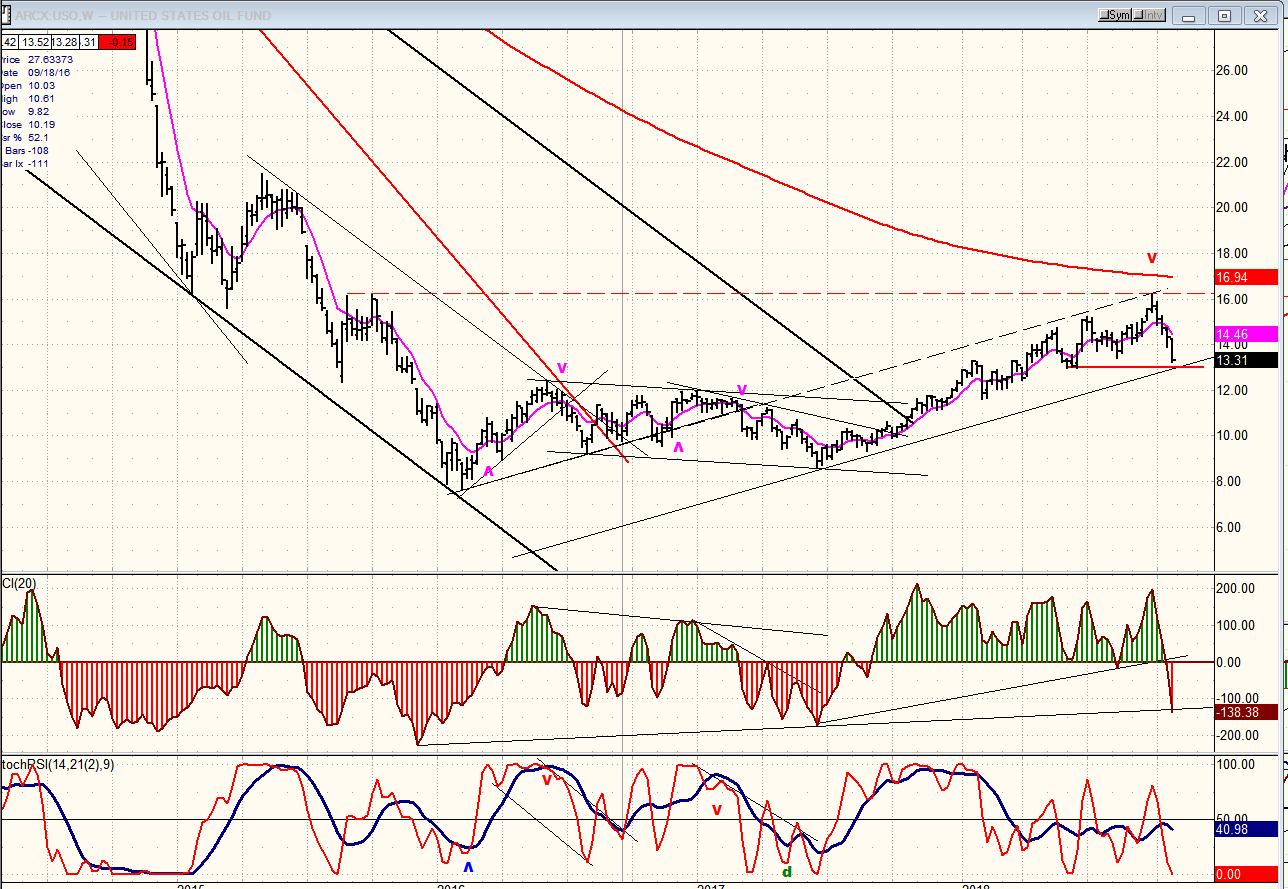
USO (United States Oil Fund) Wkly
On the weekly chart, aside from the fact that USO had a P&F projection to 16, it’s easy to see why it found resistance where it did. There are several signs that suggest that this is a correction in an uptrend and that after dropping to about 13.00, the index should continue its rally to about 17.00-17.50 before starting a deeper correction.
Summary
SPX has completed the a-wave of the counter-trend rally and is working on the b-wave which could be over by mid-week. After that, it could quickly complete the c-wave, which will also be the B wave of the bear market. After reaching the suggested 2812 (ca.) level, it will be vulnerable to continuing the primary downtrend. Details are given above.
*********
FREE TRIAL SUBSCRIPTON
With a trial subscription, you will have access to the same information that is given to paid subscribers, but for a limited time period. I think you will find that knowing how far a move can carry is one of the most useful benefits of this service, whether you are a trader or an investor -- especially when this price target is confirmed by reliable indicators which give advance warning of a market top or bottom. Furthermore, cycle analysis adds the all- important time element to the above price projections.
For a FREE 4-week trial, further subscription options, payment plans, and for general information, I encourage you to visit my website at www.marketurningpoints.com.
The above comments about the financial markets are based purely on what I consider to be sound technical analysis principles. They represent my own opinion and are not meant to be construed as trading or investment advice, but are offered as an analytical point of view which might be of interest to those who follow stock market cycles and technical analysis.

When Andre Gratian was a stock broker years ago, a friend introduced him to technical analysis of the market. Consequently, it is not an exaggeration to say that Andre fell in love with this approach! Ever since then, it has become an increasingly important part of his professional life. Gratian has studied the works of Wyckoff, Edwards & Magee, Edward J. Dewey (cycles) and many others. However, one of my most profitable undertaking has probably been to study Point & Figure charting, which he finds invaluable in analyzing stocks and indices. If he were restricted to one methodology, this is the one that he would choose. This well-rounded background has given him what he feels to be a special insight into the stock market, facilitating the recognition of meaningful patterns and the ‘turning points’ in all trends, whether they be short or long term. Andre feels very comfortable discussing the stock market and passing on meaningful information to others. His subscribers include individuals and money managers throughout the world. Moreover, his Newsletters are currently published on several financial sites, here and abroad.


