Technical Analysis Of The Markets


Current Position of the Market
SPX: Long-term trend – Bullish, but correcting within the long-term bull market trend.
Intermediate trend – A bearish correction has started which could retrace as low as 2200 before it is complete
Analysis of the short-term trend is done on a daily basis with the help of hourly charts. It is an important adjunct to the analysis of daily and weekly charts which discusses the course of longer market trends.
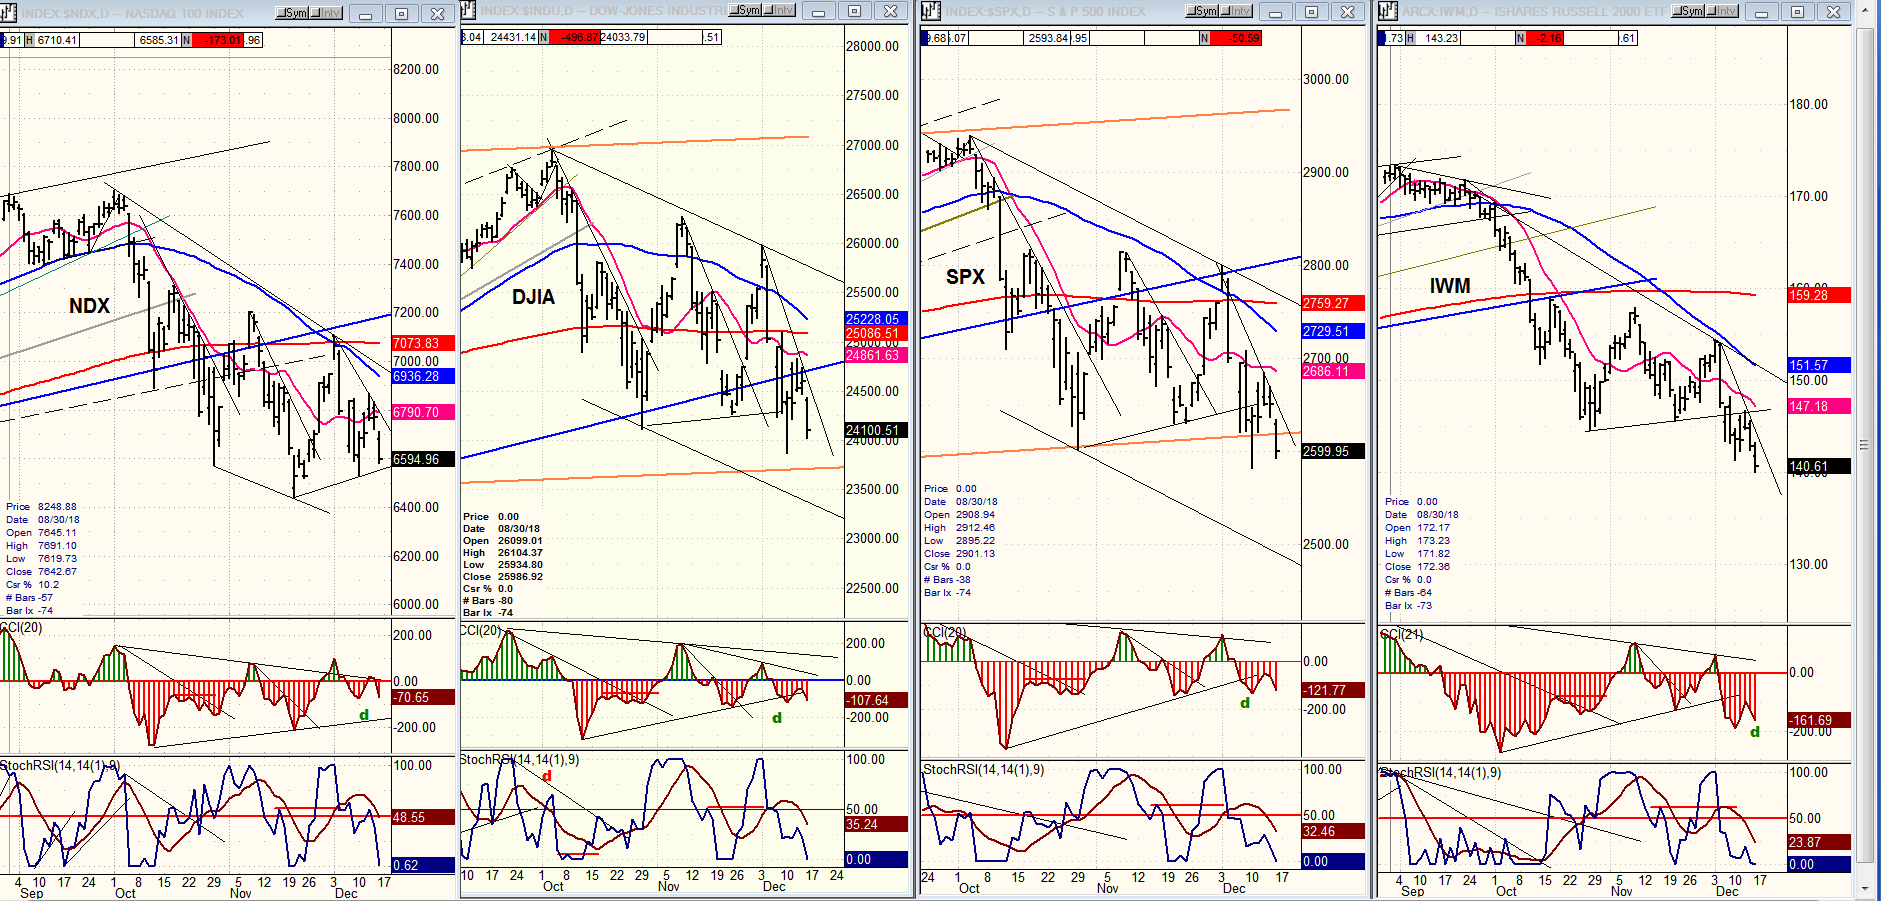
IWM Leading Decline
Market Overview
Market technicians who follow IWM are aware of its propensity for reversing its trend ahead of SPX and DJIA. This was particularly obvious at the last market top when IWM printed its final high price on 8/31, while SPX did so on 9/21, and DJIA on 10/03.
Last Friday, the major indexes re-tested their lows, but our leading index (IWM) closed the week at a new low. That is a warning that the decline of SPX which is already approaching one hundred points is most likely not over, although a brief bounce could take place before we go lower. The hourly indicators are just beginning to show some positive divergence, but it is not the kind of pattern that normally leads to a significant reversal. More work has to be done in the daily and hourly indicators before they are in a position to forecast an important low. And we are supposed to be in a bullish seasonal period which normally generates a Xmas rally! This year, it is going to come late and turn out to be a New Year’s rally.
All this means that the previous low of 2583 is unlikely to hold, and a new low for wave A (which keeps on being pushed forward and lower) will be made, but once in place, it should be followed by a good countertrend rally.
Chart Analysis (The charts that are shown below are courtesy of QCharts)
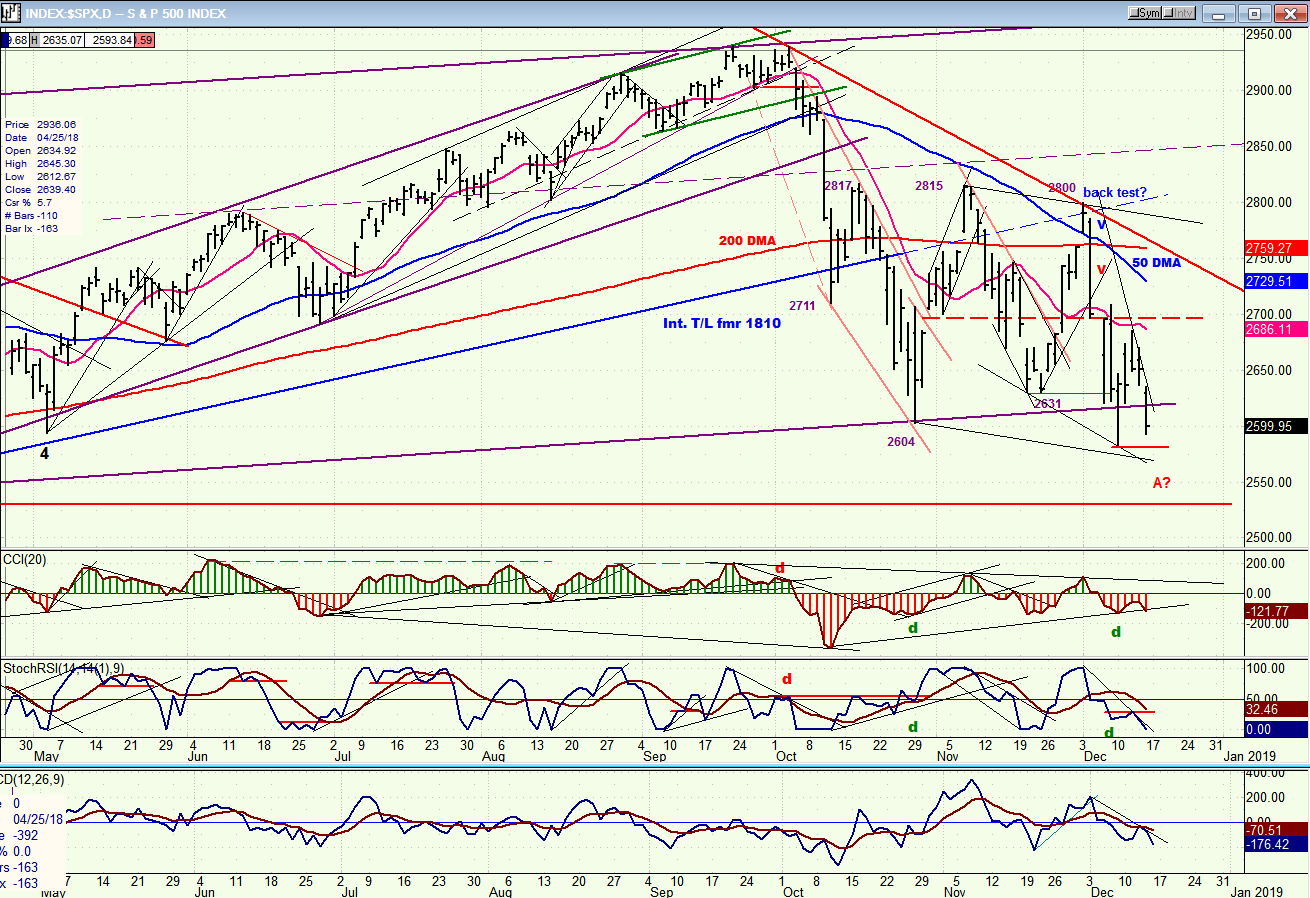
SPX daily chart
The support level which had held the first two lows of the correction above the purple channel line was weakened on the last short-term decline to 2583; this was an intra-day low and the index did close above the channel line at 2637. However, the ensuing rally met with serious selling and could not even reach 2700 before turning down, and the index is again approaching the last low. This almost ensures a new low for SPX on this move, although 2600 could hold it for a few more hours.
The daily oscillators showed minor divergence at the 2583 low, and this led to the ensuing bounce, but they have all turned down again and the two most sensitive ones have already made new lows while SPX is still above 2583. This is another form of negative divergence which should result in a new low before this move is finished. There are several possible targets for this decline, with the most extreme one just above 2500. I have been wondering if we might not have to break below the February low of 2533 to confirm that we have started a bear market before we complete the A-wave.
With the last rally from 2583, I thought that we might have a chance to get back to 2815 one more time, but this may not even be possible for the countertrend rally after we complete wave A. If we get close to 2500 on this decline, even a 0.618 retracement of the total downtrend from 2941 would not get us there.
SPX Hourly Chart
What you see on this chart is not the top of the SPX bull market; the top is off the chart and about 150 points higher. Ever since the initial 337-point decline, the index has moved in a broad sideways pattern (roughly between 2600 and 2800) but lately, it looks as if we are beginning to move out of that range on the downside. Each consecutive top has fallen slightly lower, but since the last decline broke about 20 points lower, and Thursday’s high could not even get halfway to the previous 2800 mark, the recent low of 2683 looks threathened. The bears are gradually gaining control of the intermediate trend and are undoubtedly intent on proving it by making another new low right away.
The move which started at 2685 last Thursday has come down in two phases separated by a downside gap at Friday’s opening. The second phase, which started with that gap, has declined at a steeper angle than the first suggesting that the selling is accelerting. However, the minor positive divergence in the CCI suggests that we may be ready for a bounce in that downtrend before making the final low. The most logical target before we have a good reversal is about 2550, but there are lower P&F counts for the near-term which could be filled, first.

DJIA, SPX, IWM, NDX (daily)
The relative strength position of the four indexes has not changed, but IWM is visibly increasing its weakness over the rest of the market. Last Friday, it made a new low while the others held on to last week’s – for now. By contrast, NDX appears to be doing the opposite: gaining a little, or at least retaining its relative strength of the past two weeks. The weakness in IWM is warning that we may not yet have found a low for this move.
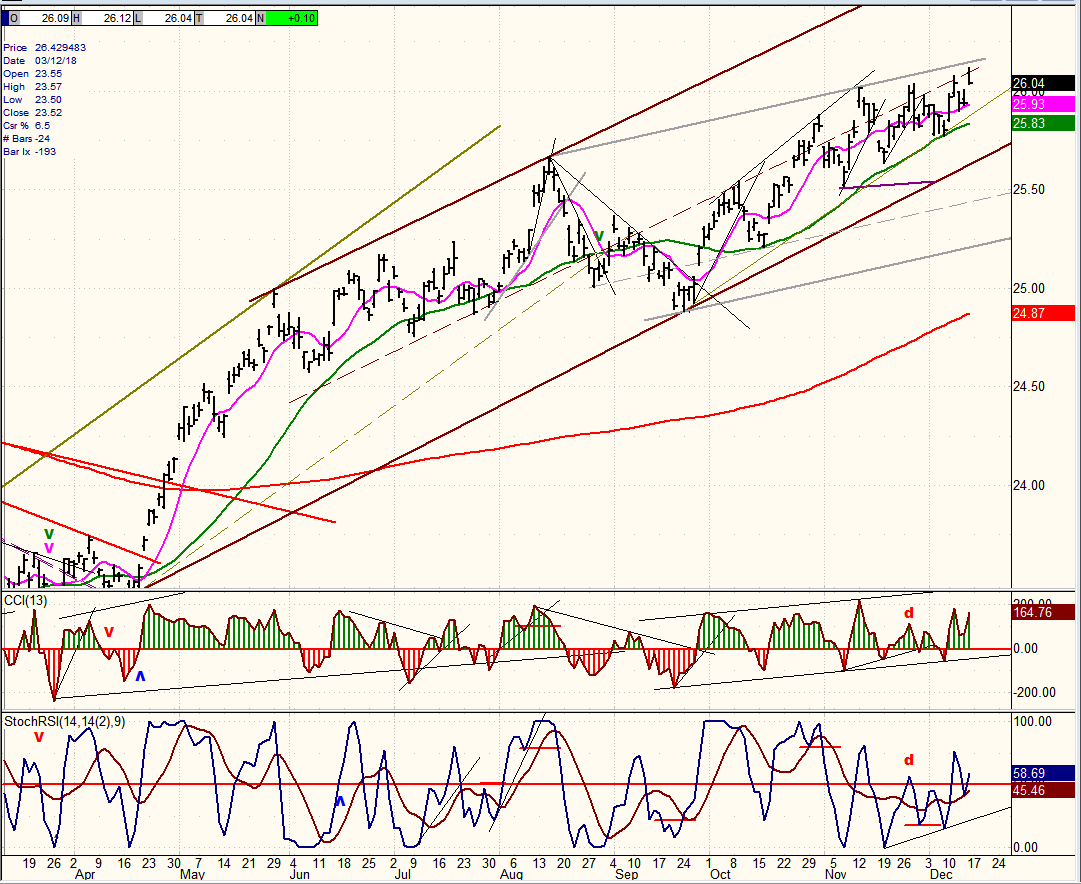
UUP (Dollar ETF)
UUP is the Energizer bunny. It keeps on going and going! I mentioned before that the green 30-dma acts as a flexible trend line which gives it support every time it is touched. I guess we’ll have to wait until it is broken before a correction can start.
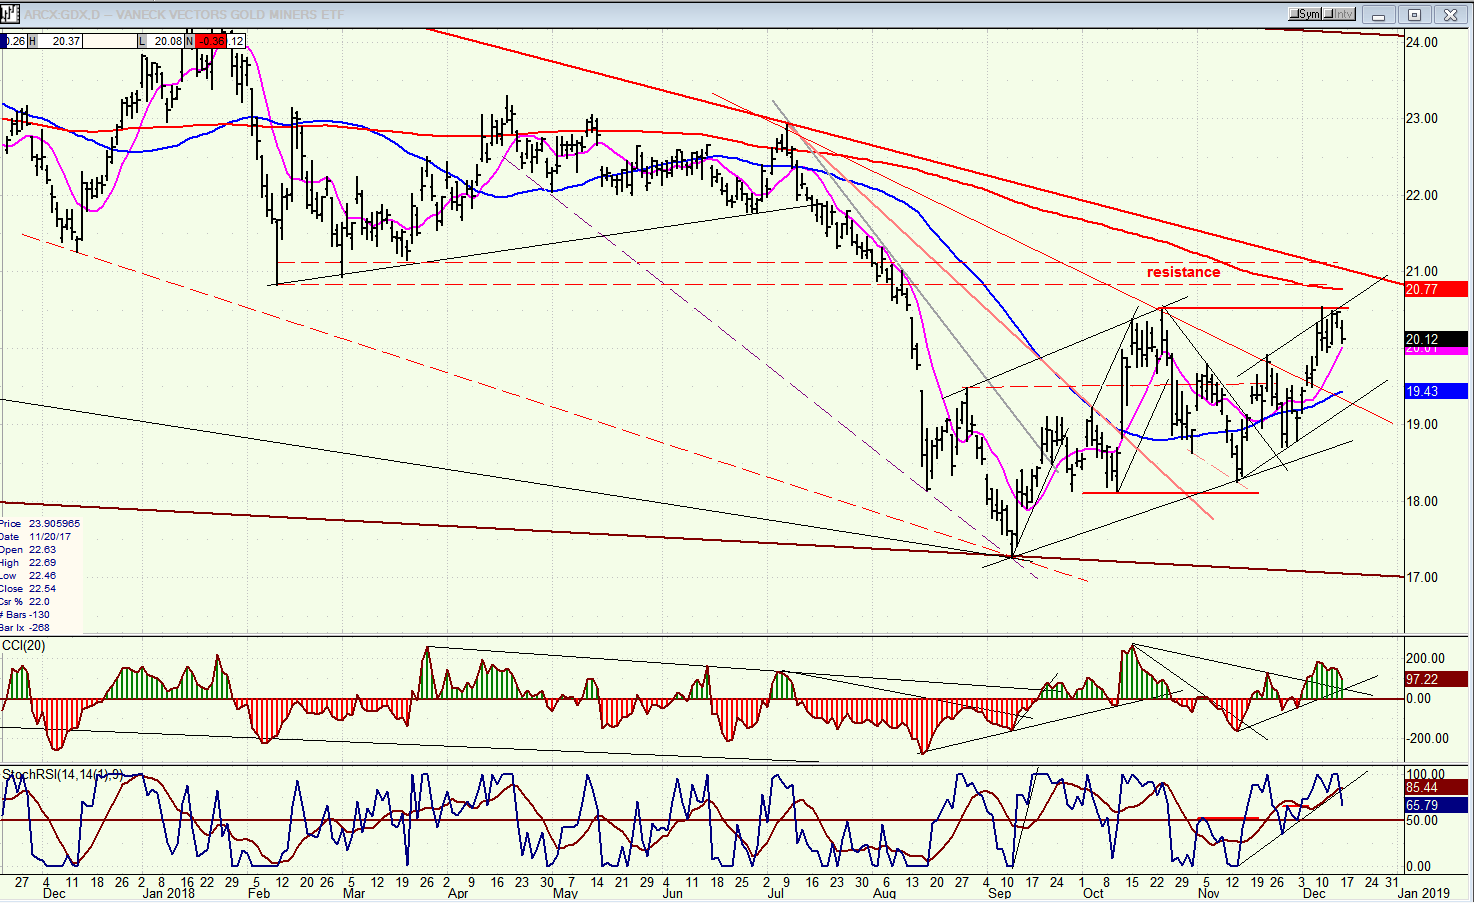
GDX (Gold Miners ETF) Daily
GDX has risen to its former short-term high and could surpass it, but it will probably have to wait until there is a good correction in UUP before it can exceed the resistance which lies above.
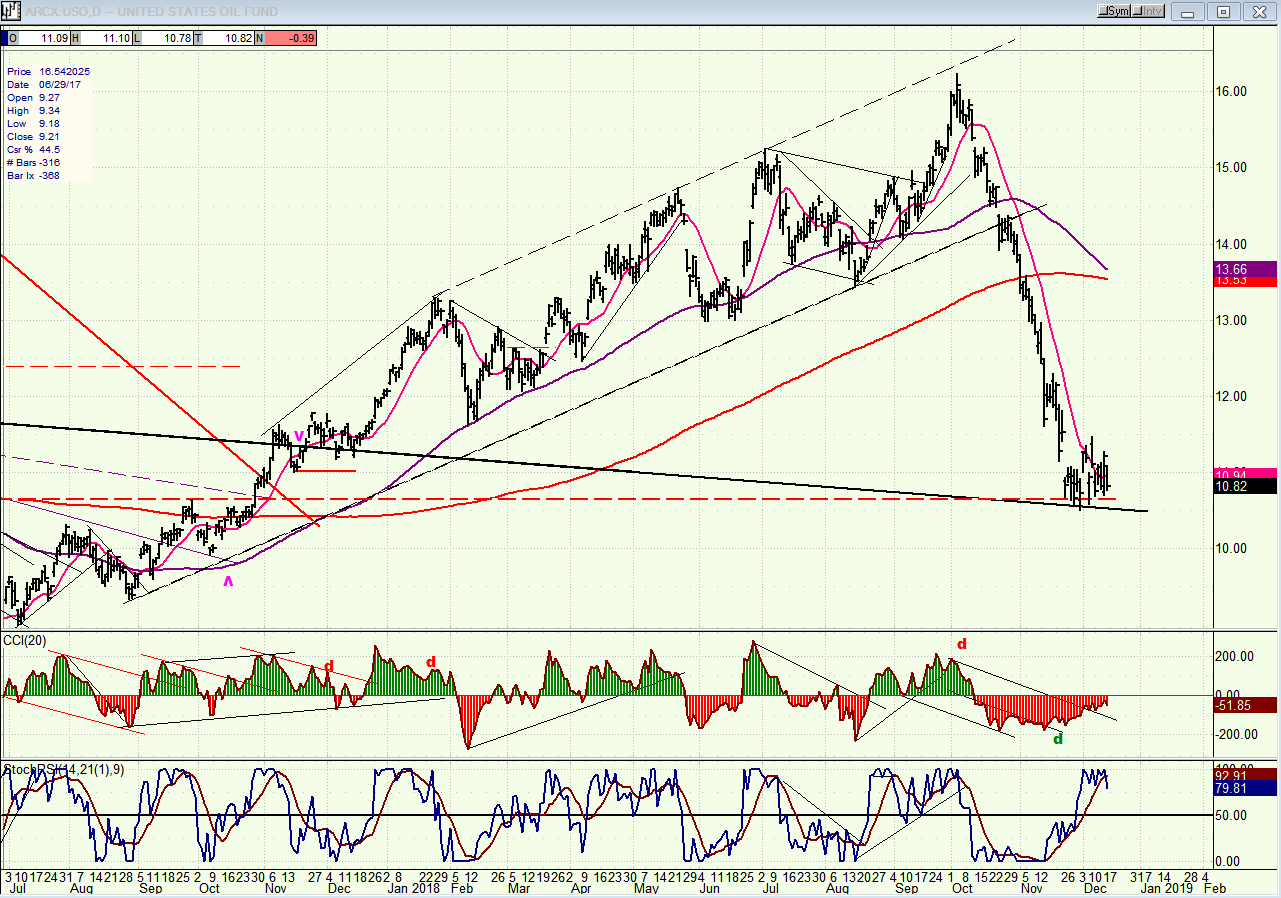
USO (United States Oil Fund) Daily
USO found support where it should have and may be starting to build a base. Until it has, not much of an upside rebound can be expected.
Summary
The rally from 2583 was of poor quality and this has led to another decline, which is already testing support just above the former low. Although a bounce could take place from Friday’s close, there is a better than even chance that a new low will be made before we can finally complete wave A of the correction.
FREE TRIAL SUBSCRIPTON
With a trial subscription, you will have access to the same information that is given to paid subscribers, but for a limited time period. I think you will find that knowing how far a move can carry is one of the most useful benefits of this service, whether you are a trader or an investor -- especially when this price target is confirmed by reliable indicators which give advance warning of a market top or bottom. Furthermore, cycle analysis adds the all- important time element to the above price projections.
For a FREE 4-week trial, further subscription options, payment plans, and for general information, I encourage you to visit my website at www.marketurningpoints.com.
The above comments about the financial markets are based purely on what I consider to be sound technical analysis principles. They represent my own opinion and are not meant to be construed as trading or investment advice, but are offered as an analytical point of view, which might be of interest to those who follow stock market cycles and technical analysis.
*********

When Andre Gratian was a stock broker years ago, a friend introduced him to technical analysis of the market. Consequently, it is not an exaggeration to say that Andre fell in love with this approach! Ever since then, it has become an increasingly important part of his professional life. Gratian has studied the works of Wyckoff, Edwards & Magee, Edward J. Dewey (cycles) and many others. However, one of my most profitable undertaking has probably been to study Point & Figure charting, which he finds invaluable in analyzing stocks and indices. If he were restricted to one methodology, this is the one that he would choose. This well-rounded background has given him what he feels to be a special insight into the stock market, facilitating the recognition of meaningful patterns and the ‘turning points’ in all trends, whether they be short or long term. Andre feels very comfortable discussing the stock market and passing on meaningful information to others. His subscribers include individuals and money managers throughout the world. Moreover, his Newsletters are currently published on several financial sites, here and abroad.
More from Gold-Eagle


