Technical Analysis Of The Markets


Current Position of the Market
SPX: Long-term trend – Bullish, but correcting within the long-term bull market trend.
Intermediate Trend – A bearish correction has started which could retrace as low as 2200 before it is complete
Analysis of the short-term trend is done on a daily basis with the help of hourly charts. It is an important adjunct to the analysis of daily and weekly charts which discusses the course of longer market trends.
A Waterfall Decline
Market Overview
When the market began a serious correction in October, it looked as if it were starting what could turn out to be a “bear market”. This became more evident as time progressed and the downtrend deepened. It is normal for the stock market to have corrections within a trend which are proportional to that trend, and what we are currently experiencing is a normal correction within the longer price trend. There are ways to approximate the extent of any correction and, by using one of the most effective, we can conclude that SPX could retrace a minimum of 700 points (and the DJIA about 7000) before it reverses course. Well, we are already more than half-way there!
That does not mean that it will all be over in another month or two! Corrective patterns tend to come in three phases and this is most likely only the first phase which should, based on the currently extreme oversold condition and other factors, soon come to an end with a relief rally underway. By now, the market has thoroughly discouraged any kind of positive thinking and investors are racing for the exit . This is when a reversal is most likely to occur. When it does take hold, we can expect a countertrend move of several weeks and a significant retracement of the decline to-date.
Chart Analysis (The charts that are shown below are courtesy of QCharts)
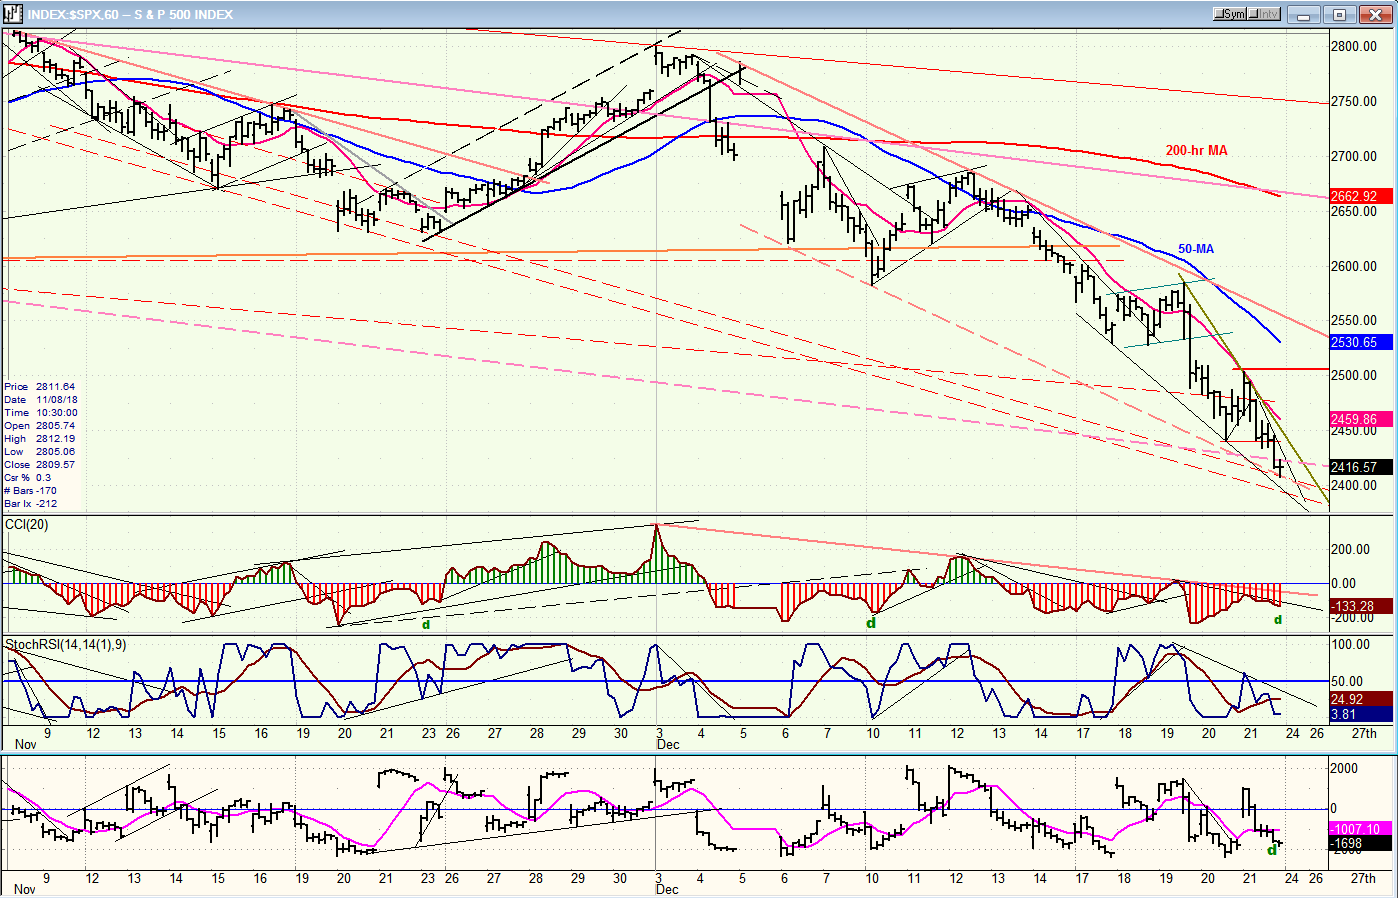
SPX Daily Chart
When the intermediate trend line from 1810 was breached and soon after completely broken, it was the first warning that we had started a significant correction. The initial decline stopped at 2604, on the bottom line of a lateral channel, and was followed by a good rebound which retraced .618 of the initial decline. Another test of the channel support was also successful, but the next rally could only back-test the intermediate trend line before being violently repulsed back to the channel line, dropping 200 points in only two days! Had it stopped there and started a better rally, we could have concluded that a retest of the high was possible. But it did not, and the rest is history.
By printing an intra-day low of 2404 on Friday, the index has now declined 537 points from its 2941 high of 9/21, exactly three months ago. By now, there are few doubt that we are in a bear market. The question is, how much more, and how much longer? In the last few days, prices have actually accelerated their downtrend, dropping 281 points in just seven days, so being just a little worried about how much more of this lies ahead, is justified. So, how close are we to the low of the first phase (emphasis on first)?
The daily indicators are starting to give us a clue! Despite the recent sharp decline, the top oscillator (CCI) is holding well above its October low, which is positive divergence. More importantly, during the last 200 points or so, it has begun to decelerate significantly, and this can also be construed as positive divergence. This will be made much more apparent when we look at the hourly chart. That, in itself, does not tell us when, and at what price level it will reverse. For the latter we turn to the P&F chart which gives us three separate projections pointing to the 2360-2400 level. Based on this information, we should be looking for an important low in the near future.

SPX hourly chart
The 60-m chart is even more valuable for determining the low of phase 1. The price pattern has dropped to the junction of several bottom channel lines; a longer and wider one drawn from the October low and November top, and a more recent one which only goes back to the early December high. I suspect that this junction will provide a platform for at least a minor bounce, and this is supported by the strong positive divergence pattern which has been created in the top oscillator -- in spite of another one hundred-points being added to the decline just on Friday.
It is difficult to conceive of a more negative news-laden day than Friday with the government shut-down combined with the resignation of Secretary of Defense Mattis. More than just a routine day in the Trump administration! Assuming that it does not escalate to world war III by Monday, we should have a near-term relief bounce and, if the 2400 level does not hold, a further dip to about 2360 which should put the finishing touch on phase 1.
DJIA, SPX, IWM, NDX (daily)
Nothing is served by listing these four indexes by relative strength. What does matter is to analyze wthat IWM (our leading index) is doing relative to the other three. There is no discernable difference between it and the others right now, except that it is showing a little more positive divergence in its CCI, but I don’t want to read too much into that except that, in addition, it may have reached a phase projection on its P&F chart. Let’s just wait another week and see if it starts improving its relative strength to the others.

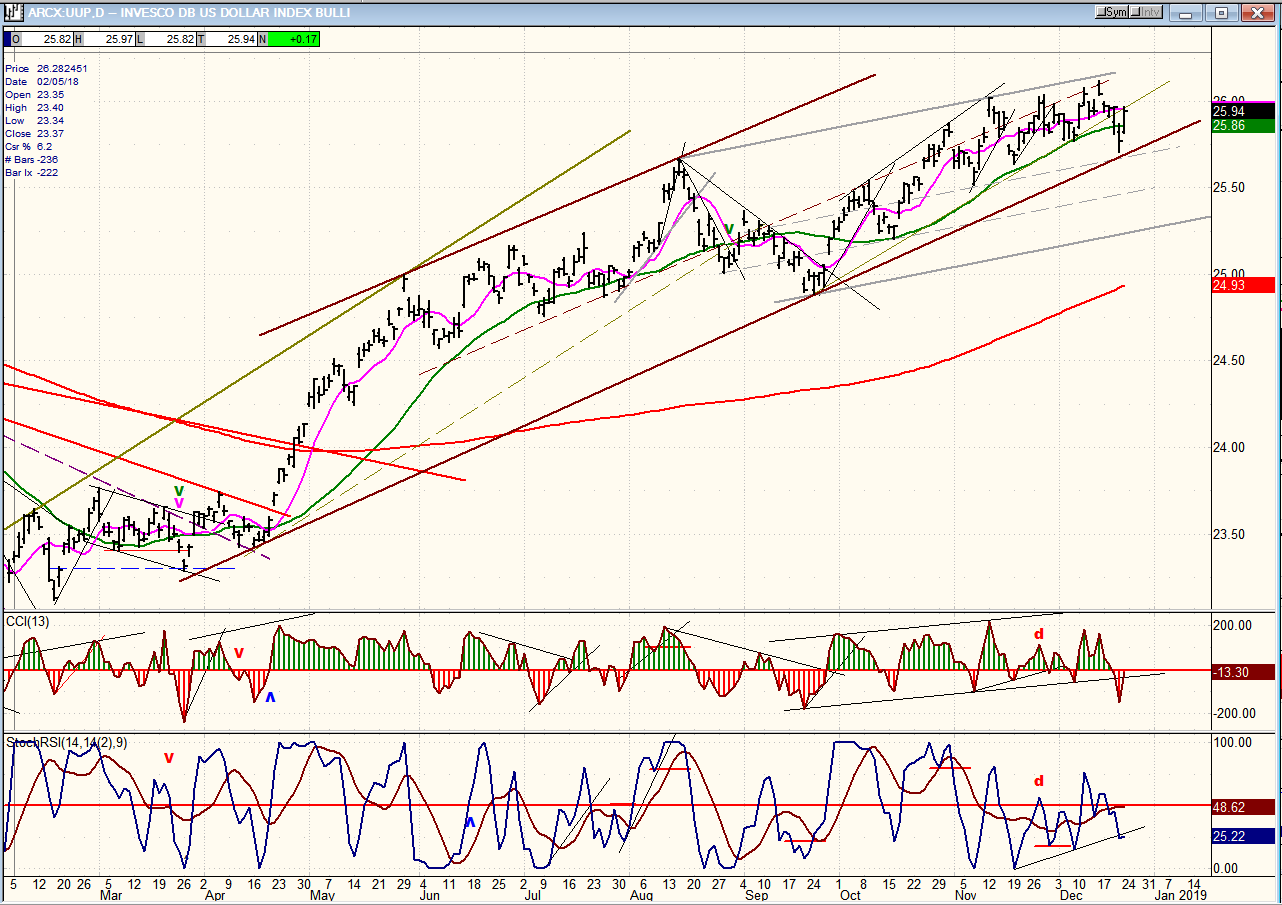
UUP (Dollar ETF)
UUP broke a minor trend line, found support on the longer trend line, and bounced right back up. In doing so, it also closed back above its green 30-DMA. In order to start a good correction, it would have to close below the trend line from 23.50.
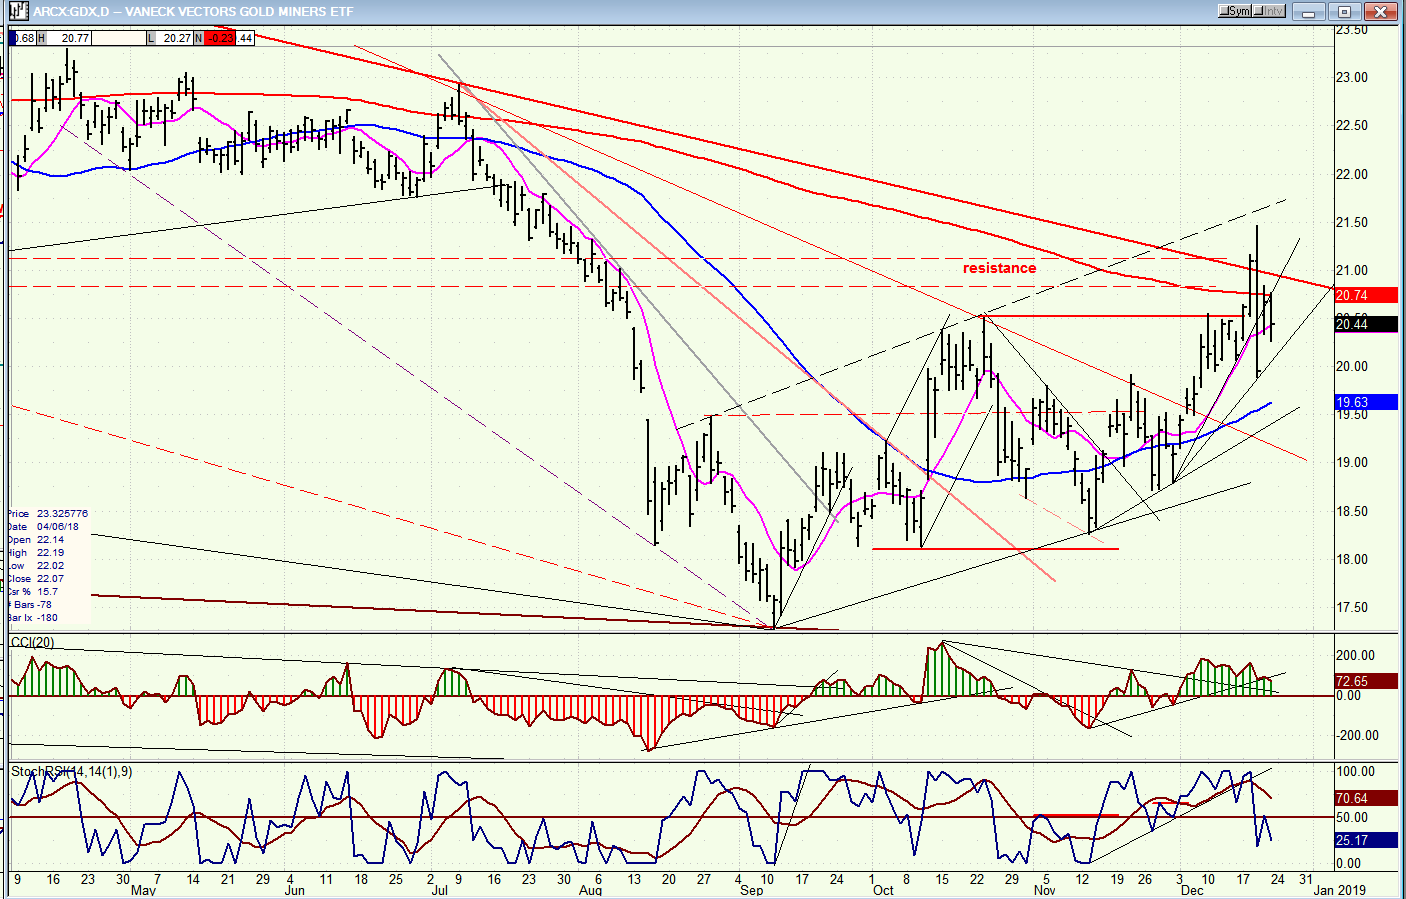
GDX (Gold miners ETF) daily
GDX finally reached its short-term projection of 21-21.50 which I’ve been touting for several weeks with a varying degree of assurance, and immediately retraced 50% of its uptrend from 11/03. If it is going to push higher, it should now form a consolidation pattern above ~20.00 until it is ready to move to its next potential projection of about 25.00. This will probably not take place until UUP has started to correct below its trend line (see directly above).
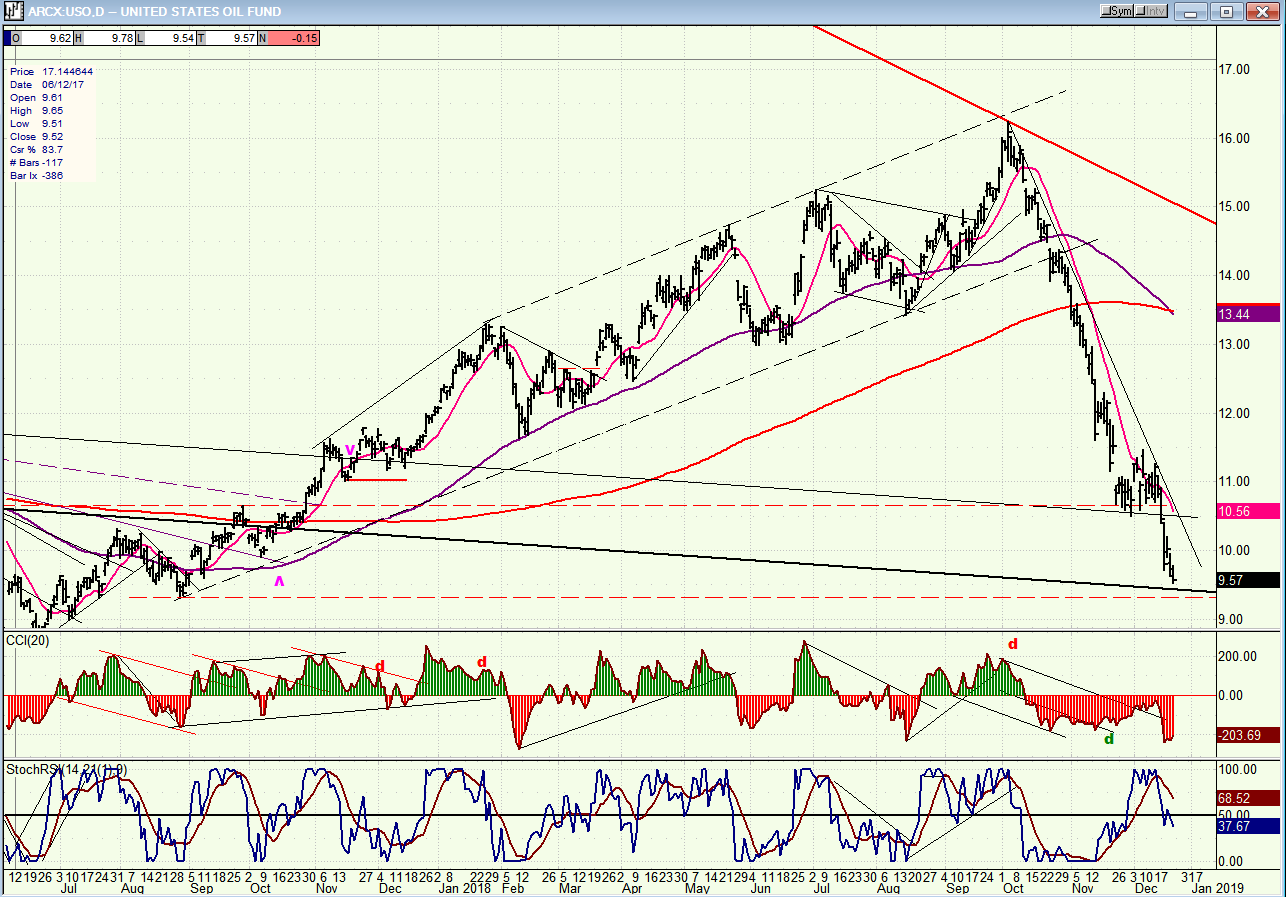
USO (United States Oil Fund) daily
After reaching a high of 119.17 on 7/08, USO declined to a low of 8.33 on 2/16 and, after building a base which took about two and a half years to complete, it started a rally which culminated at 16.24 on 9/18. This represented about a 7.5% retracement of its long-term decline. Since then, it has retraced to Friday’s low of 9.54 -- nearly 80% of its recent rally. It is clear that USO is not going anywhere fast and that it will be engaged in more base building for some time to come.
Summary
After a brutal week for the bulls and a total loss of 537 points since its early October high, SPX500 appears close to ending the first of a probable three-phase intermediate-term correction which should take several more months to run its course.
Merry Christmas to All
FREE TRIAL SUBSCRIPTON
With a trial subscription, you will have access to the same information that is given to paid subscribers, but for a limited time period. I think you will find that knowing how far a move can carry is one of the most useful benefits of this service, whether you are a trader or an investor -- especially when this price target is confirmed by reliable indicators which give advance warning of a market top or bottom. Furthermore, cycle analysis adds the all- important time element to the above price projections. For a FREE 4-week trial, further subscription options, payment plans, and for general information, I encourage you to visit my website at www.marketurningpoints.com.
The above comments about the financial markets are based purely on what I consider to be sound technical analysis principles. They represent my own opinion and are not meant to be construed as trading or investment advice, but are offered as an analytical point of view which might be of interest to those who follow stock market cycles and technical analysis.
*********

When Andre Gratian was a stock broker years ago, a friend introduced him to technical analysis of the market. Consequently, it is not an exaggeration to say that Andre fell in love with this approach! Ever since then, it has become an increasingly important part of his professional life. Gratian has studied the works of Wyckoff, Edwards & Magee, Edward J. Dewey (cycles) and many others. However, one of my most profitable undertaking has probably been to study Point & Figure charting, which he finds invaluable in analyzing stocks and indices. If he were restricted to one methodology, this is the one that he would choose. This well-rounded background has given him what he feels to be a special insight into the stock market, facilitating the recognition of meaningful patterns and the ‘turning points’ in all trends, whether they be short or long term. Andre feels very comfortable discussing the stock market and passing on meaningful information to others. His subscribers include individuals and money managers throughout the world. Moreover, his Newsletters are currently published on several financial sites, here and abroad.


