Technical Analysis Of The Markets


Current Position of the Market
SPX: Long-term trend – Correcting within the very long-term bull market trend.
Intermediate trend – A bearish correction has started which could retrace as low as 2200 before it is complete
Analysis of the short-term trend is done on a daily basis with the help of hourly charts. It is an important adjunct to the analysis of daily and weekly charts which discusses the course of longer market trends.
Counter-trend Extends
Market Overview
Friday Morning Comment: “Trade talk optimism, options expiration, a three-day week-end, and a Bradley turn date! That’s a powerfully bullish combination which undoubtedly generated massive short-covering rather than genuine buying when legitimate projections were reached and failed to bring anything more than a blip reversal.”
Great timing for the bulls! When the 2625 projection based on Fib retracement from the 2800 top failed to bring more than a one hour pull-back on Thursday, the bulls took over as positive trade news with China surfaced and they ran the shorts to the tune of a 70-point rally to 2675 by Friday.
It may not be so easy from this point on, although if, as I suggested a couple of weeks ago, we are actually retracing the decline from 2941, we could then make it all the way to 2714 before this counter-trend rally is over. If Bradley had anything to do with this mini euphoria, it can end first thing Tuesday morning. In the course of the last two days, we lost established negative divergence in the hourly indicators, but regained it big time on Friday. The dailies are not quite there yet, but getting close. It will take a sell signal at the hourly level to turn them down!
IWM did give warning about a top slightly ahead of the SPX 2925 target, but it was short-lived. It may be in a position to give another next Tuesday morning if it does not make a new high and SPX does. Something to watch!
Chart Analysis (The charts that are shown below are courtesy of QCharts)
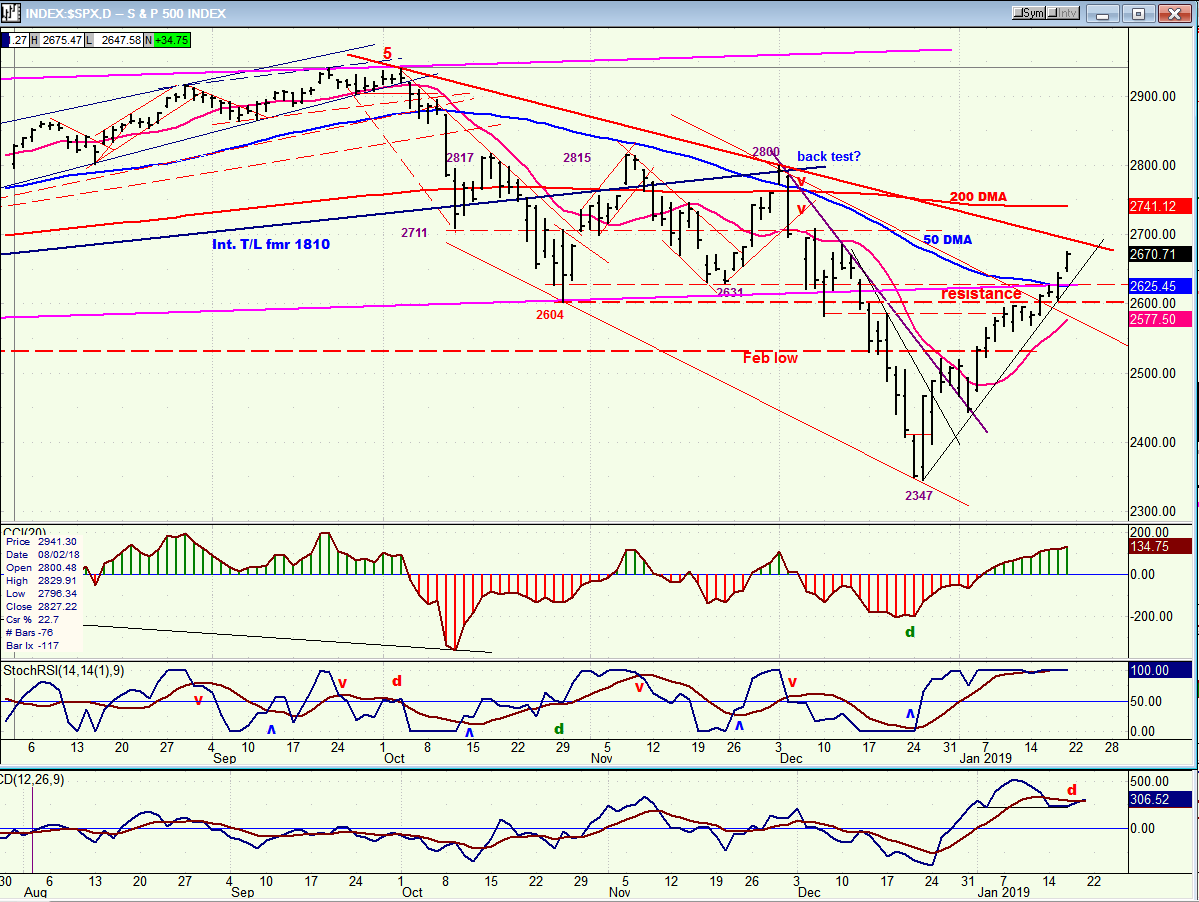
SPX daily chart
On the bullish side, SPX has moved beyond its initial resistance band, as well as the 50-dma. However, if this was mostly the result of short-covering, the move above 2625 is a little dubious and could be short-lived. On the negative side, the index is approaching the main trend line from the top which should provide some resistance. Even if broken, it will remain well below the 200-dma which serves the purpose of a long-term trend line. Until I see much more sustained strength, I will stick with the counter-trend labeling for this rally.
SPX may be extending the fifth wave of its rally from 2346 and, when it comes to an end, this rebound could be only the a-wave of an a-b-c pattern. If so, a potential scenario may be developing: this could be wave-a of an a-b-c correction in a bear market. Next would come the b-wave retracement (as an a-b-c), and then a 5-wave uptrend to complete the bear market correction as a zig-zag. I had mentioned that, based on future cycles, Erik Hadik foresaw a lengthy process of range-based trading into later in the year before we were ready for the final down-leg of the bear market. This scenario would fit the bill nicely.
The near-term focus should be to identify the top of the a-wave. If the Bradley Siderograph turn date of 1/18 is the determinant, then Tuesday should see the high of the move. If, if, if… We’ll need some confirmation, but with the hourly negative divergence, it’s certainly a possibility.
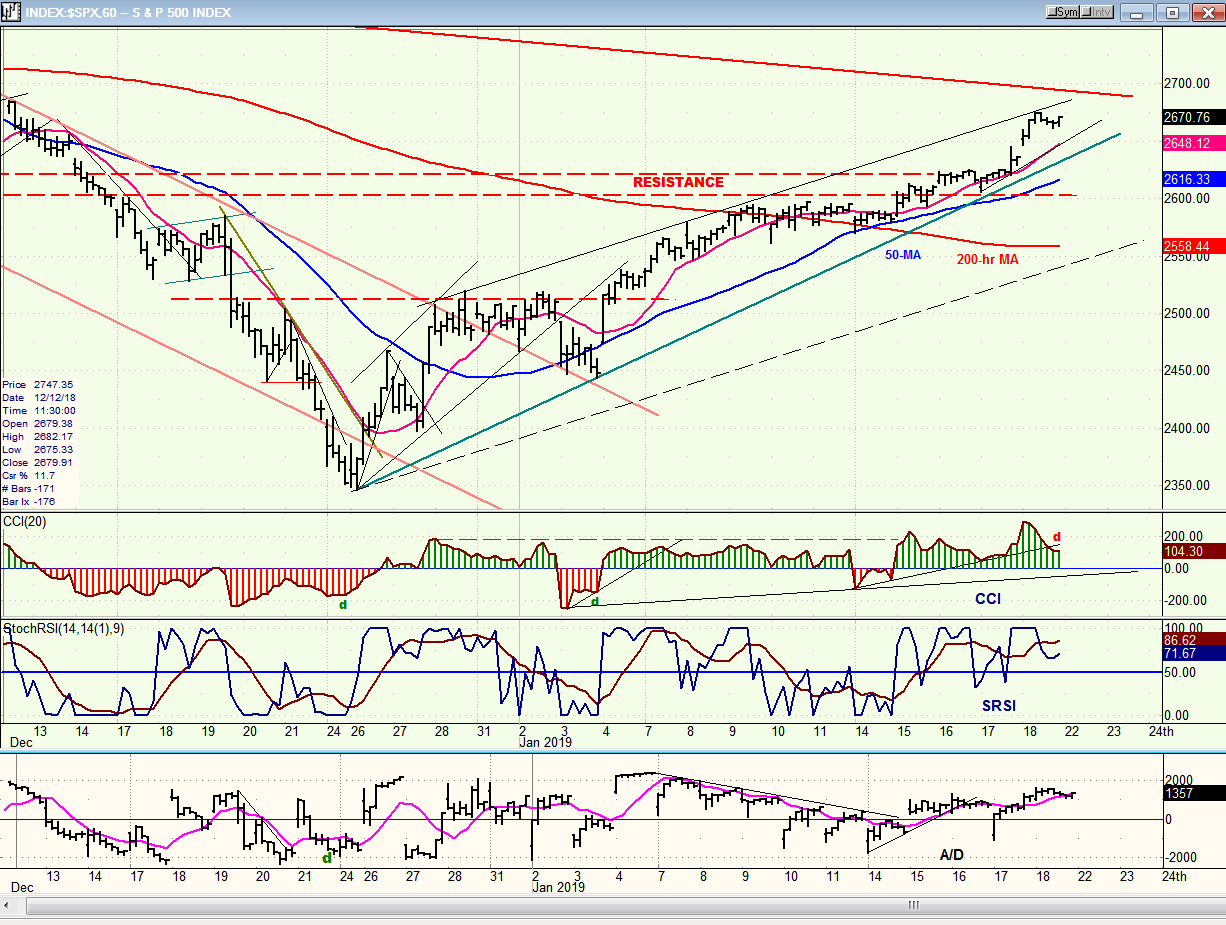
SPX hourly chart
The selling which resulted from reaching the 2625 target was so slight that it can hardly be found on the chart. It was only a 20-point pull-back which, in this volatile market is nothing. It did not even reach the green uptrend line before bouncing.
At Friday’s close, we remain above the trend line and all the MAs, but I find it interesting that the little four-hour consolidation dropped the indicators so much. A new high on Tuesday morning would most likely keep in place the negative divergence already existing in both momentum indicators and as well, create some for the A/Ds.
Note that the green uptrend line and the line drawn across the tops is forming a wedge pattern which is normally bearish, providing the price does not shoot above that line to form a top channel line parallel to the green line. That’s unlikely to happen, but I do expect a higher high on Tuesday morning at the opening. I have drawn a dashed parallel to the line across the top to create a price channel for the current uptrend. And, if we reverse shortly and break the green trend line, dropping to that bottom channel line would be a good target for the first leg of the b-wave correction. Know that I do not construct these scenarios out of thin air, but as a result of understanding how the market is likely to move, based on many years of observation.
If strength does continue and we go through the red downtrend line from the 2941 top and do not immediately pull-back below it, then it may require a re-assessment of the market’s action .
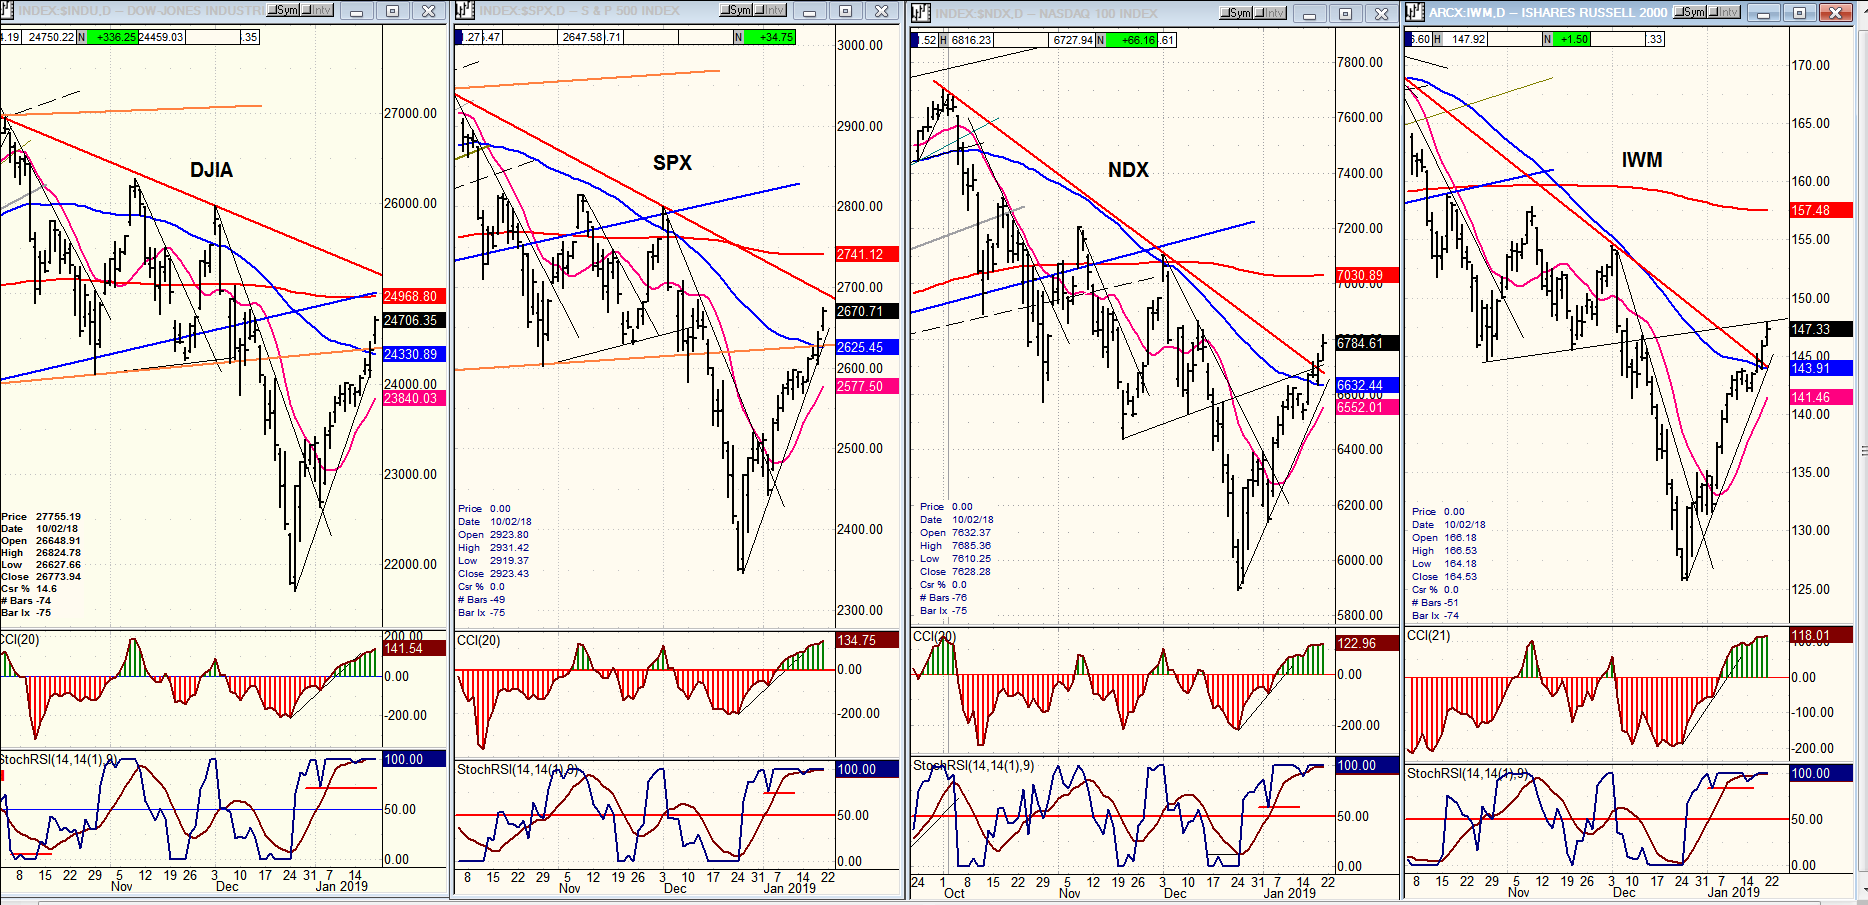
DJIA, SPX, IWM, NDX (daily)
All four indexes show the same rally pattern. NDX and IWM have broken above their red downtrend line from the top, but I don’t think it’s very significant. Rather, the fact that all four are still below their 200-dma is more relevant. Judging by that criterion, IWM is still, by far, the weakest index. Percentage-wise, it has also retraced less of its decline than the others. IWM would have to take the lead to suggest that the bear market is over.
UUP (Dollar ETF) (daily)
UUP has started a correction, found support on a channel line, and bounced. The next target should be a .382 retracement of its uptrend, but it may not end there and continue to a 50% retracement at about 24.50. This is a very slow-moving ETF with very little volatility.

GDX (Gold miners ETF) (daily)
GDX reached its stated projection of 21.50 and is pulling back. If it can hold above its (blue) 50-dma, it can get back in an uptrend quickly and move to its next projection level of a least 22.50.

BNO (United States Brent Oil Fund) (daily)
BNO is making a good recovery and could extend it to 18.25-.30 before adding to its base.

Summary
Last Thursday, SPX encountered a bullish combination of factors just as it reached its projected short-term target. This caused massive short-covering and propelled it fifty points higher. With negative divergence re-instated at the hourly level, we could quickly put an end to this phase of the counter-trend -- especially if IWM fails to make a new high on Tuesday.
FREE TRIAL SUBSCRIPTON
With a trial subscription, you will have access to the same information that is given to paid subscribers, but for a limited time period. I think you will find that knowing how far a move can carry is one of the most useful benefits of this service, whether you are a trader or an investor -- especially when this price target is confirmed by reliable indicators which give advance warning of a market top or bottom. Furthermore, cycle analysis adds the all- important time element to the above price projections.
For a FREE 4-week trial, further subscription options, payment plans, and for general information, I encourage you to visit my website at www.marketurningpoints.com.
The above comments about the financial markets are based purely on what I consider to be sound technical analysis principles. They represent my own opinion and are not meant to be construed as trading or investment advice, but are offered as an analytical point of view which might be of interest to those who follow stock market cycles and technical analysis.

When Andre Gratian was a stock broker years ago, a friend introduced him to technical analysis of the market. Consequently, it is not an exaggeration to say that Andre fell in love with this approach! Ever since then, it has become an increasingly important part of his professional life. Gratian has studied the works of Wyckoff, Edwards & Magee, Edward J. Dewey (cycles) and many others. However, one of my most profitable undertaking has probably been to study Point & Figure charting, which he finds invaluable in analyzing stocks and indices. If he were restricted to one methodology, this is the one that he would choose. This well-rounded background has given him what he feels to be a special insight into the stock market, facilitating the recognition of meaningful patterns and the ‘turning points’ in all trends, whether they be short or long term. Andre feels very comfortable discussing the stock market and passing on meaningful information to others. His subscribers include individuals and money managers throughout the world. Moreover, his Newsletters are currently published on several financial sites, here and abroad.
More from Gold-Eagle


