Technical Analysis Of The Markets


Current Position of the Market
SPX: Long-term trend – Long-term trend resuming?
Intermediate trend – Countertrend may be over.
Analysis of the short-term trend is done on a daily basis with the help of hourly charts. It is an important adjunct to the analysis of daily and weekly charts which discusses the course of longer market trends.
Decision Time
Market Overview
We can categorize the decline from 2941 to 2346 as having taken place in two phases, with the first ending at 2682 and the second one starting from 2800 and concluding at 2346. The rally from the low was initially labeled as a countertrend rally with two potential basic objectives: the first to 2625, and the second to 2714. The first was reached on 1/15 and, without skipping a beat, the index immediately proceeded to the next target which was filled on Friday when the high of the day printed 2716.66 before prices stalled. This is probably as far as the countertrend should be allowed to go. Beyond this level would technically put us back into an uptrend with the good possibility of making a new all-time high.
A potential top at this level is enhanced by short-term cyclicality which warns of a correction into the middle of the month, at a minimum, and probably into the end of the month. But how much weakness can we expect? Probably not enough to ensure that we have come to the end of the rally from 2346. We have arrived at this level with very little distribution, so there is no evidence that the coming reversal is going to be all that severe; but a retracement to 2575 is a good bet.
This is also suggested by the indicators: the hourlies have plenty of negative divergence to warn that a top is taking shape. But the dailies remain very positive and only tell us to expect a minor correction at this time. Also, the weekly indicators are on the verge of giving a confirmed buy signal. So there is no immediate sign that we have arrived at an important top and that we are ready to decisively reverse the trend from 2346 at this time. After we have corrected for two or three weeks we will be in better position to determine what comes next. If the current high is exceeded, P&F charts project the next high to be 2740, and then 2780.
Chart Analysis (The charts that are shown below are courtesy of QCharts)
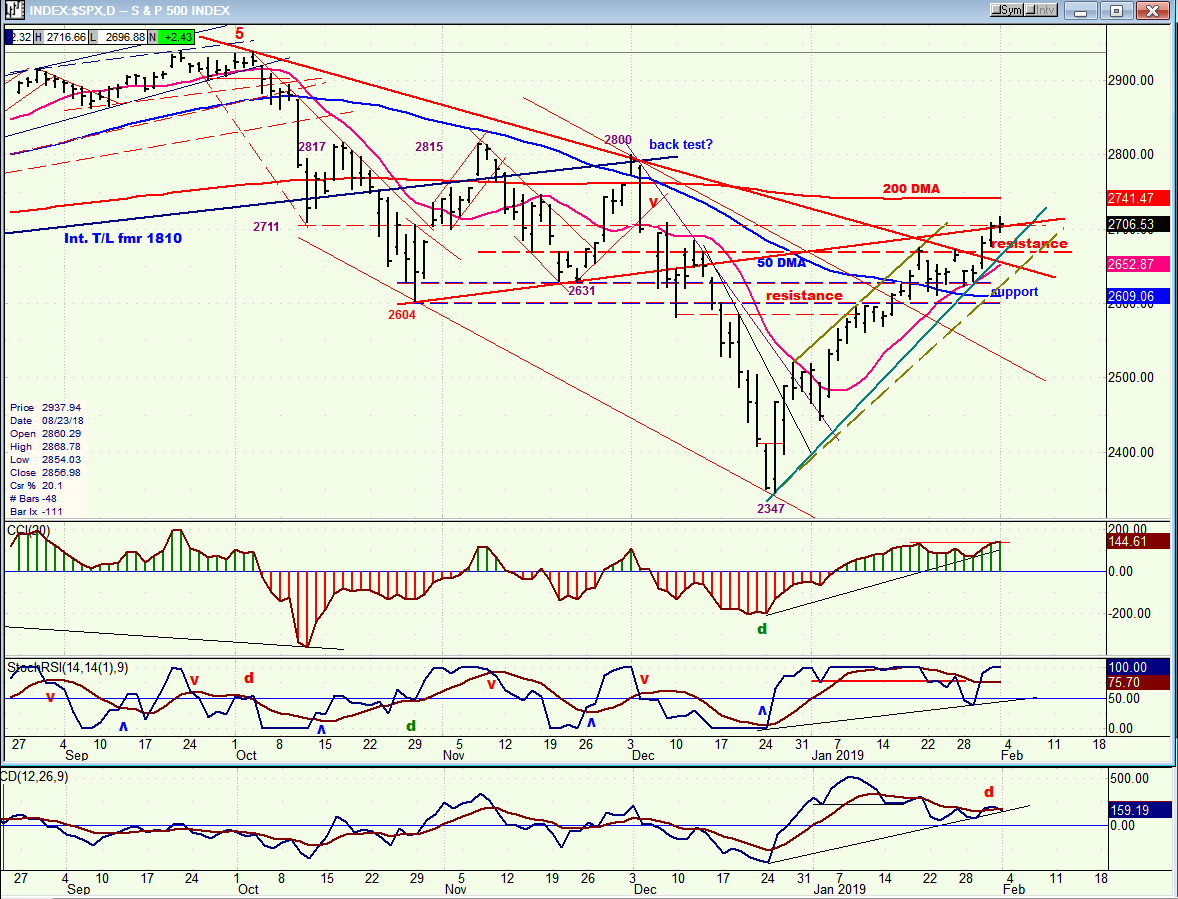
SPX daily chart
There are many positives on this chart! After a brief correction of a three-day rebound which spanned 152 points, the rally extended another 202 points to 2675. By then, it had already moved past the initial resistance band which had become support for the next consolidation and, fueled by last Wednesday’s FOMC report, it further extended its rally to meet our 2714 projection. That took it past the 50-DMA and outside the primary downtrend line from 2941. To continue this show of strength, it must now get above the resistance line which connects the 20/29 and 22/20 lows and the 200-DMA which lies at 2740. An attempt is not expected before a short-term correction takes place.
Since we have reached the maximum potential allotted to the countertrend rally, what we do from this point on will tell us what to expect next over the longer-term. A retracement much below 2530 would start to be worrisome for the bulls, and a subsequent rally which fails to exceed Friday’s high would be considered a sign that weakness is returning to the market.
The daily CCI is still strong and made a new high on Friday, but it only fractionally exceeded the previous high, so this could be considered a sign of deceleration if not outright negative divergence. It is consistent with the strong negative divergence displayed in the hourly indicator, the achieving of the projection target, and the expectation of a cyclical high. Odds are therefore very good that Monday could bring a reversal.
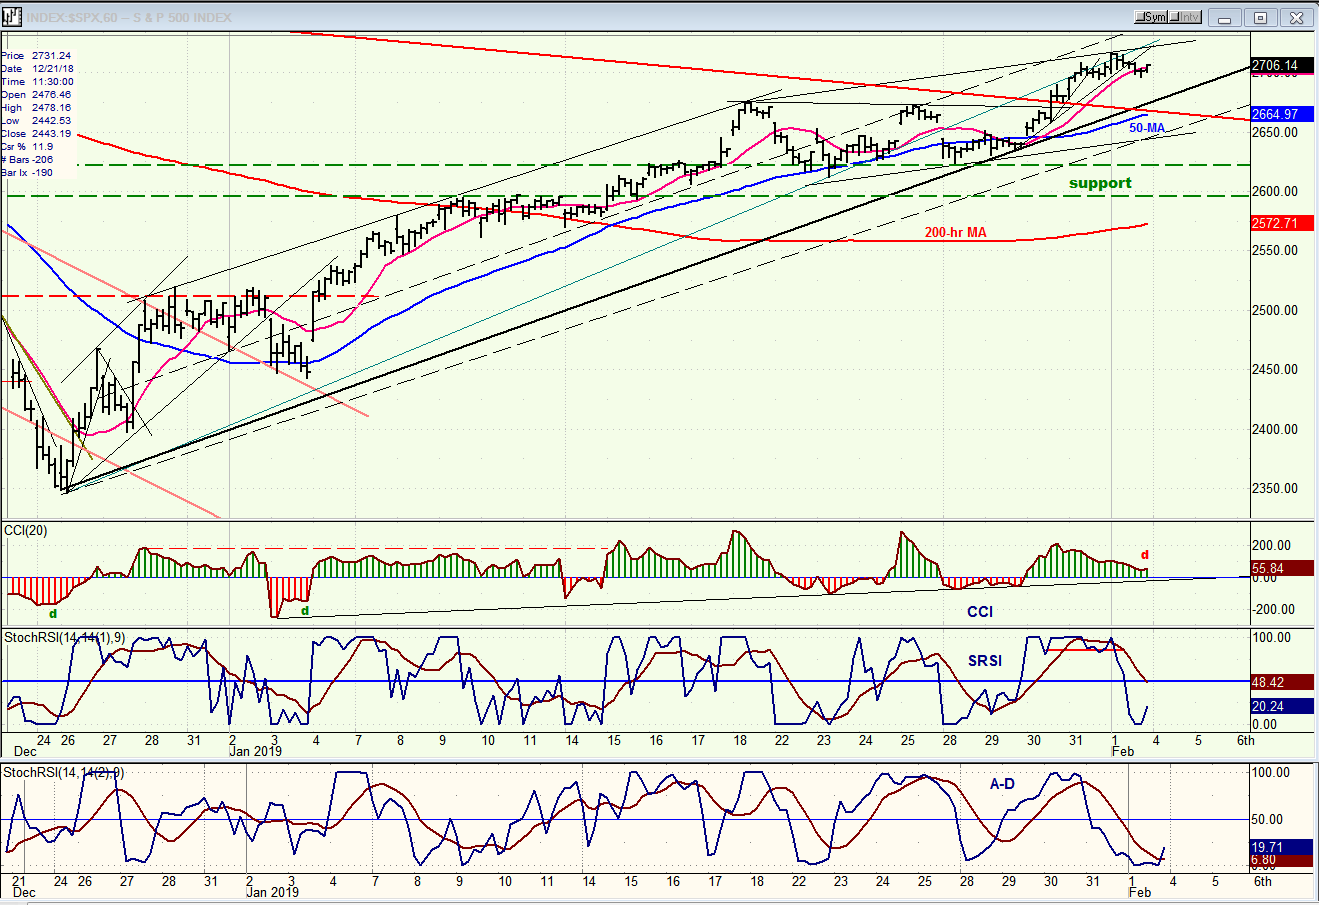
SPX hourly chart
The negative divergence in the CCI and the sell signal already given by the two lower indicators carry a strong warning that the rally from 2346 is (finally) coming to an end. One could make the case that without the pause in the raising of interest rates by the Fed, we would already be in a correction, but that is not what happened and we did push higher. But it is significant that the strong jobs report of Friday morning could not extend the rally any higher, probably because traders used it to liquidate their long positions and establish shorts.
Two of the three oscillators have already gone negative and a confirmed sell should come as soon as the CCI also goes negative. This should be followed by a decline to the trend line where initial support should be met, along with that provided by the broken downtrend line (kiss-back) and the 50-MA. After holding briefly, the decline should then progress into the middle, and very likely, the end of the month. As stated above, if we are retracing the uptrend from 2346, a target of 2575 is a good bet.
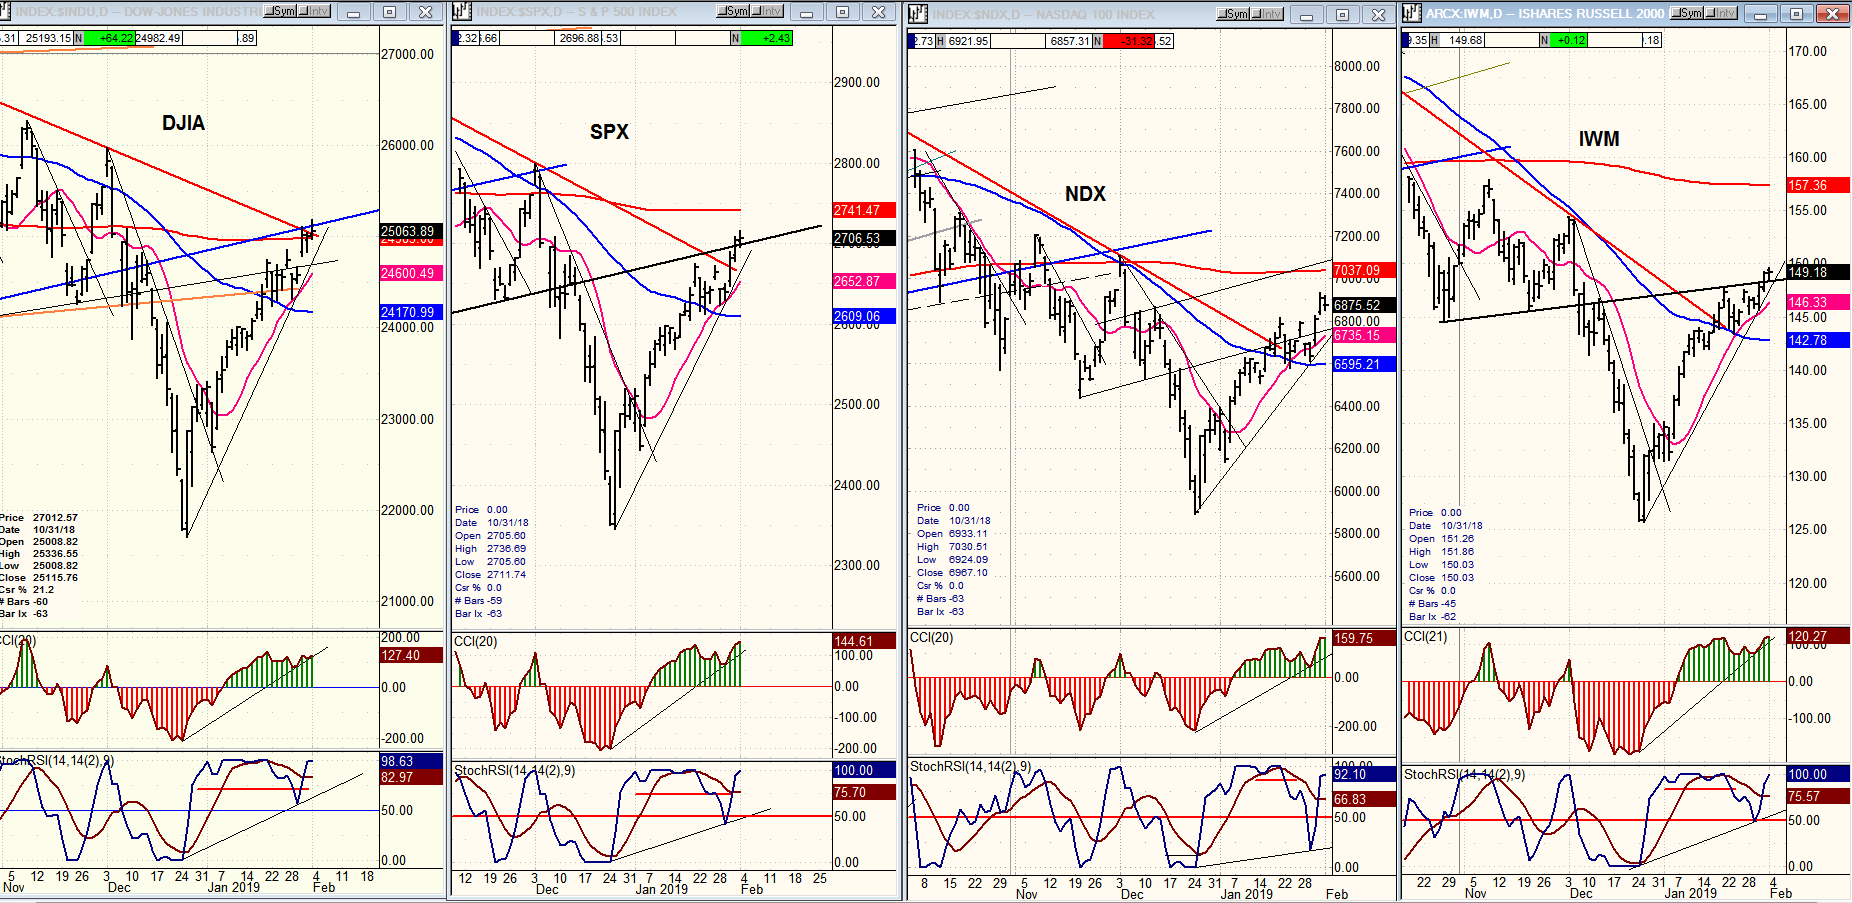
DJIA, SPX, IWM, NDX (daily)
All four indexes made a new high last week. Long-term, IWM is still the weakest relative to its 200 DMA; short-term, it is not showing any significant divergence to the other three. Also, although the indicators are pretty much keeping up with the price, they could soon be vulnerable to a retracement, but not necessarily to an immediate sell signal. At this time, there is no sign that a severe correction is in the offing.
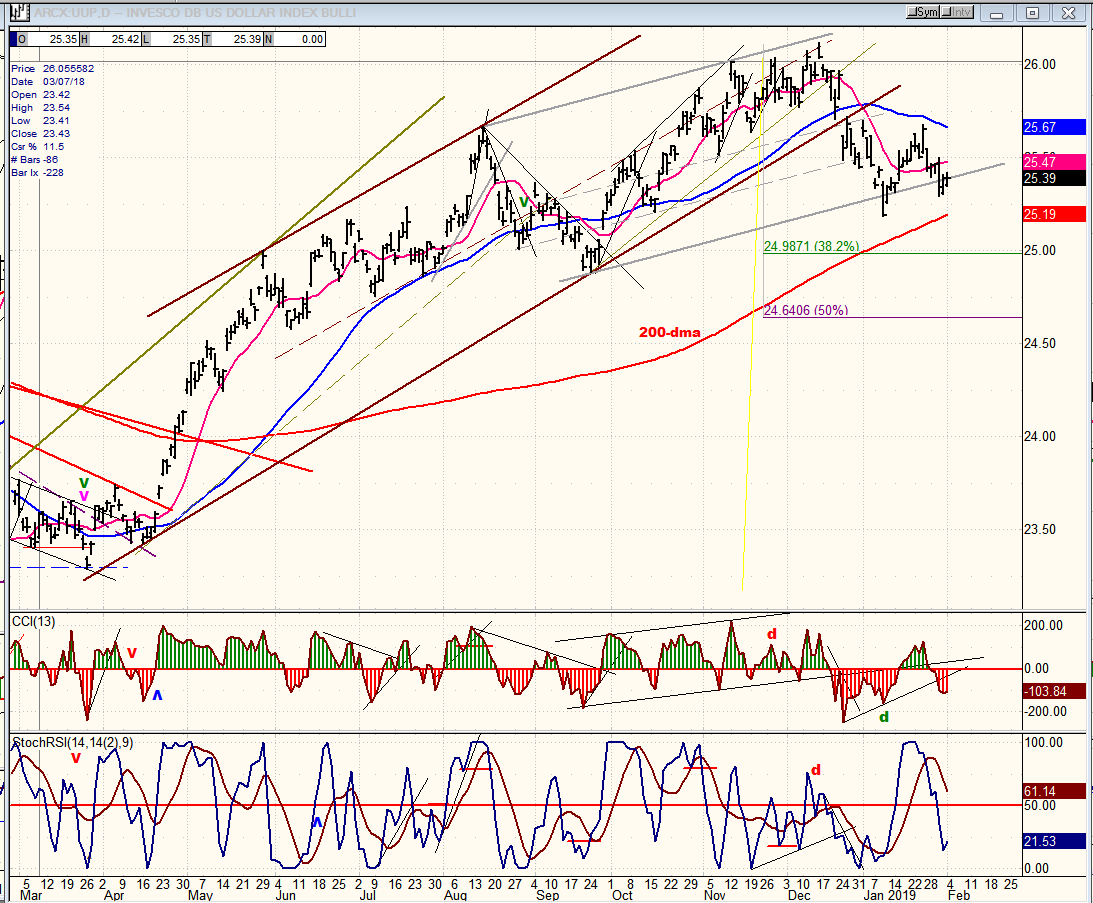
UUP (Dollar ETF) (daily)
UUP continues to consolidate and may not relinquish its present perch for a little while longer. The blue 50-dma should continue to serve as overhead resistance now that it has been broken. The index would have to drop below its 200 DMA to signal that it has engaged in an intermediate-term correction.
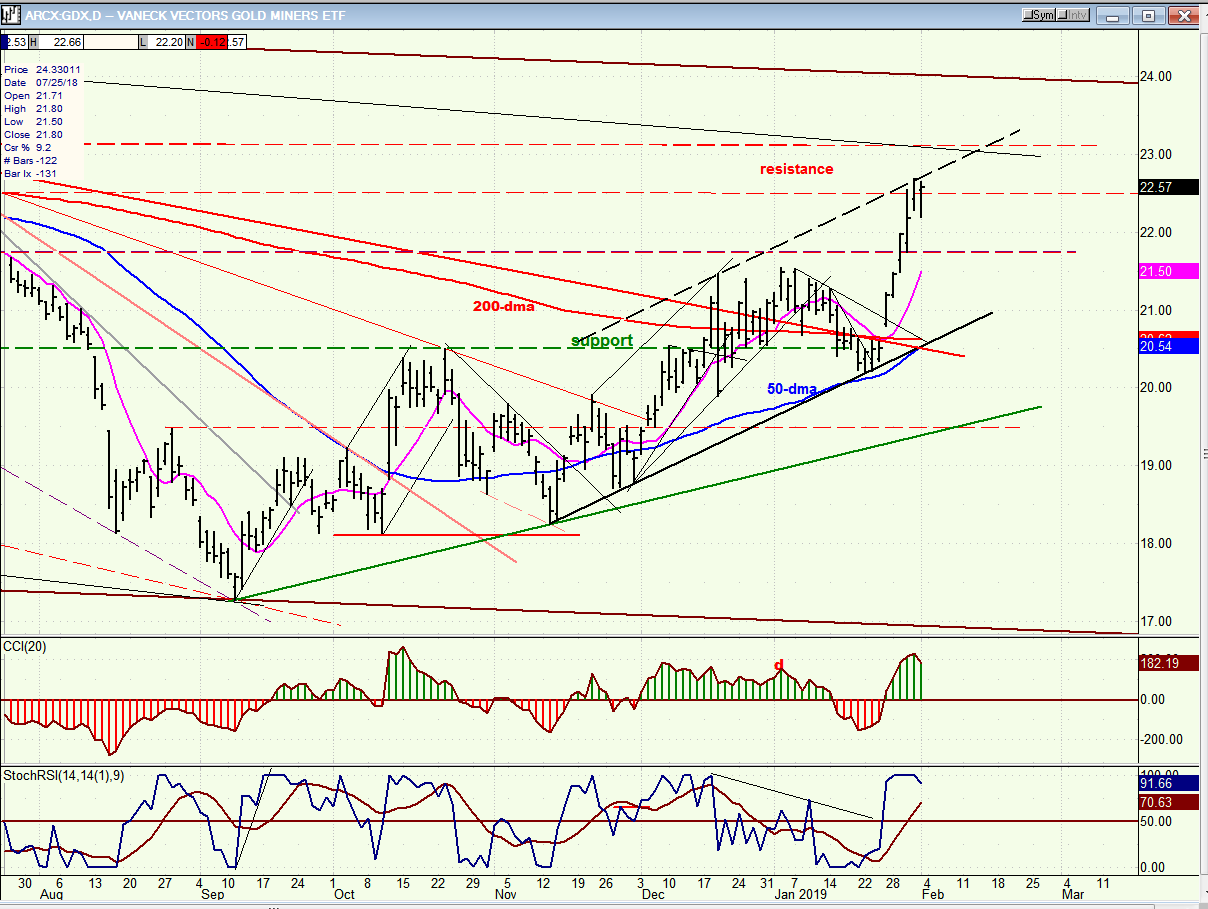
GDX (Gold miners ETF) (daily)
“GDX held support as well as its uptrend line and appears to have broken out into a new uptrend on Friday. If so, we should see some follow through to a new high over the near-term; but the move may be limited to about 22-22.50”
Last week’s analysis was spot on as SPX extended its break-out to the projection target. It is now probably ready for a short-term correction before attempting to push higher. Based on the P&F base, the intermediate goal is to reach at least 25-25.50, and perhaps as high as 29.50 by March.
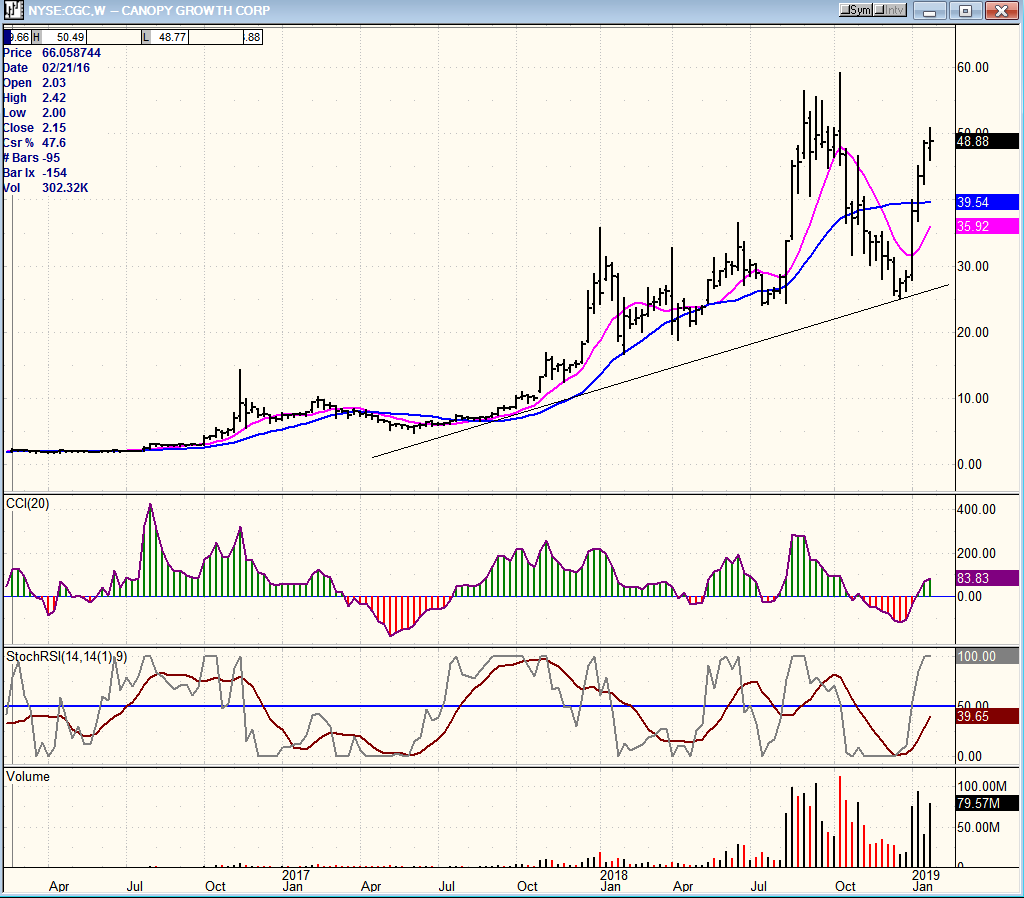
CGC (Canopy Growth) (WKLY)
CGC is one of the leading companies in the cannabis field which is quickly being recognized for its medicinal properties. Over the past two years the stock has experienced strong demand, although marked by volatility. The long-term trend appears to have been well established and this could be one of the rapid growth industries of the future. The P&F chart is not an easy read, but appears to have a potential count to 60, and then 74.
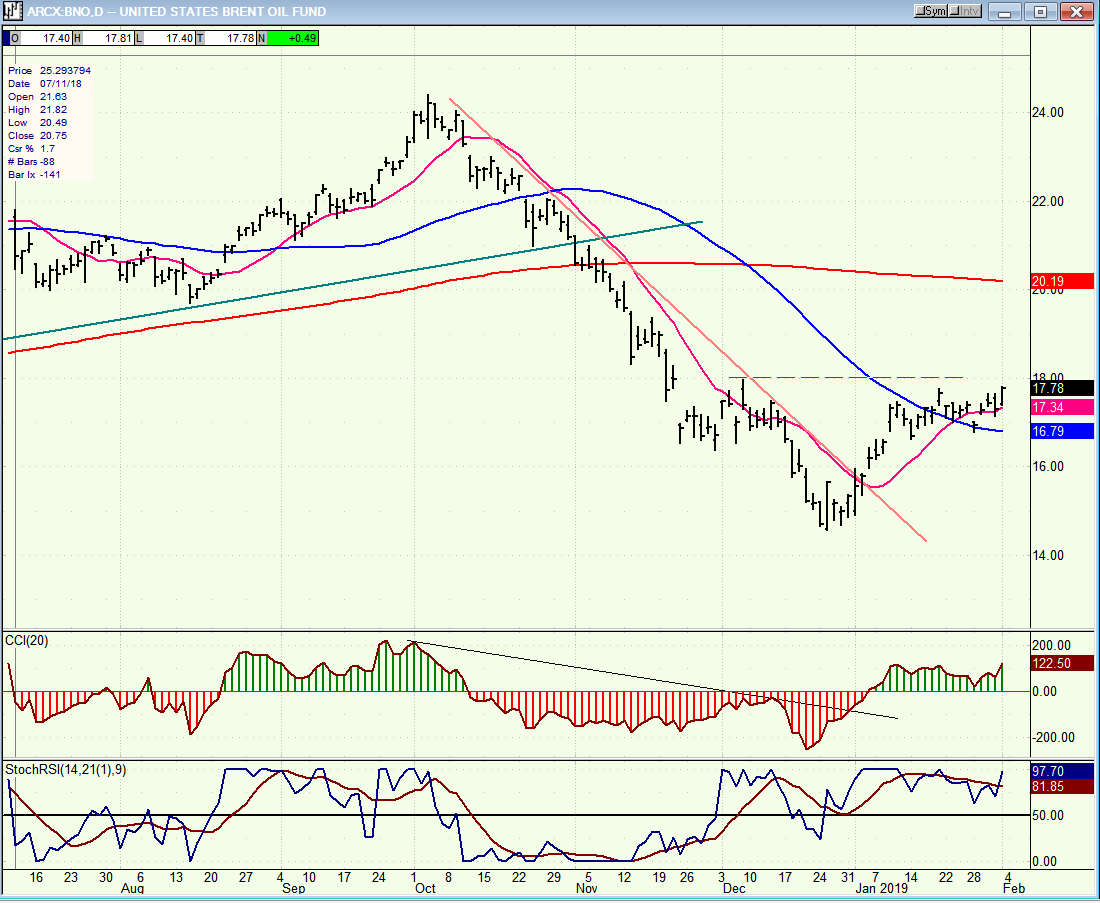
BNO (United States Brent Oil Fund) (daily)
BNO continues to consolidate and build a base. It’s near-term objective should be about 18.50 before pulling back.
Summary
SPX has reached the maximum count that can be logically given to a countertrend rally. A short-term top appears to be in place, but awaiting confirmation. The degree of the coming correction – and especially what it does afterwards -- should be scrutinized since it is likely to dictate the intermediate outlook for the market.
FREE TRIAL SUBSCRIPTON
With a trial subscription, you will have access to the same information that is given to paid subscribers, but for a limited time period. I think you will find that knowing how far a move can carry is one of the most useful benefits of this service, whether you are a trader or an investor -- especially when this price target is confirmed by reliable indicators which give advance warning of a market top or bottom. Furthermore, cycle analysis adds the all- important time element to the above price projections.
For a FREE 4-week trial, further subscription options, payment plans, and for general information, I encourage you to visit my website at www.marketurningpoints.com.
The above comments about the financial markets are based purely on what I consider to be sound technical analysis principles. They represent my own opinion and are not meant to be construed as trading or investment advice, but are offered as an analytical point of view which might be of interest to those who follow stock market cycles and technical analysis.

When Andre Gratian was a stock broker years ago, a friend introduced him to technical analysis of the market. Consequently, it is not an exaggeration to say that Andre fell in love with this approach! Ever since then, it has become an increasingly important part of his professional life. Gratian has studied the works of Wyckoff, Edwards & Magee, Edward J. Dewey (cycles) and many others. However, one of my most profitable undertaking has probably been to study Point & Figure charting, which he finds invaluable in analyzing stocks and indices. If he were restricted to one methodology, this is the one that he would choose. This well-rounded background has given him what he feels to be a special insight into the stock market, facilitating the recognition of meaningful patterns and the ‘turning points’ in all trends, whether they be short or long term. Andre feels very comfortable discussing the stock market and passing on meaningful information to others. His subscribers include individuals and money managers throughout the world. Moreover, his Newsletters are currently published on several financial sites, here and abroad.


