Technical Analysis Of The Markets


Current Position of the Market
SPX: Long-term trend – Long-term trend resuming?
Intermediate trend – Countertrend may be over.
Analysis of the short-term trend is done on a daily basis with the help of hourly charts. It is an important adjunct to the analysis of daily and weekly charts which discusses the course of longer market trends.
Correction Starting?
Market Overview
After reaching 2739 last Tuesday, SPX started what is probably a correction of the 393-point uptrend which started at 2346. If that’s the case, we could keep going until we reach 2589, at a minimum. But this is only a preliminary estimate of what happens next. It is too early to venture an opinion of the future trend with conviction. At this point, we could still go on to make a new rally high before beginning a larger pull-back. That possibility will have to be eliminated by next week’s action before we stand on firmer prediction grounds. We will also have to decide if the December low represents the end of the “bear market” or not and if so, if it will be retested.
There are already a couple of clues to guide us! Last week I mentioned that for the move from 2346 to be only a countertrend rally, it probably should not extend beyond 2714. Perhaps I should have said 2741, which is the current level of the 200-DMA since it was obviously a factor in stopping the advance and causing last week’s 57-point retracement. Another guide post was the declining major trend line from 2941 which has now been exceeded and places the odds in favor of the bear market being over.
If we had a normal retracement of .382 of the advance to 2589 and then went on to rally beyond the 200-DMA, we could then be certain that the bear market is over. That would not exclude the possibility of several large corrections taking place between now and early next year based on cycles and fractals, but none would be deep enough to challenge the 2346 low.
Chart Analysis (The charts that are shown below are courtesy of QCharts)
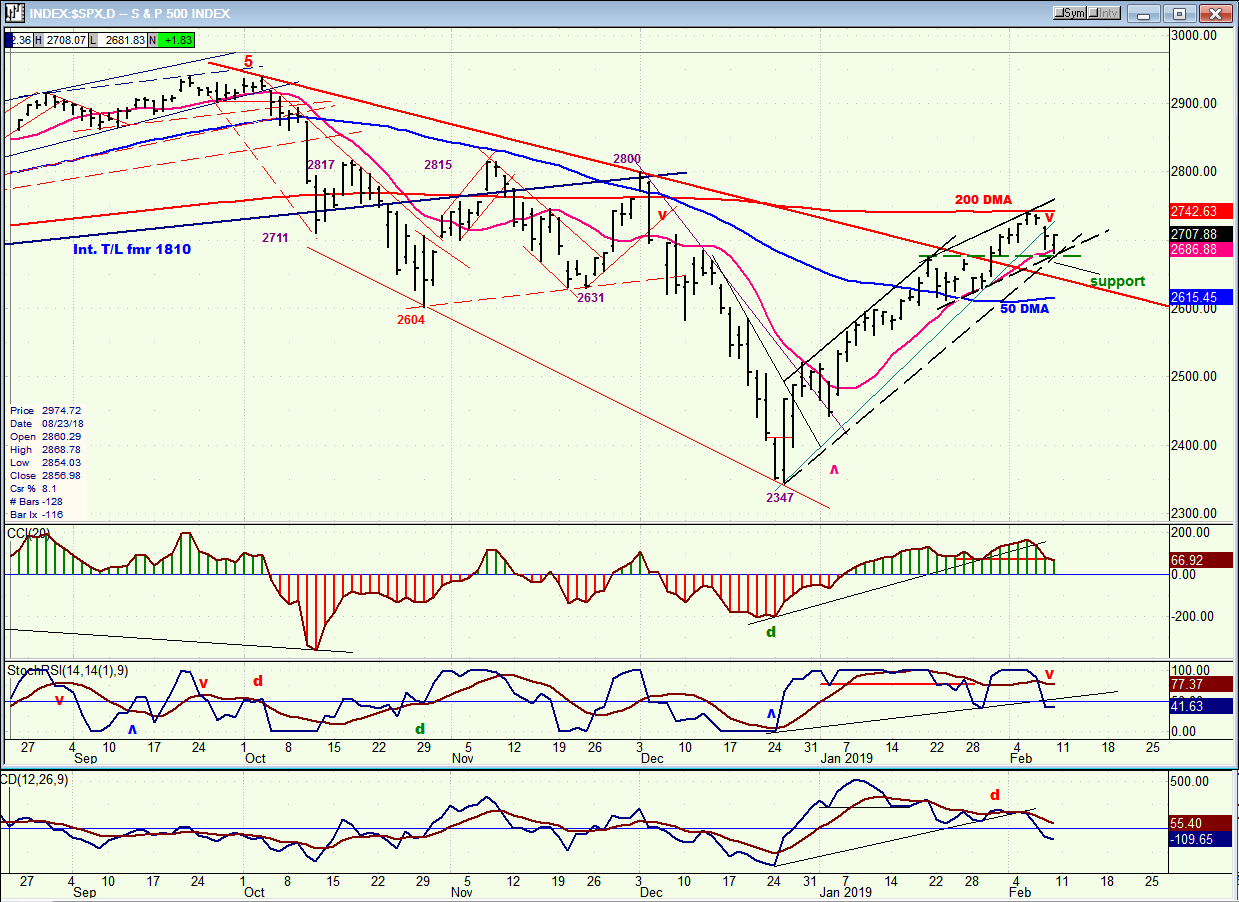
SPX daily chart
It is clear that the immediate vicinity of the 200-DMA has something to say about the trend. In October and November, after an initial penetration to the downside, it stopped two rallies slightly above it. This time, the uptrend was arrested only two points below. The previous trading in that area also contributed to providing resistance which extends to 2800-2815. The initial pull-back from the MA found initial support exactly where it should have and on Friday, the index had a good rebound which retraced almost 50% of the decline from 2739.
If the correction is going to continue, that should be about the extent of the bounce. When we reached 2739, little congestion had formed at the top, and the decline plus the rally will have expanded the congestion pattern, but not enough to give us the count necessary to get us down to the desired level. So we could spend a little time in this area before moving lower.
For the correction to continue, we would also need to see more weakness in the indicators. Already, the two lower oscillators have gone negative, but for a confirmation that we are going to continue to at least 2589, we will need the CCI to become red as well. Also, the decline stopped at the 13-DMA and both it and the 50-DMA will have to be overcome if we are to reach 2589. Cycles do favor the downtrend to extend at least into the middle of the month, and perhaps even to the end of the month.
SPX hourly chart
By Friday morning, the CCI gave us warning that we were about to rally because of the positive divergence that was showing in the indicator. By the end of the day, that oscillator had returned to the zero line and the SRSI had already gone strongly positive. This suggests that the rebound could take us back into the overhead resistance which starts at 2724 but, hopefully, not past 2739 right away.
Friday also closed with a strong 7-point rally in the last five minutes of trading which was matched by similar last minute strength in the DJIA and NDX, but not in the IWM (which makes that show of strength a little suspicious).
I mentioned before that cyclic pressure could extend into at least the middle of the month, and perhaps into the end of the month. But we should keep in mind that if a compromise is achieved on the border issue and Trump agrees to it instead of threatening to shut down the government again, it could decide the near-term fate of the market and take it to a new high right away before a larger correction takes place.

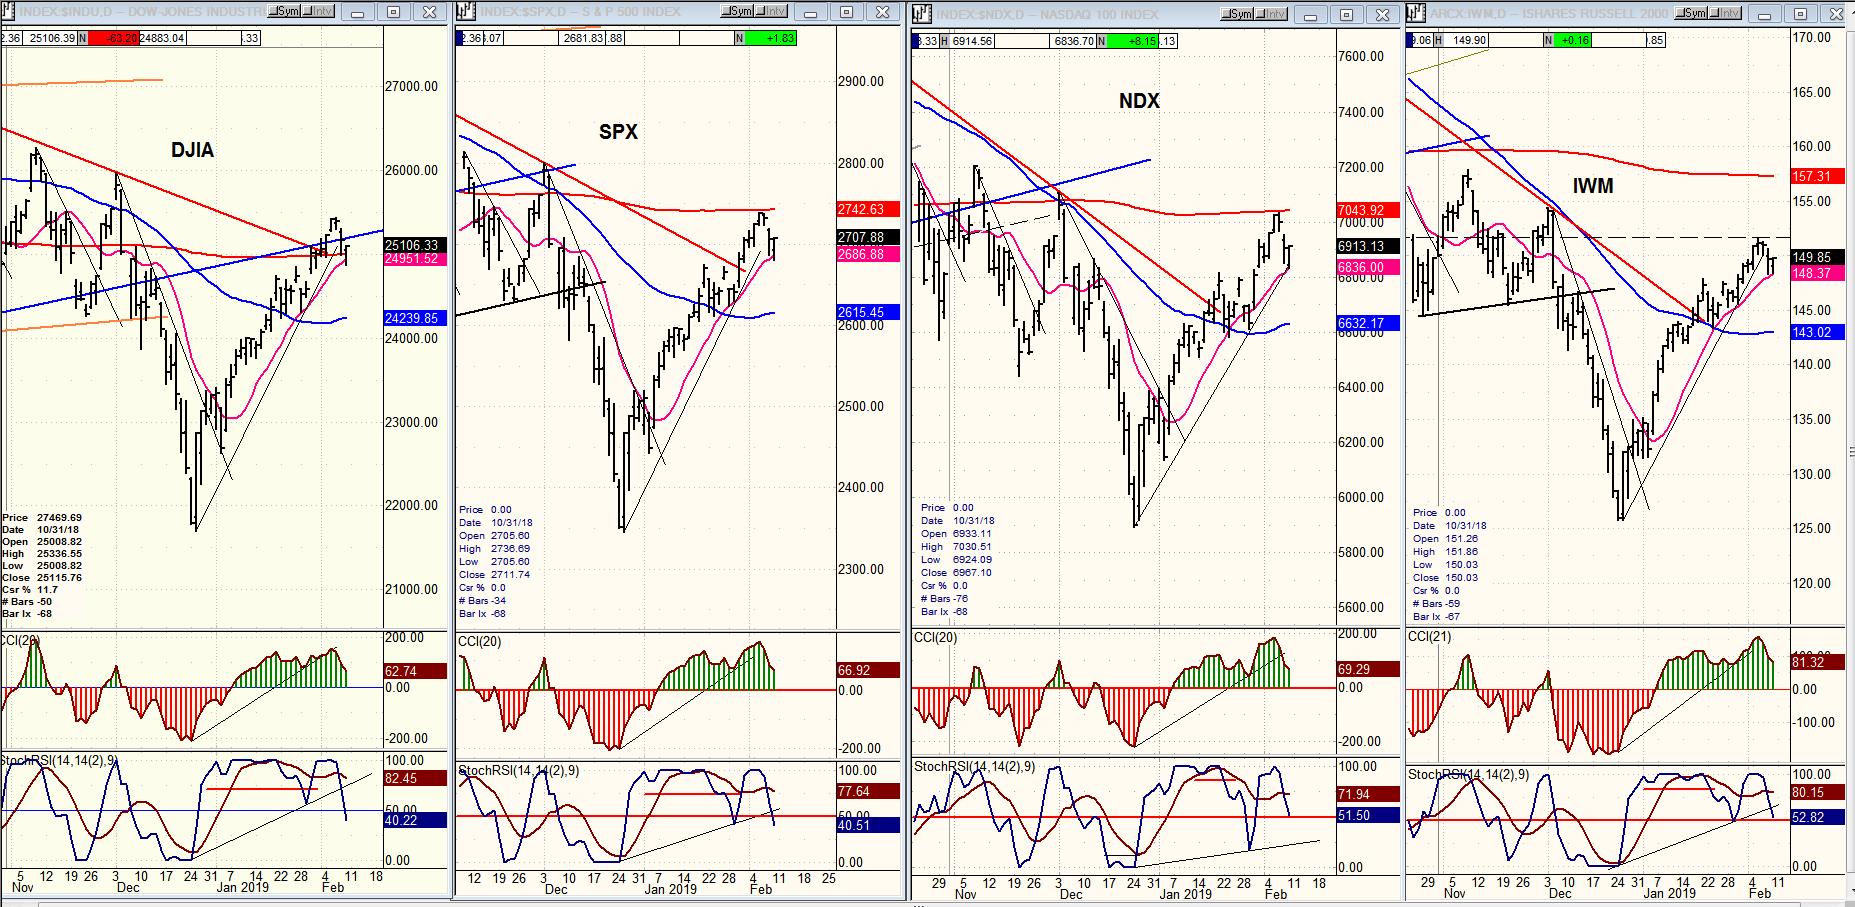
DJIA, SPX, IWM, NDX (daily)
At the daily level, the rally looks pretty much the same for all four indexes. The DJIA is the strongest, having not only broken out of its downtrend line but also having already exceeded its 200-DMA and closing above it on Friday. The DJIA is also the only one which has pulled back to its broken intermediate trend line from the 2016 low.
Looking at these four charts, all four are now above their primary downtrend line, so exceeding the 200-DMA would be the next obstacle to re-establishing their uptrend, although IWM is still well below it. I don’t know what conclusion about the market to draw from this (if any that would be valid).
UUP (Dollar ETF) (daily)
UUP may be very close to having completed its consolidation in a downtrend, especially if this is taking the form of an a-b-c correction. Although it has exceeded its 50-DMA, it is coming into overhead resistance from the previous top and has nearly reached the top of its correction channel. If it cannot push above those channel lines over the next couple of days, it may start retracing, with a good possibility of falling below its 200-dma this time.

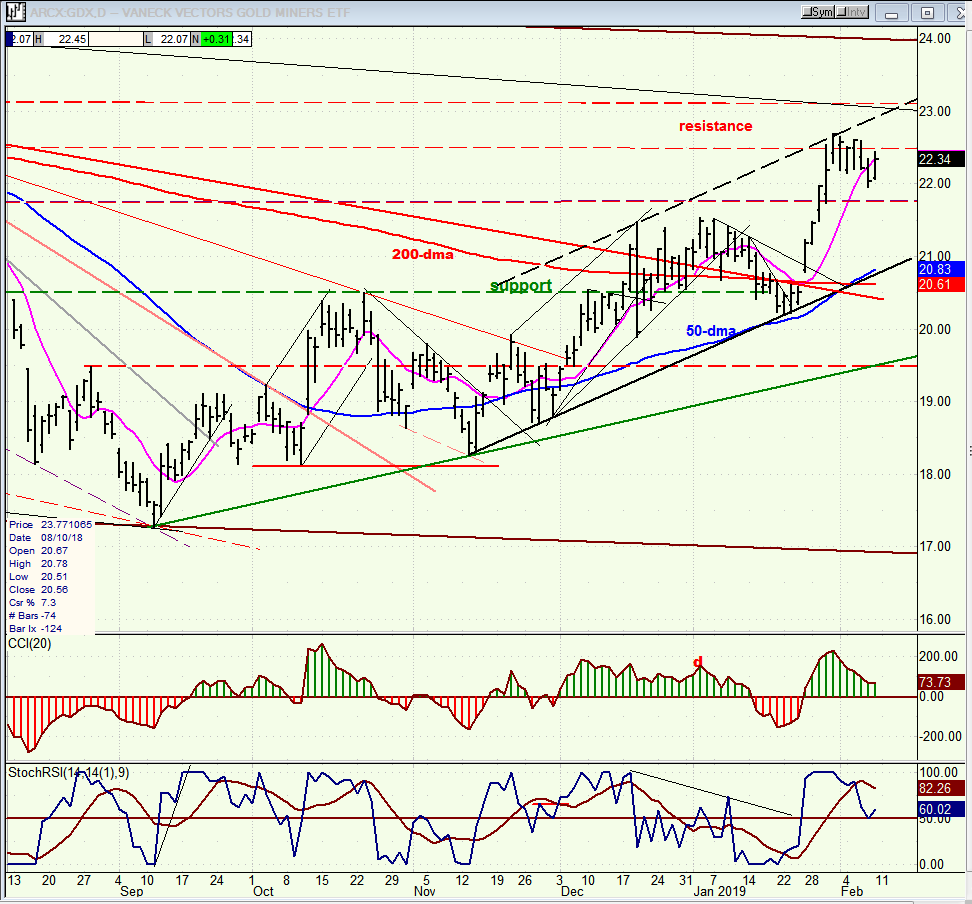
GDX (Gold miners ETF) (daily)
GDX has benefited from the decline in the dollar. It has started an uptrend which looks to go higher as the dollar continues to correct. Higher prices for GDX are also forecast by the base which it has established on its P&F chart. 25.00-25.50 looks like the next target but if it gets beyond that, far higher prices are likely.
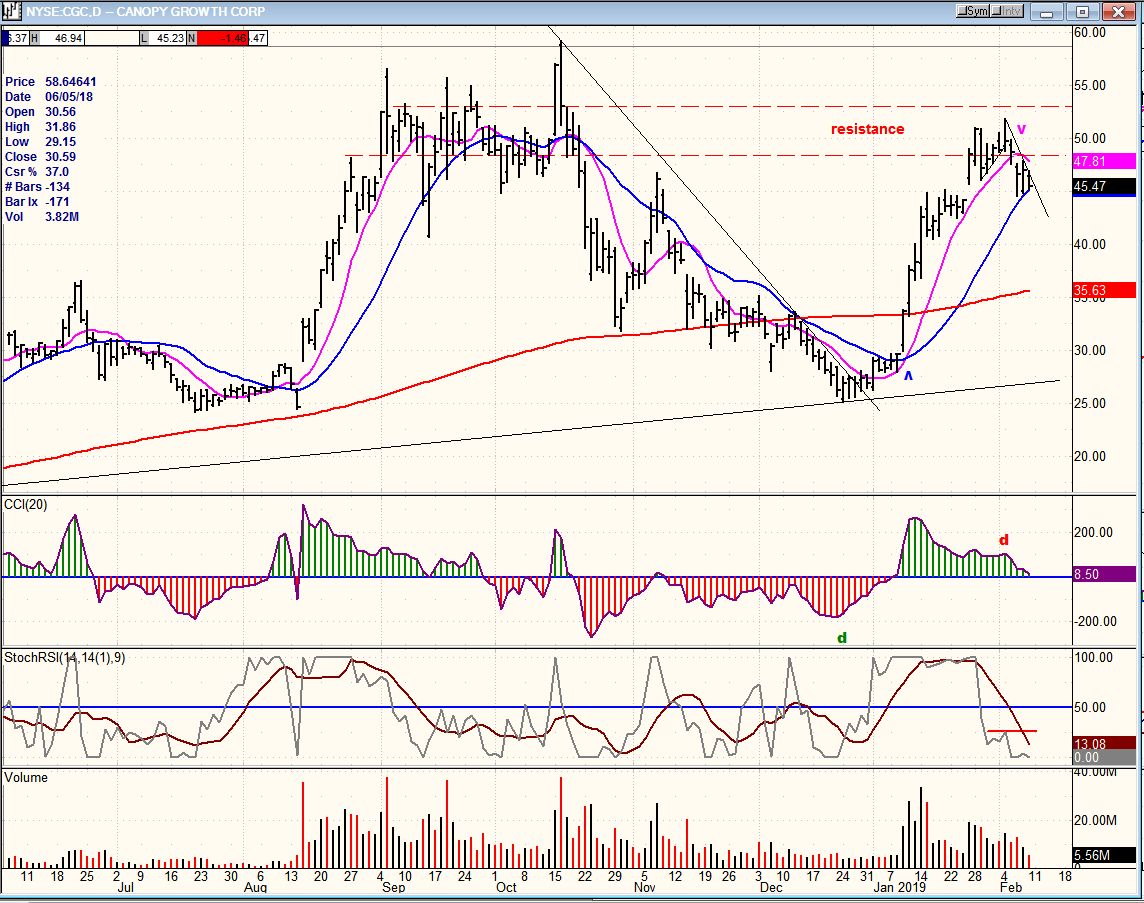
CGC (Canopy Growth) (daily)
CGC pushed into its resistance zone before correcting. It may not be too long before it is able to move above it and advance to about 70.
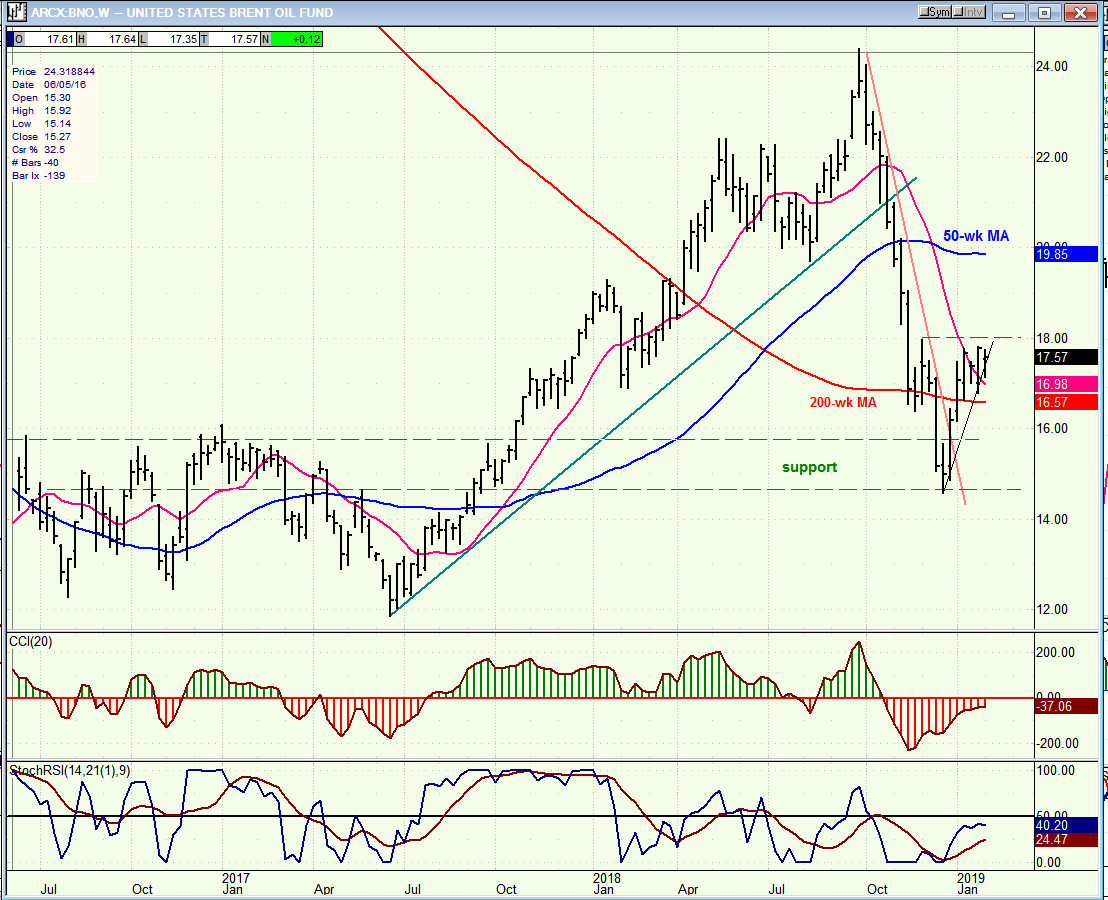
BNO (United States Brent Oil Fund) (weekly)
BNO could move a little higher, to about 18.50 before pulling back and continuing to build a base.
Summary
SPX found resistance at its 200-DMA and pulled back. Next week’s action should tell us if it wants to go past it right away or start a deeper correction first.
FREE TRIAL SUBSCRIPTON
With a trial subscription, you will have access to the same information that is given to paid subscribers, but for a limited time period. I think you will find that knowing how far a move can carry is one of the most useful benefits of this service, whether you are a trader or an investor -- especially when this price target is confirmed by reliable indicators which give advance warning of a market top or bottom. Furthermore, cycle analysis adds the all- important time element to the above price projections.
For a FREE 4-week trial, further subscription options, payment plans, and for general information, I encourage you to visit my website at www.marketurningpoints.com.
The above comments about the financial markets are based purely on what I consider to be sound technical analysis principles. They represent my own opinion and are not meant to be construed as trading or investment advice, but are offered as an analytical point of view which might be of interest to those who follow stock market cycles and technical analysis.

When Andre Gratian was a stock broker years ago, a friend introduced him to technical analysis of the market. Consequently, it is not an exaggeration to say that Andre fell in love with this approach! Ever since then, it has become an increasingly important part of his professional life. Gratian has studied the works of Wyckoff, Edwards & Magee, Edward J. Dewey (cycles) and many others. However, one of my most profitable undertaking has probably been to study Point & Figure charting, which he finds invaluable in analyzing stocks and indices. If he were restricted to one methodology, this is the one that he would choose. This well-rounded background has given him what he feels to be a special insight into the stock market, facilitating the recognition of meaningful patterns and the ‘turning points’ in all trends, whether they be short or long term. Andre feels very comfortable discussing the stock market and passing on meaningful information to others. His subscribers include individuals and money managers throughout the world. Moreover, his Newsletters are currently published on several financial sites, here and abroad.


