Technical Analysis Of The Markets


Current Position of the Market
SPX: Long-term trend – Final long-term phase on the way? How much longer, is the question.
Intermediate trend – The anticipated intermediate-term correction has started. Can’t tell yet if it’s a C-wave or something less.
Analysis of the short-term trend is done on a daily basis with the help of hourly charts. It is an important adjunct to the analysis of daily and weekly charts which discusses the course of longer market trends.
Counter-Trend Rally
Market Overview
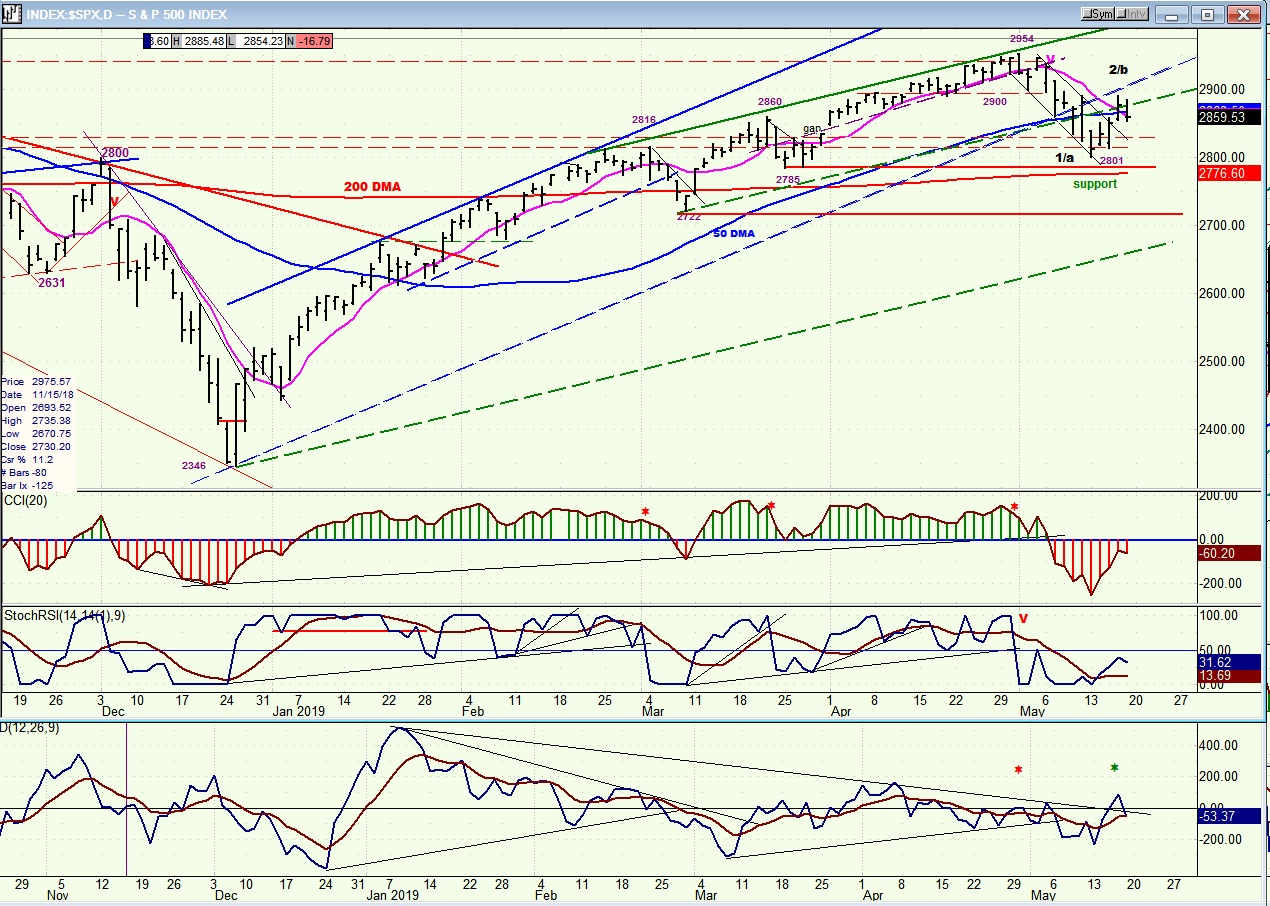
What is technically the first phase of an anticipated intermediate correction came to a stop at 2801 from a high of 2954, or a decline of 153 points. Structurally, this is either a wave-a, or a wave-1. Future action will determine which it is, but either one calls for a rally (wave-b or wave-2) followed by a resumption of the decline. The low was made on 5/13 and since then, SPX has retraced nearly .618 of the initial downtrend, which means that this may be all we get -- although there is enough ambiguity after Friday’s close to suggest that the retracement is not complete.
How far the correction will take us is unclear at this time, but it may be easier to gauge after we have started the second phase and made a new low. Some EWT analysts believe that 2346 was the low of wave-A of a larger correction, and 2955 the high of wave-B, with wave-C just starting, and possibly taking us to a new low before it’s all said and done. From a timing (cycles) standpoint, the correction could continue until August/September and this is enough time to fulfill all prophecies!
Chart Analysis (The charts that are shown below are courtesy of QCharts)
SPX daily chart
By declining to 2801, SPX has come out of both channels, the green one and the blue one. After an initial decline finds support, it is normal for a relief rally to take prices back to the bottom line of the channel which has just been broken (in what is called a “kiss-back”). The five-day rebound almost reached the blue channel line on Thursday before turning back down, but since there is no concrete sign that we are ready to resume the (presumed) primary trend right away, we could push a little higher before turning down again decisively. Of course, if we drive back inside the blue channel, we would have to allow for the possibility of continuing the uptrend instead of starting an important correction; but that is not on the radar, right now.
Proof that we are in an intermediate correction would require dropping back below the 200-dma and the 2722 former short-term low. This would also give us a congestion area above the lower red horizontal line which, on the Point & Figure chart, would give us an idea of how low the correction will eventually take us. It is possible that we extend the downtrend to the dashed green line and continue the primary trend in a broader, green channel. It’s early in the correction and there are many possible scenarios for what lies ahead. As we move forward, these will be eliminated one by one, until only a plausible one is left.
The green asterisk on the lower (A/D) oscillator stands for positive divergence, which suggests a little higher high before we roll over.
SPX hourly chart
I think that the 60m chart is clear enough for you to follow the various trend, channel, and parallel lines, all of which are valid and are serving to identify support, resistance, and various channels.
Several minor descending channels have been broken by the rally from 2801, but the primary one is still intact; and if prices turn down before it is touched, it will reinforce the view that we are in the process of forming a steeper descending channel which will extend below 2800. As for the near-term, the index has broken out of the secondary red channel and has already pulled back to the top channel line, and bounced. It may be in the process of forming a small c-wave prior to pushing a little higher before rolling over to continue the primary downtrend. There is an unfilled count to 2905+ which could turn out to be a good target if the index decides that it is not done.

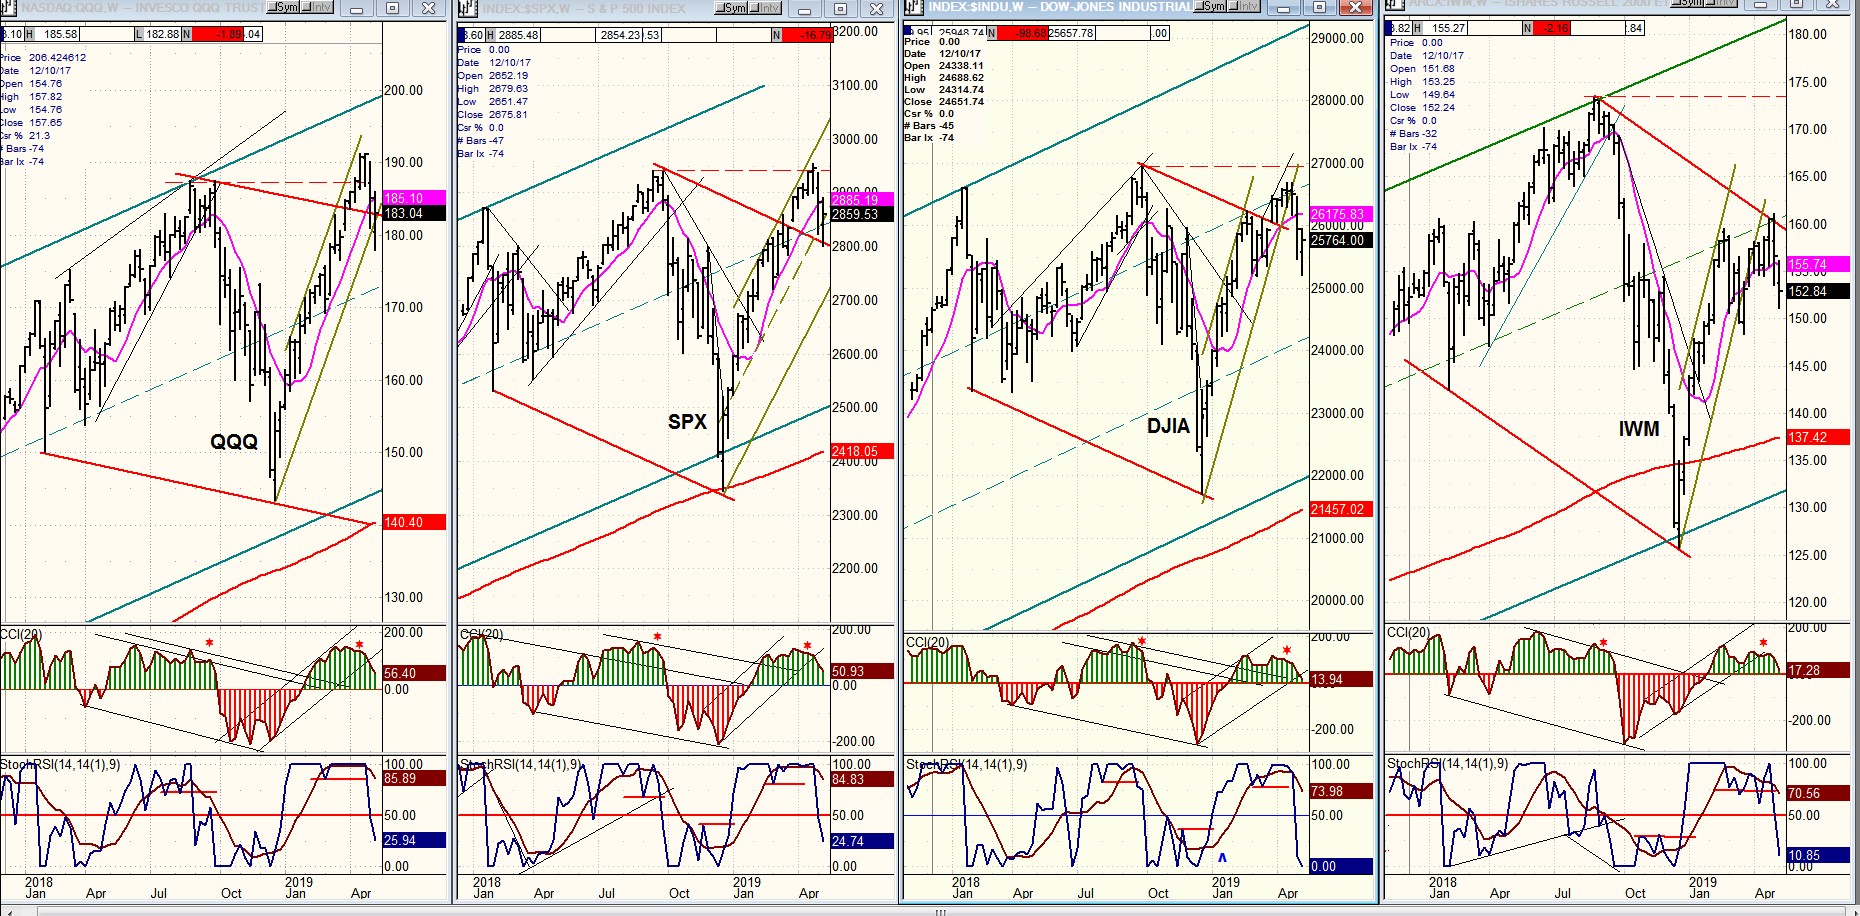
QQQ, SPX, DJIA, IWM (weekly)
I want to stay with the weekly charts of our four indexes because these are the best time frames to determine if we have a confirmed intermediate sell signal. As we can see, the oscillators have only given a preliminary sell signal. The lower oscillator has dropped below the middle line, but the top indicator is still in the green. The RS ranking remains the same.
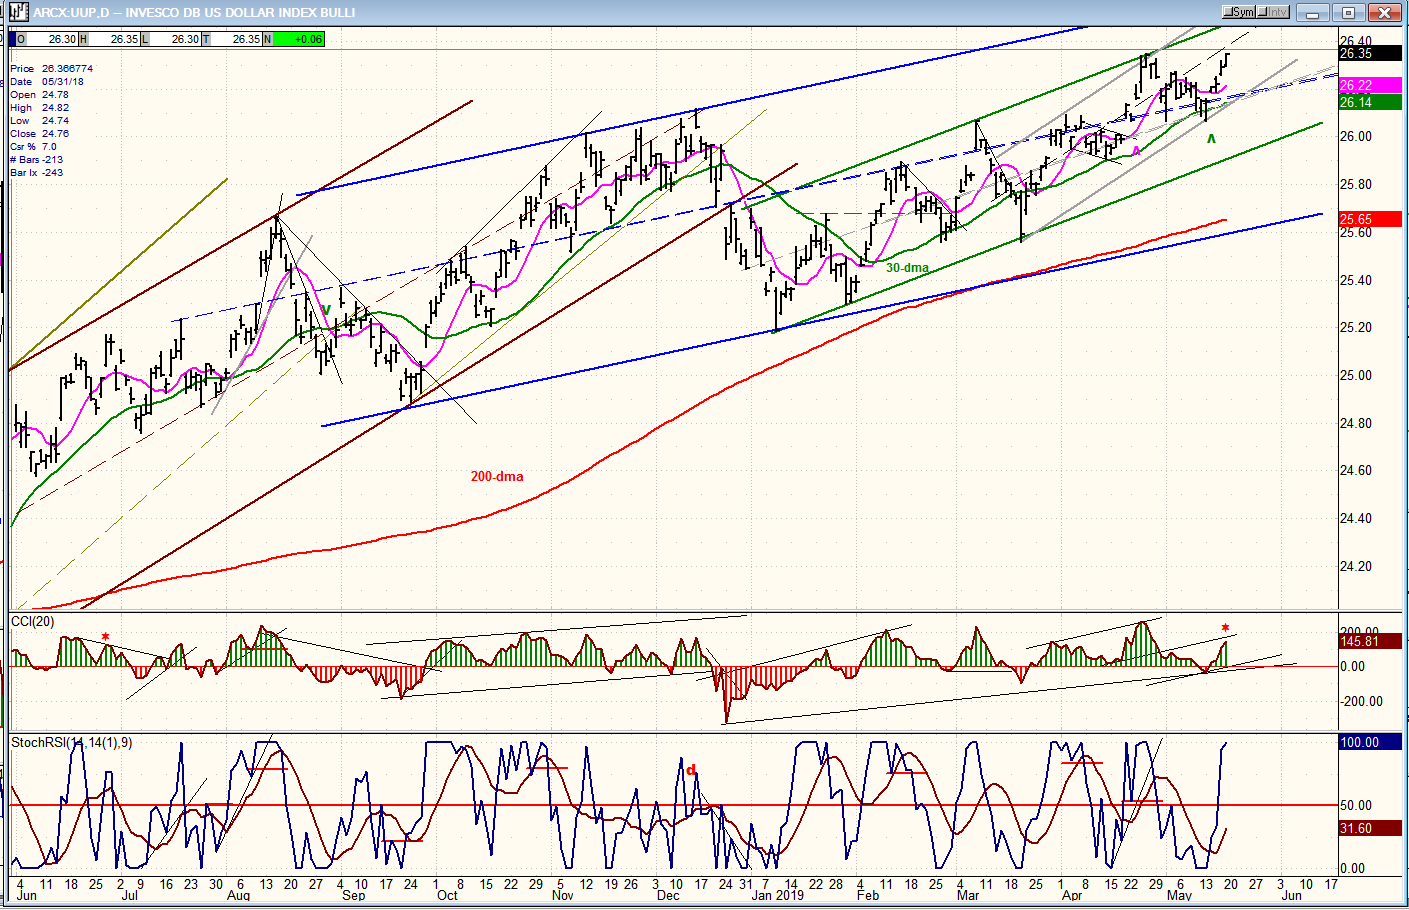
UUP (Dollar ETF) daily
UUP does not show any sign of weakening. It is trading inside various channels of different degrees and we’ll have to wait for the smallest one to be broken before there is any indication of a correction occurring; or, for price to move below the green 30-dma.
GDX (Gold miners ETF) weekly
The weekly chart of GDX gives us a good view of the longer-term trend. It has endured a long sideways consolidation and when it breaks out of it on the top side, it should have a good move. But for now, more patience is required. Persisting strength in UUP is not helping GDX to start an uptrend.

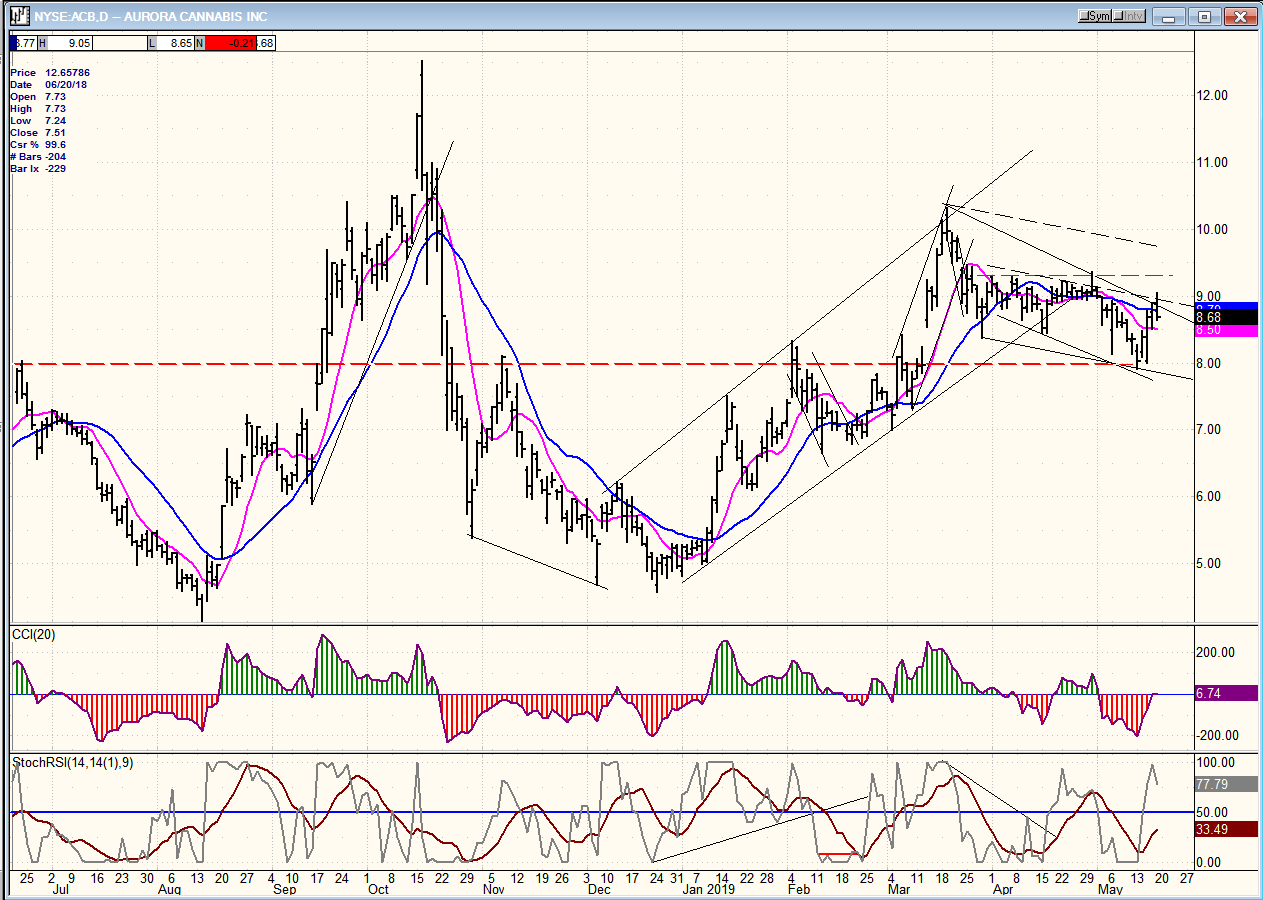
ACB (Aurora Cannabis) daily
ACB sold off to the bottom of a short-term channel and was bought on the red dashed support line as it reported good earnings. It may find it difficult to make more substantial headway when the market resumes its correction – unless there are positive developments in the company.
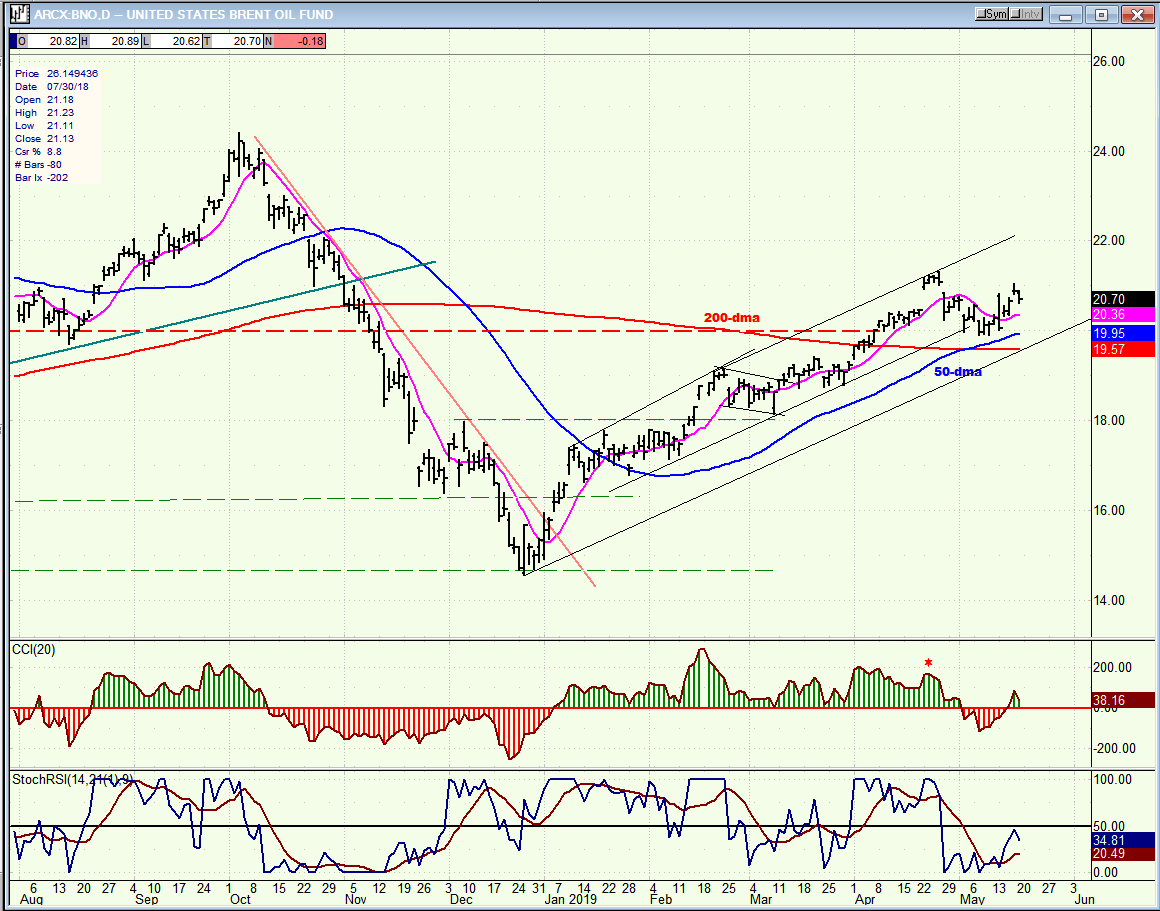
BNO (U.S. Brent oil fund) daily
BNO trades in tandem with the market. We can therefore expect more consolidation when the market resumes its correction.
Summary
After an initial down-phase, SPX is rallying in a countertrend move which could have a little higher to go before the primary downtrend resumes.
FREE TRIAL SUBSCRIPTON
With a trial subscription, you will have access to the same information that is given to paid subscribers, but for a limited time period. I think you will find that knowing how far a move can carry is one of the most useful benefits of this service, whether you are a trader or an investor -- especially when this price target is confirmed by reliable indicators which give advance warning of a market top or bottom. Furthermore, cycle analysis adds the all- important time element to the above price projections.
For a FREE 4-week trial, further subscription options, payment plans, and for general information, I encourage you to visit my website at www.marketurningpoints.com.
The above comments about the financial markets are based purely on what I consider to be sound technical analysis principles. They represent my own opinion and are not meant to be construed as trading or investment advice, but are offered as an analytical point of view which might be of interest to those who follow stock market cycles and technical analysis.

When Andre Gratian was a stock broker years ago, a friend introduced him to technical analysis of the market. Consequently, it is not an exaggeration to say that Andre fell in love with this approach! Ever since then, it has become an increasingly important part of his professional life. Gratian has studied the works of Wyckoff, Edwards & Magee, Edward J. Dewey (cycles) and many others. However, one of my most profitable undertaking has probably been to study Point & Figure charting, which he finds invaluable in analyzing stocks and indices. If he were restricted to one methodology, this is the one that he would choose. This well-rounded background has given him what he feels to be a special insight into the stock market, facilitating the recognition of meaningful patterns and the ‘turning points’ in all trends, whether they be short or long term. Andre feels very comfortable discussing the stock market and passing on meaningful information to others. His subscribers include individuals and money managers throughout the world. Moreover, his Newsletters are currently published on several financial sites, here and abroad.


