Technical Analysis Of The Markets


Current Position of the Market
SPX: Long-term trend – Final long-term phase on the way? How much longer is the question.
Intermediate trend – The intermediate-term correction continues to unfold.
Analysis of the short-term trend is done on a daily basis with the help of hourly charts. It is an important adjunct to the analysis of daily and weekly charts which discusses the course of longer market trends.
Minor Cycles Peaking
Market Overview
“Enough congestion was produced at last week’s low to take the index up to about 2995-3000.”
On Tuesday, SPX surged to a new all-time high of 2995.84 and closed at 2995.82, meeting the projection target set for this move. On Friday, prices dropped to 2968 in the first 2 hours of trading, but then started to recover and finished down only 5 points for the day!
Last week’s action may have spelled the perfect scenario for a short-term top! A climactic move to the target, an initial reversal and a re-test of the high! Considering that a minor cycle peak was expected in this time frame, you could not have asked for better cooperation from the index – providing that we resume the short-term downtrend on Monday and continue to decline into next Thursday or Friday. Even a slightly higher high into the low 3000s would be acceptable, if less perfect.
If the above does occur as foreseen, the correction should continue into early August, at least! Recent strength which drove the index to new all-time highs has bolstered the technical position of the intermediate indicators, and the risk of an imminent return to or beyond the December low has pretty much evaporated. But this does not mean that we have eliminated the possibility of still being in some type of corrective structure.
Technical Analysis (Charts appearing below are courtesy of QCharts.)
SPX daily chart
The original (blue) channel was broken after prices reached a high of 2954, and the decline continued until it had retraced exactly .382 of the move from 2346. The index is now progressing in a new (purple) channel which could still be a corrective major wave IV in spite of the fact that SPX has now risen to a new high. We will know better after seeing the path taken by the index over the next few weeks. If, after the anticipated near-term retracement, we make significant new highs, it will be time to revise our thinking. In order to show that we are still in a corrective pattern, we should come out of the purple channel before making new highs.
As stated above, the market action suggests that it made a short-term top on Wednesday. If so, a reversal from here is likely to find initial support in the area of the dashed red line drawn at the former 2954 top. But we could easily go beyond if enough selling pressure is exerted by the minor cycle which is expected to make its low next Thursday or Friday. Since the top formation may not be complete on the P&F chart, we do not have a firm count for the first leg down, although an immediate reversal would likely generate a decline of about 50 points which would correspond to a retracement to the dashed line or slightly lower.
The daily indicators also suggest that we have arrived at a short-term top. All three have started to roll over and two are showing some minor negative divergence which is more defined in the A/Ds.

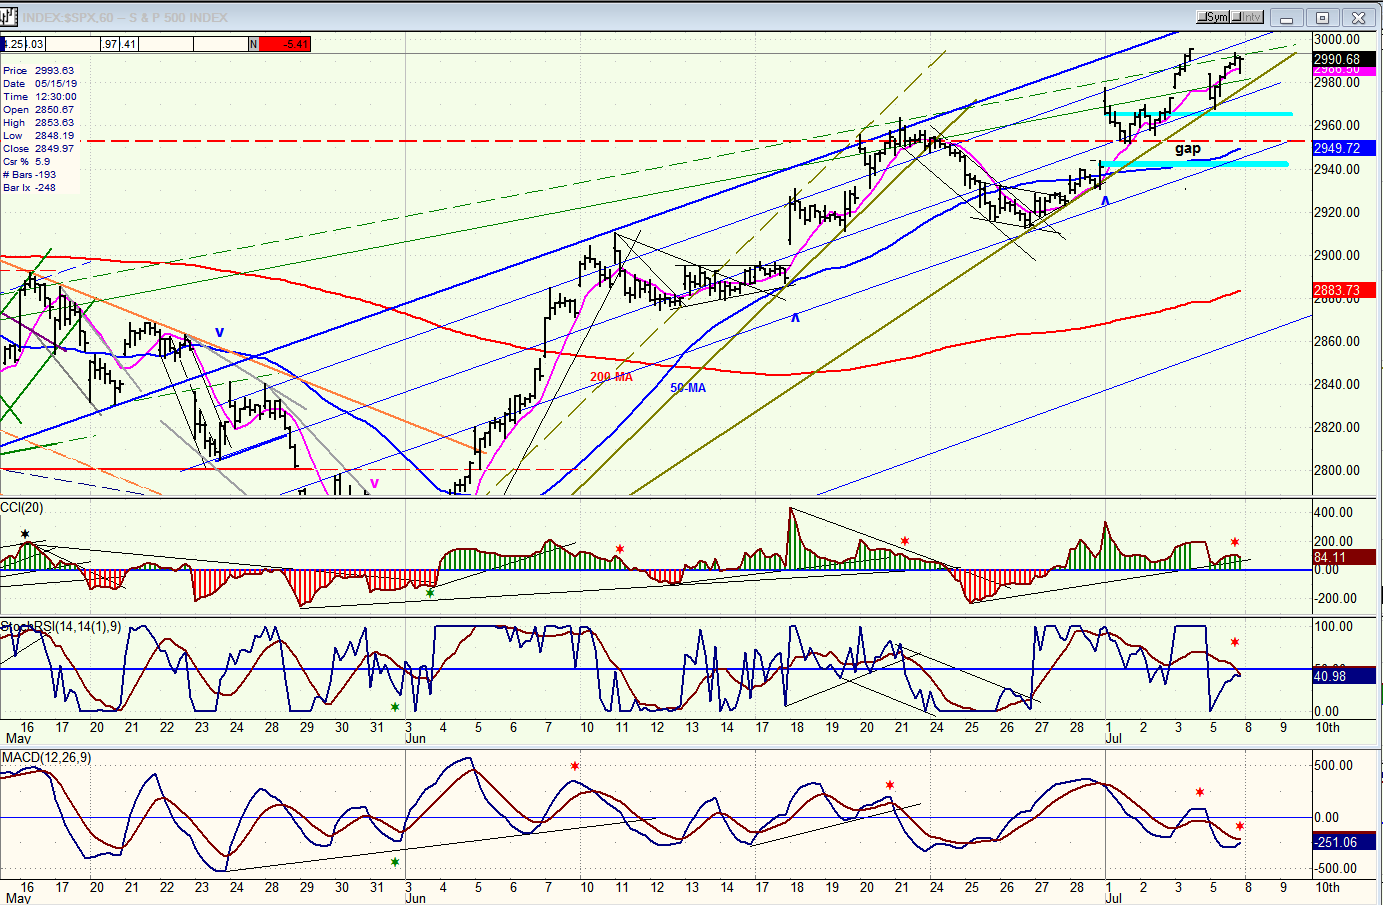
SPX hourly chart
The holiday caused a time gap not adjusted by Qcharts which is somewhat affecting the accuracy of the trend lines, but does not render them totally useless. And it did not affect the heavy blue trend line (// to the blue channel lines on the daily chart) which connects the first two tops of the rally and was not reached at the top of the third peak. This created divergence in the hourly momentum oscillators which worsened on Friday, but not nearly as much as it did in the A/D indicator.
A reversal on Monday-Tuesday would probably target the bottom of the last gap that was left partially unfilled on the last retracement. This is also the area of the (blue) 50-hr.MA which will eventually have to be broken to signal that we have started something more than a minor decline.
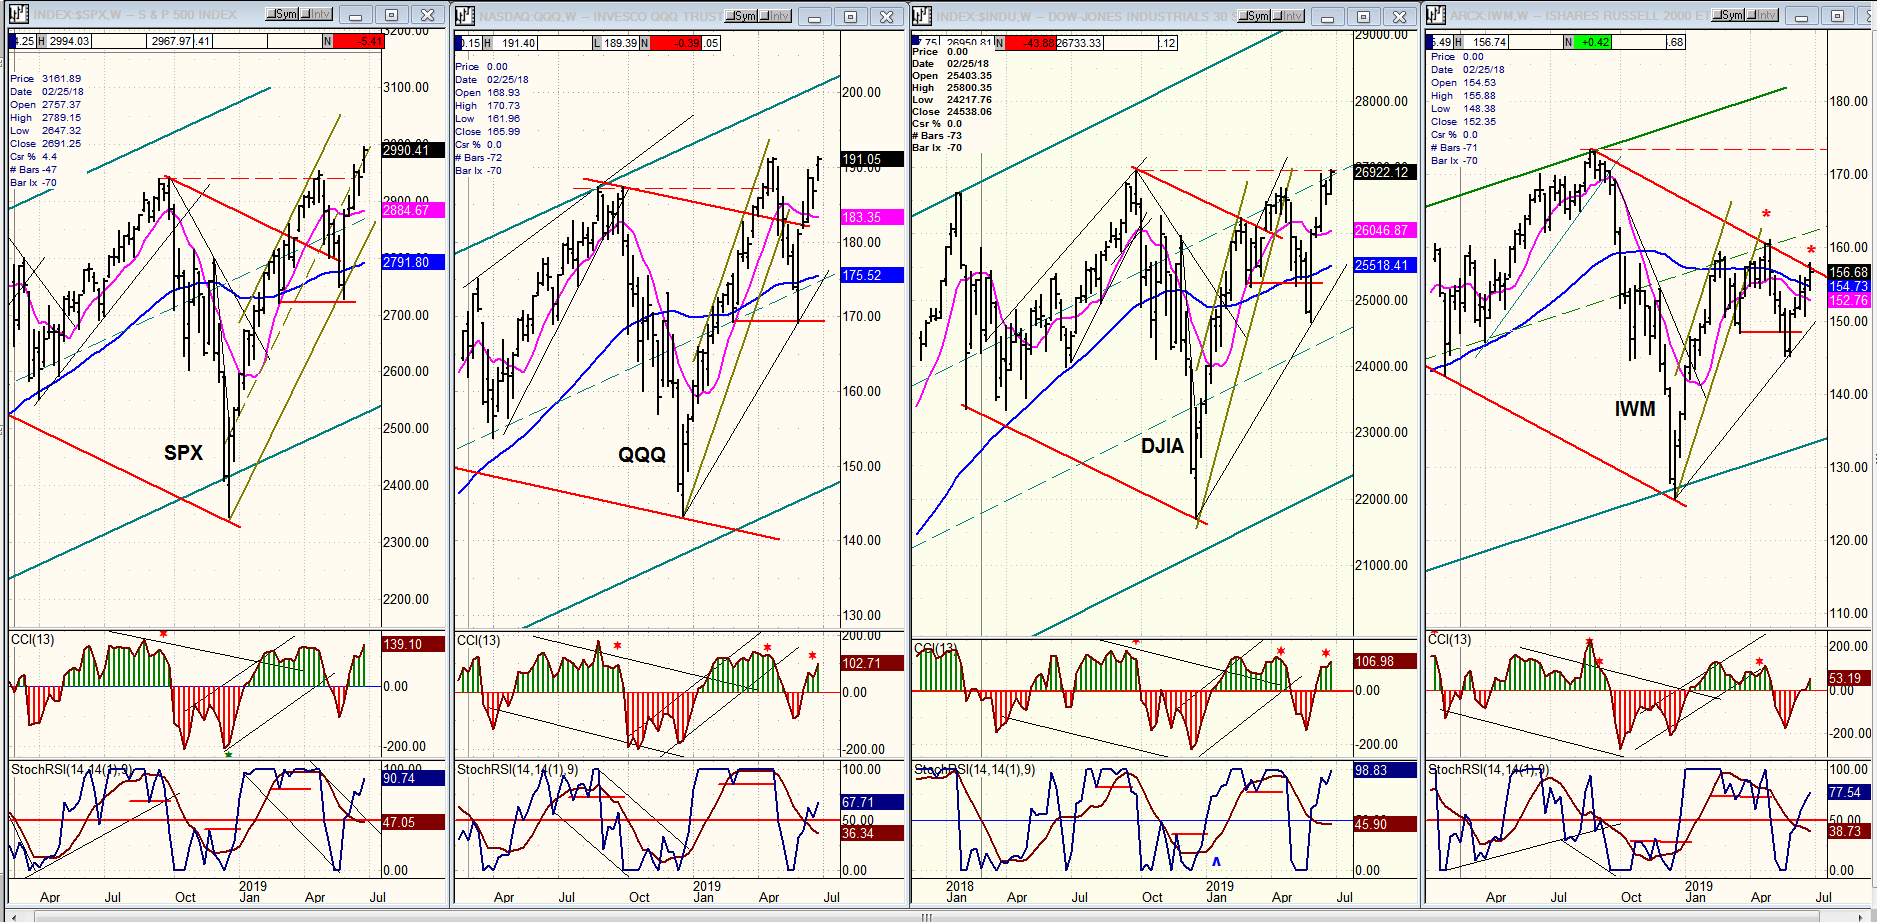
QQQ, SPX, DJIA, IWM (weekly)
If strength in the daily SPX chart creates uncertainty about what the market is doing, this is immediately dispelled when we look at the relationship between the weekly charts. Although DJIA has somewhat caught up with SPX and QQQ, IWM (on the contrary) has recently lost even more RS to the other indices with not just one, but two diverging tops. This should be a clear signal to the bulls that the market strength -- which is confined to SPX now that QQQ has started to underperform – is illusory!
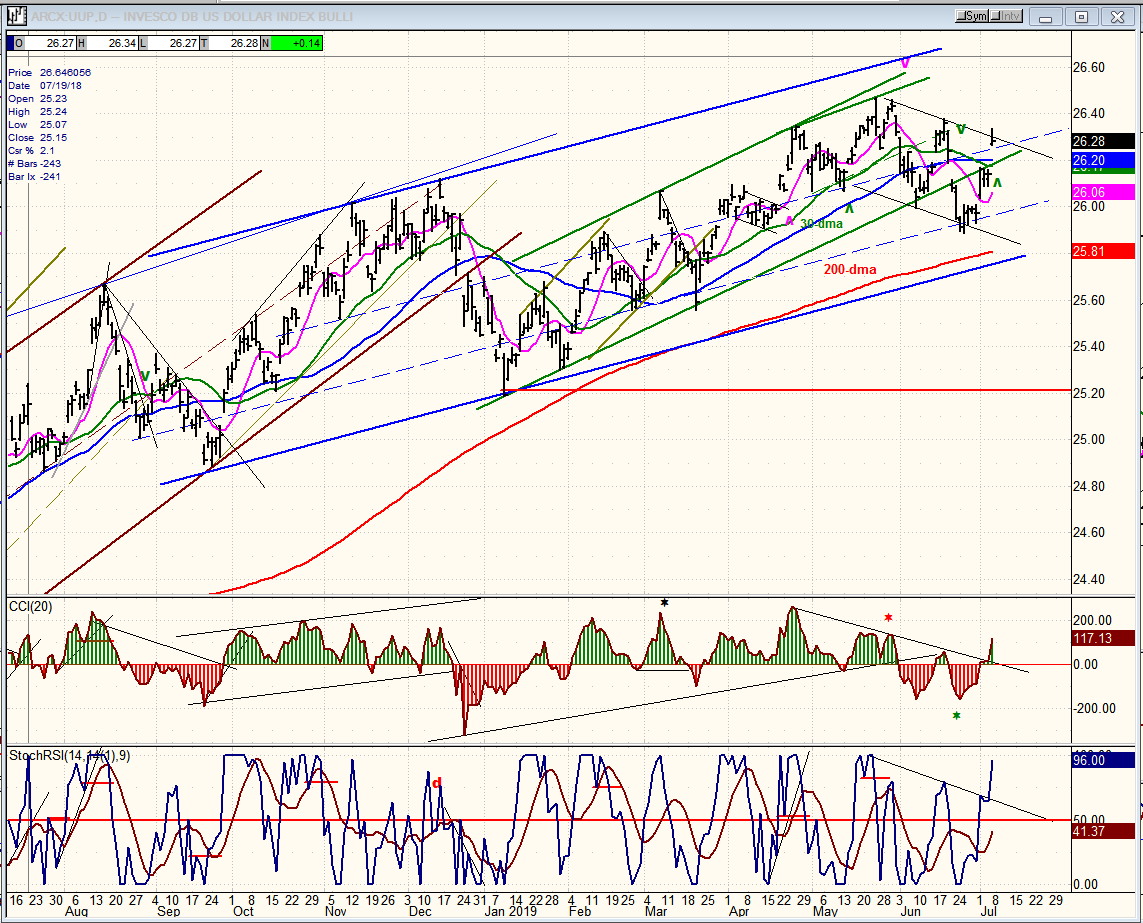
UUP (dollar ETF)
UUP has rallied to the top of its minor declining channel. Best bet is that it will now retrace again; but if it does not…and keeps going, it will prolong the intermediate trend represented by the blue channel
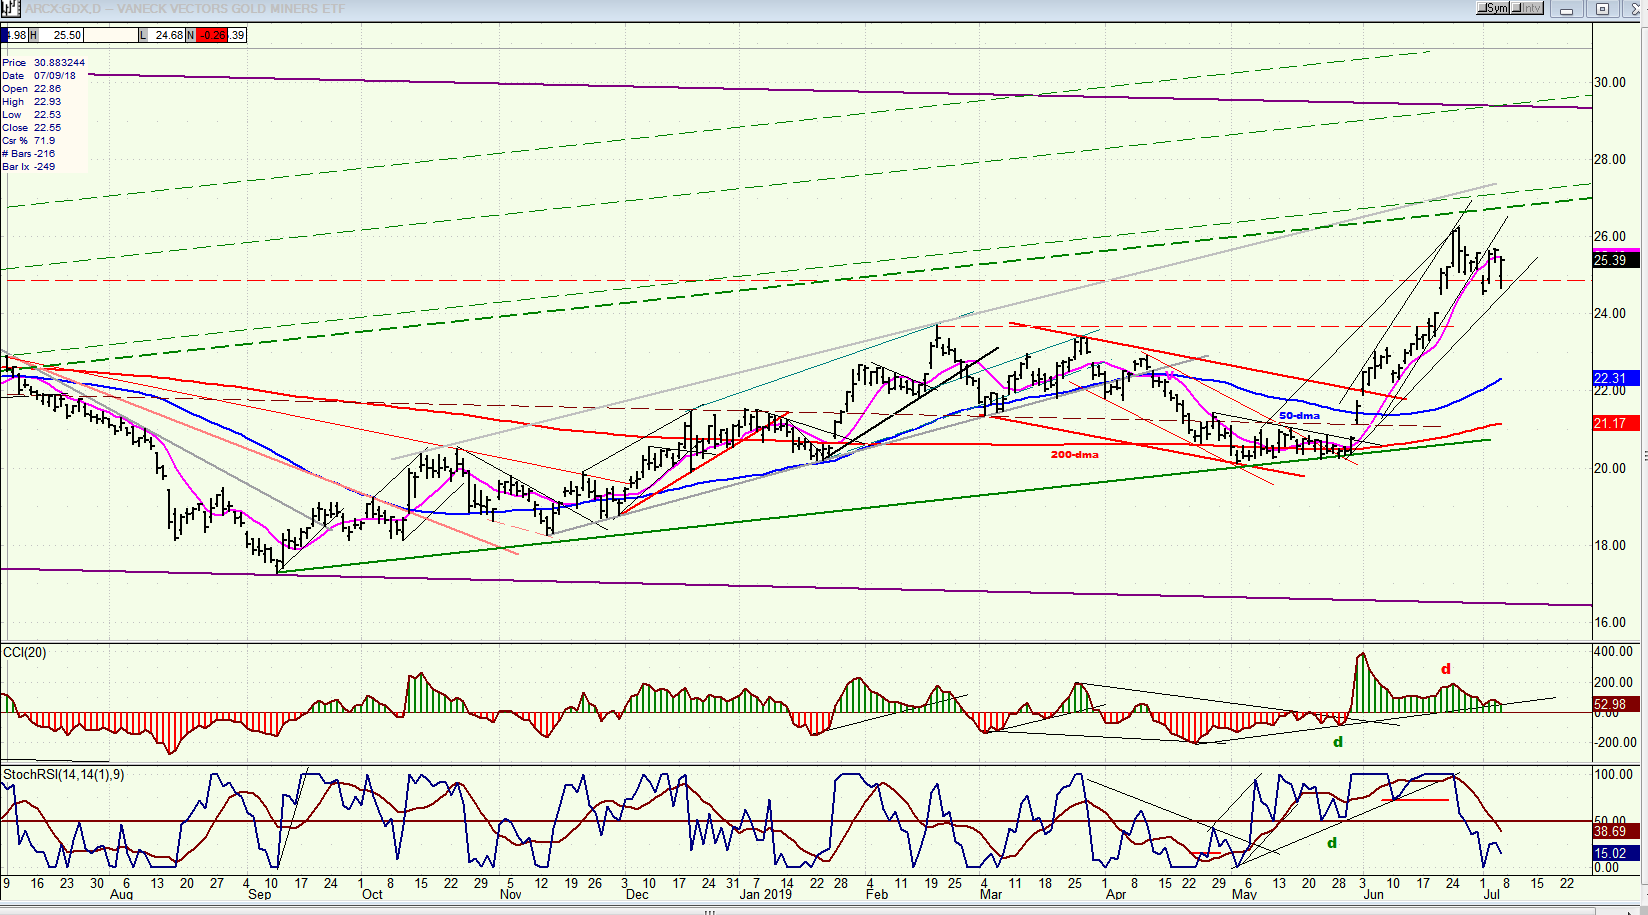
GDX (Gold miners ETF) daily
If UUP retraces right away, it will allow GDX to push a little higher to the top channel resistance (dashed line). It’s unlikely that GDX will go beyond that level until it has undergone a more prolonged correction.
ACB (Aurora Cannabis) daily
ACB probably has more correcting to do before it can break out of the purple downtrend, especially if the market undergoes the anticipated correction.

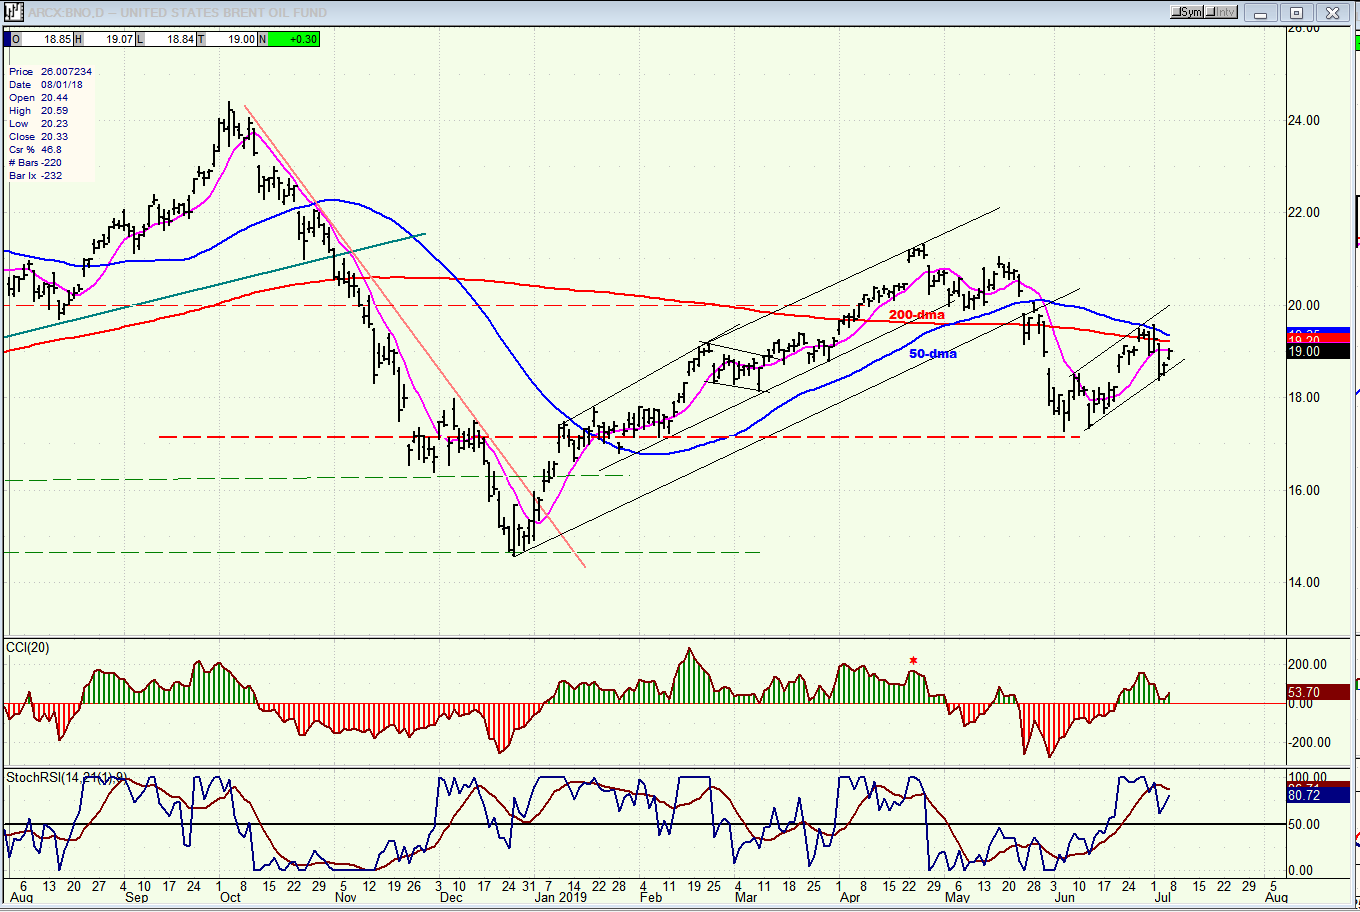
BNO (U.S. Brent oil fund) daily
BNO has completed a consolidation phase and is likely ready to extend its correction.
Summary
Various technical conditions listed above suggest that a market correction should take place as early as next week.
FREE TRIAL SUBSCRIPTON
With a trial subscription, you will have access to the same information that is given to paid subscribers, but for a limited time period. I think you will find that knowing how far a move can carry is one of the most useful benefits of this service, whether you are a trader or an investor -- especially when this price target is confirmed by reliable indicators which give advance warning of a market top or bottom. Furthermore, cycle analysis adds the all- important time element to the above price projections. For a FREE 4-week trial, further subscription options, payment plans, and for general information, I encourage you to visit my website at www.marketurningpoints.com.
The above comments about the financial markets are based purely on what I consider to be sound technical analysis principles. They represent my own opinion and are not meant to be construed as trading or investment advice, but are offered as an analytical point of view which might be of interest to those who follow stock market cycles and technical analysis.

When Andre Gratian was a stock broker years ago, a friend introduced him to technical analysis of the market. Consequently, it is not an exaggeration to say that Andre fell in love with this approach! Ever since then, it has become an increasingly important part of his professional life. Gratian has studied the works of Wyckoff, Edwards & Magee, Edward J. Dewey (cycles) and many others. However, one of my most profitable undertaking has probably been to study Point & Figure charting, which he finds invaluable in analyzing stocks and indices. If he were restricted to one methodology, this is the one that he would choose. This well-rounded background has given him what he feels to be a special insight into the stock market, facilitating the recognition of meaningful patterns and the ‘turning points’ in all trends, whether they be short or long term. Andre feels very comfortable discussing the stock market and passing on meaningful information to others. His subscribers include individuals and money managers throughout the world. Moreover, his Newsletters are currently published on several financial sites, here and abroad.
More from Gold-Eagle


