Technical Analysis Of The Markets


SPX: Long-term trend – Final long-term phase on the way? How much longer is the question.
Intermediate trend – We have started a correction of intermediate nature.
Analysis of the short-term trend is done on a daily basis with the help of hourly charts. It is an important adjunct to the analysis of daily and weekly charts which discusses the course of longer market trends.
Top Almost Confirmed
Market Overview
Last week, the market action came just short of confirming an important top in SPX. On 9/12, the index made a new rally-high of 3021, seven points shy of the 3028 top of 7/26. There was some cautious selling going into the FOMC meeting scheduled for the following week, leading into some volatility when the report was released on Wednesday and taking SPX down to a low of 2979. But buying appeared which drove it back to 3008 by the close. Thursday followed through with a fractionally higher high of 3019, but could go no farther and by Friday’s close the index was back down to 2091.
Double-tops do not come better than this. It’s obvious that the index is meeting with severe resistance at that level, but in spite of the weak close on Friday, we stopped shy of falling below Wednesday’s low of 2979. Another complication is that a cycle was due to make its low exactly on Friday and, although selling continued into the futures, it was not enough to overcome Wednesday’s low, which could have been a slightly early bottoming of that cycle.
Finally, although the hourly indicators remained in a sell mode by the close, only one of the 3 oscillators gave a mild sell signal. Another minor cycle could extend selling into Tuesday-Wednesday which could give us the confirmation which we need. Other considerations will be discussed when we look at the charts.
Market Analysis (The following charts are courtesy of QChart)
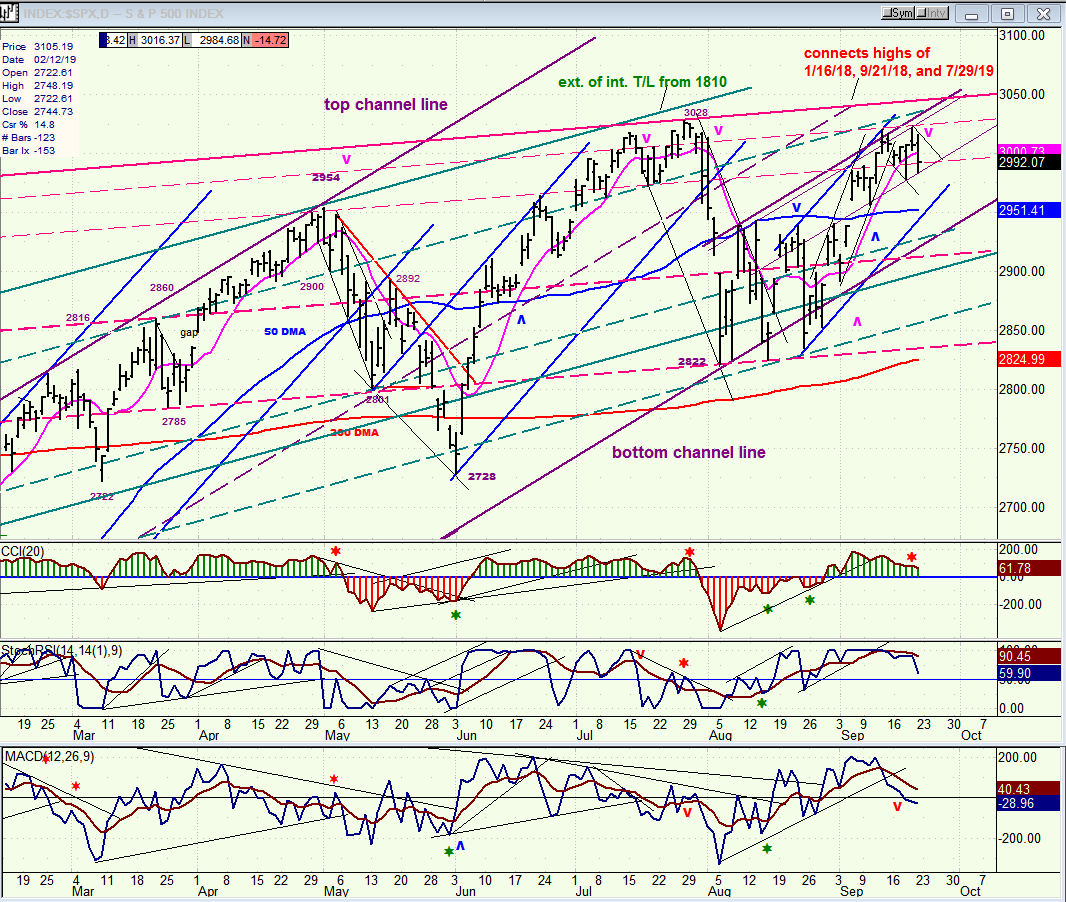
SPX daily chart
For the daily chart analysis, I chose to focus on the area which is critical in determining if we are forming a top. Note that this is a very strong resistance area which has now been tested (and failed) multiple times (the last being this past Thursday) creating a small double top. But looking further back, we can acknowledge a larger double top with the failure of late July. I will even raise the notion that the entire formation going back to May could be a large rounding top. If so, we are not talking here about a short-term correction, but the possibility that we may be starting a major downtrend.
But first, let’s make sure that we have a short-term top. A confirmation could come as early as Monday if the decline which started Thursday continues and takes the index below Wednesday’s low of 2379. Should that occur, 2950 looks like a good initial target. Not only is this the area of the 50-dma, but also that of three former short-term peaks which will should provide good support. A drop to this level would be followed by a rebound of a few days , creating additional congestion to the P&F chart which would help determine the extent of the move down into the 40-week low.
A decline continuing into early next week should also give us a confirmation at the oscillator level by sending all three decisively into the red. As of now, only the early bird A-D indicator is beginning to do so. If we have a sell signal, we will know this almost certainly by the action of the futures when they start trading at 3:00 pm on Sunday.
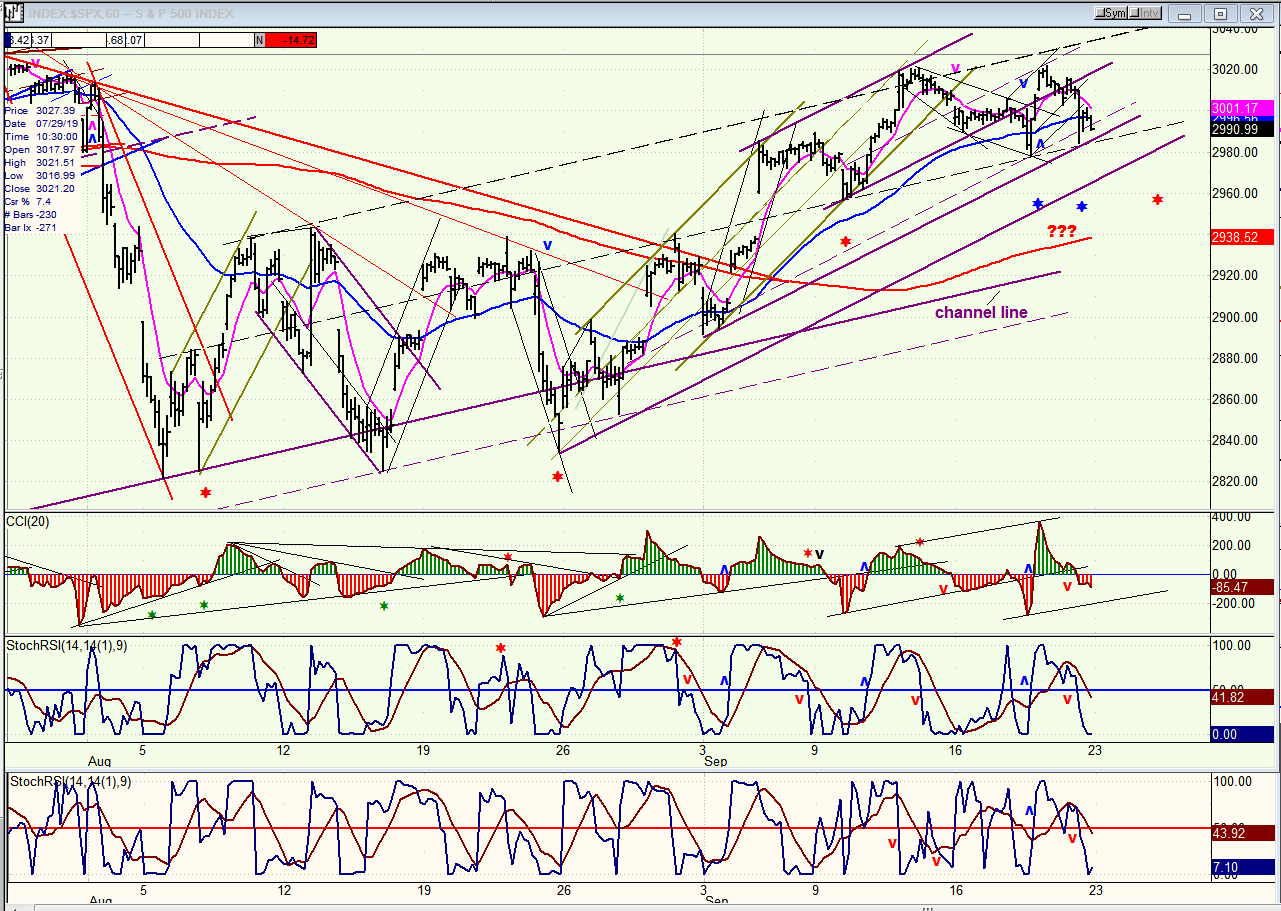
SPX hourly chart
The decline which started from the 3028 top on 7/26 came to an end on 8/05 as support was found on the lower trend line of the larger price channel which originated at the 2346 low in December 2018. That trend line was assaulted on three separate occasions and, although it was breached slightly, it held and generated a rally which now looks like a retest of the previous high, coming to an end last Thursday with a small double top just below 3020. The entire move from August now looks like a consolidation in a downtrend which is about to resume.
The first confirmation that this is what the index is doing would be to continue the decline which started last Thursday at 3019 down to 2950. After a brief hold, we could then expect to resume the downtrend, eventually breaking below 2820 on the way to the 40-wk cycle low expected on about October 15. A failure to confirm could lead to an extension of the short-term uptrend to a new high to about 3050.
What happens next may be determined by the position of a short-term cycle scheduled to bottom around this time. The two possibilities for that cycle low are marked on the chart with blue asterisks, although the second one could be extended to bottom simultaneously with the next ~10-td cycle (red asterisk) bottoming on 9/24-25.
The three oscillators at the bottom of the chart give no indication of a bottom, which places the odds at continuing the decline into Tuesday/Wednesday providing that we move through the two converging trend lines (heavy and dashed) at the opening on Monday morning.
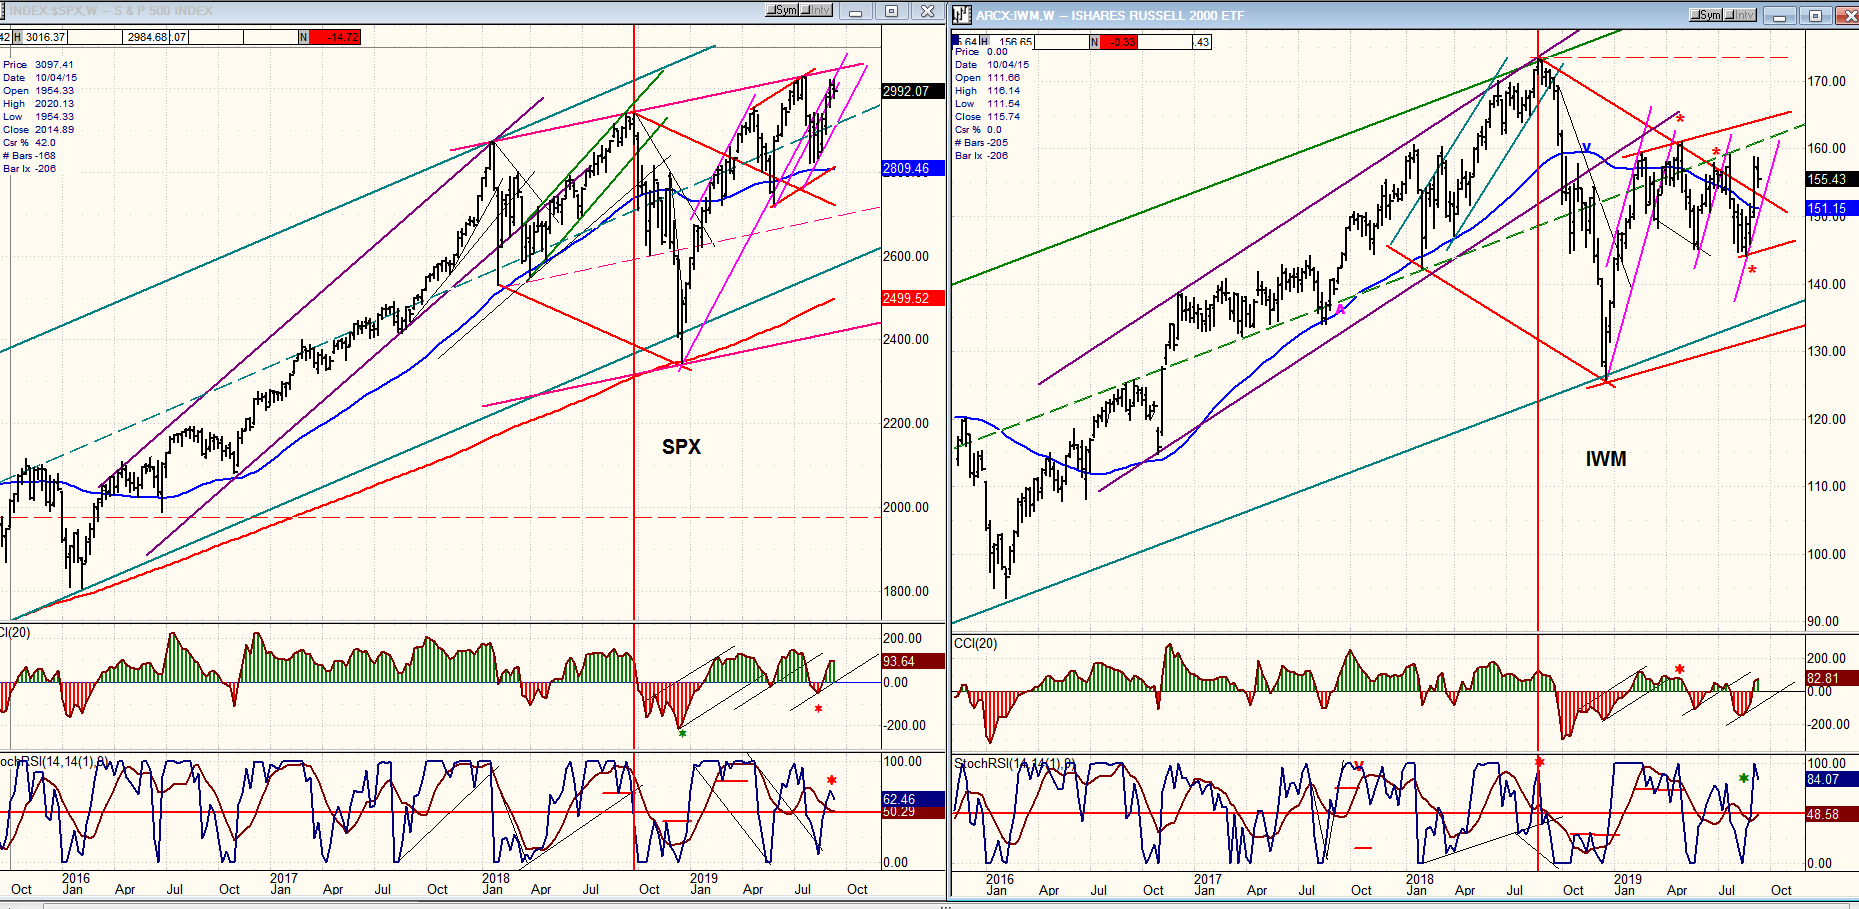
SPX, IWM (weekly)
Showing all four indices does really capture the divergence occurring between IWM and the others So I decided to only show the progress of IWM vs. SPX which is much more revealing.
From March 2009, the beginning date of the current bull market, both indices traded pretty much as equals. This continued after the consolidation which lasted into January 2016 until the October 2018 top, and even into the last 40-wk cycle low of December 2018 and beyond, until February 24 2019. From that point on, IWM started to diverge from SPX and this divergence has lasted util today!
There must be reasons why IWM fell out of favor with investors, but we are not interested in those reasons. It is sufficient to notice to flagrant disparity and speculate on what it portends. Since IWM has a history of being a leading index, topping ahead of the SPX in the first week of july 2007 while SPX made its top three months later in the first week of October, we have to take the current relative weakness seriously, especially since the divergence in 2017 pales by comparison to today’s. Is it just a fluke? Or does it tell us that we should be worried about the near future of the stock market? Of course, we won’t know that for certain until after the fact, and the only thing of which we can be fairly sure is that we are ostensibly just a few weeks away from the low of the next 40-wk cycle which, in itself deserves caution. The market does not allow us to see very far with great clarity, but the contrast between the behavior of the indices before December 2018 and afterward may signal something bigger than just a correction over the next few weeks.
UUP (dollar ETF) daily
UUP has made a climactic move above the top of its channel and appears to be making a distribution ledge which could/should resolve itself downward, through the smaller green channel. More time is needed to confirm that this is the next move.

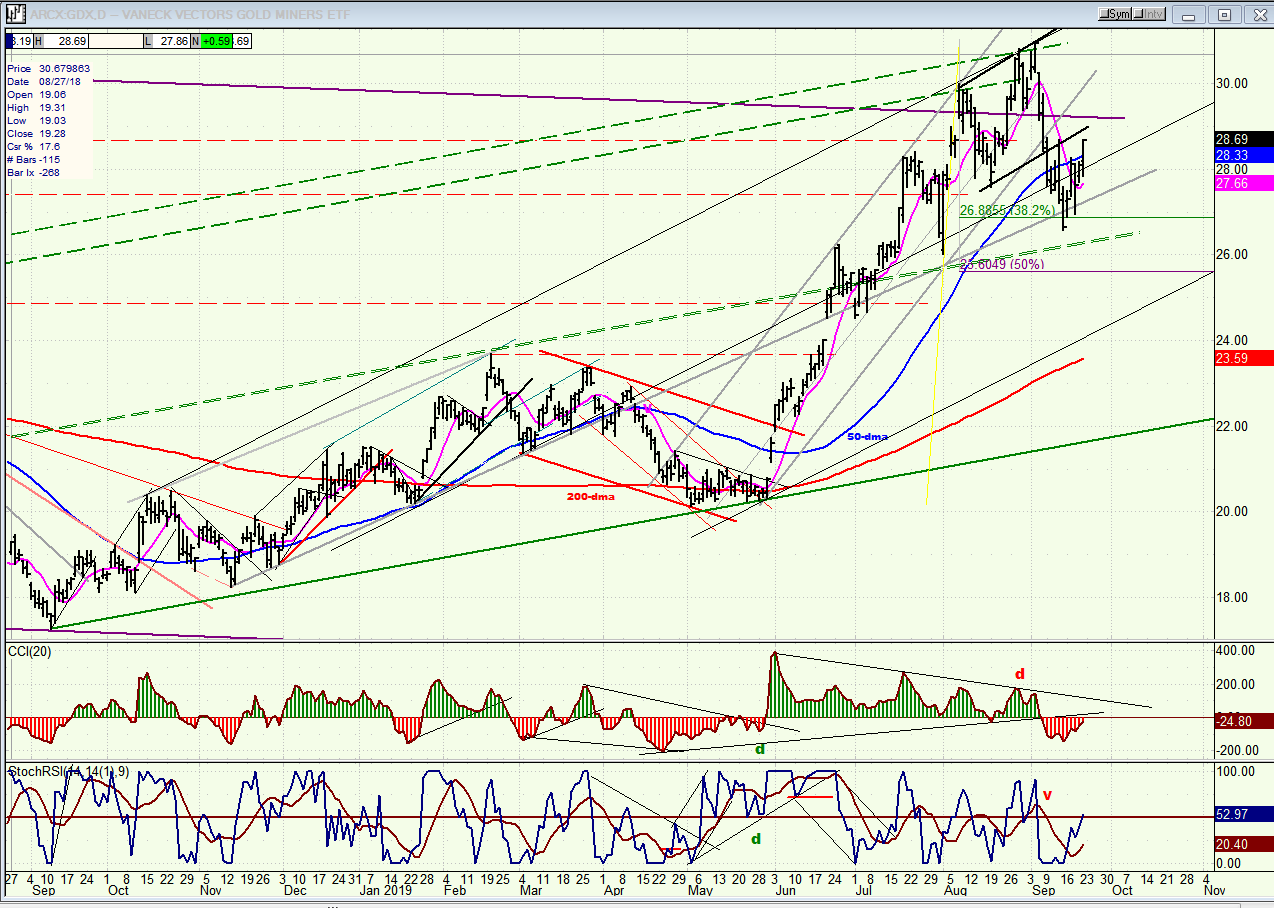
GDX (Gold miners ETF) weekly
GDX has retraced .382 of its second uptrend and may be ready to move above the broad channel line one more time, perhaps in search of a 31 target which was missed by a fraction the first time. It has some resistance just above Friday’s close which it will have to overcome, first and would be helped by some additional weakness in equities.
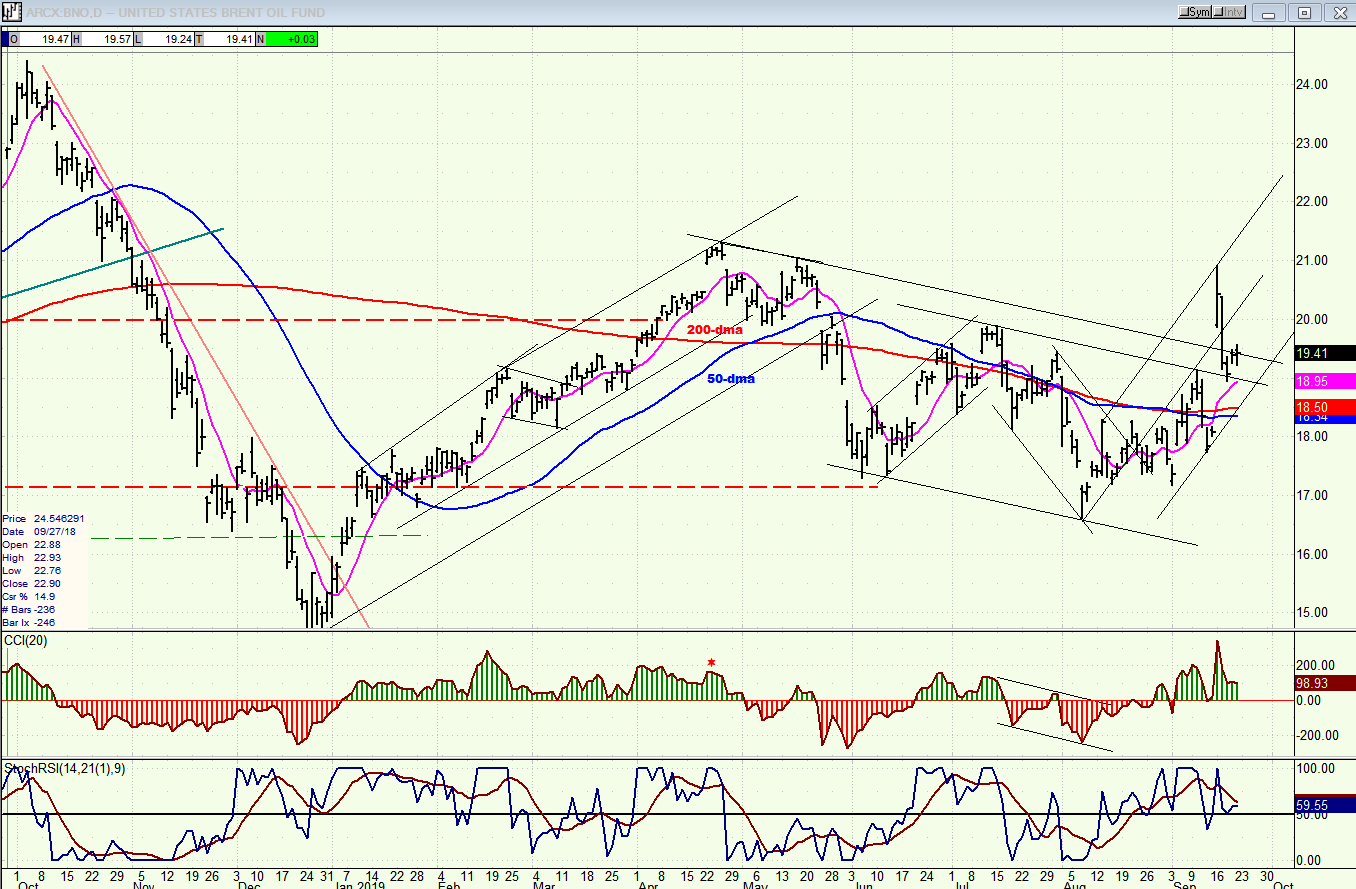
BNO (U.S. Brent oil fund) daily
BNO had a sharp rally after the strike on the Saudi facilities. It has so far retraced half of it and should continue lower as the market sells off.
Summary
SPX is at a critical level and must confirm that it is resuming its downtrend from 3028 or risk making a slightly new high first.
FREE TRIAL SUBSCRIPTON
With a trial subscription, you will have access to the same information that is given to paid subscribers, but for a limited time period. I think you will find that knowing how far a move can carry is one of the most useful benefits of this service, whether you are a trader or an investor -- especially when this price target is confirmed by reliable indicators which give advance warning of a market top or bottom. Furthermore, cycle analysis adds the all- important time element to the above price projections. For a FREE 4-week trial, further subscription options, payment plans, and for general information, I encourage you to visit my website at www.marketurningpoints.com.
The above comments about the financial markets are based purely on what I consider to be sound technical analysis principles. They represent my own opinion and are not meant to be construed as trading or investment advice, but are offered as an analytical point of view which might be of interest to those who follow stock market cycles and technical analysis.
********

When Andre Gratian was a stock broker years ago, a friend introduced him to technical analysis of the market. Consequently, it is not an exaggeration to say that Andre fell in love with this approach! Ever since then, it has become an increasingly important part of his professional life. Gratian has studied the works of Wyckoff, Edwards & Magee, Edward J. Dewey (cycles) and many others. However, one of my most profitable undertaking has probably been to study Point & Figure charting, which he finds invaluable in analyzing stocks and indices. If he were restricted to one methodology, this is the one that he would choose. This well-rounded background has given him what he feels to be a special insight into the stock market, facilitating the recognition of meaningful patterns and the ‘turning points’ in all trends, whether they be short or long term. Andre feels very comfortable discussing the stock market and passing on meaningful information to others. His subscribers include individuals and money managers throughout the world. Moreover, his Newsletters are currently published on several financial sites, here and abroad.
More from Gold-Eagle


