Technical Analysis Of The Markets


Current Position of the Market
SPX: Long-term trend – Final long-term phase on the way? How much longer, is the question.
Intermediate trend – We have started a correction of intermediate nature.
Analysis of the short-term trend is done on a daily basis with the help of hourly charts. It is an important adjunct to the analysis of daily and weekly charts which discusses the course of longer market trends.
Caution Warranted
Market Overview
On Friday, with daily SRSI and the A-D indicator already in the red, the daily CCI dipped into the red. That makes it unanimous and tips the market trend from neutral to negative. It is not something that should be ignored! In the past, this has led to a serious decline. In addition, the 40-wk cycle low is still expected to be ahead of us and, unless it turns out to be a total wimp this time, more weakness – perhaps significant -- can be expected.
On Friday, SPX made a new low since its short-term double-top of 2022 on 9/19. At one point, it was down 32 points for the day, but
found support once again on the 50-dma, and rallied. The fact that this is the end of the month and that it was a Friday, probably helped as well. We’ll have more to say about the 50-dma when we analyze the daily SPX chart. For now, as pointed out in the daily update, the 10-11-td cycle only made its low two days ago and was probably a factor in preventing further damage to the index. But the fact that its Tuesday low was exceeded by a good margin suggests that larger cycles are still bearing down, and is a suggestion that the 40-wk cycle low is still ahead of us.
Analytic minutiae can be revealing in determining the market trend. Naturally, it is not decisive and must be enforced by future market action. This is why next week will be an important week for market watchers!
Market Analysis (The following charts are courtesy of QChart)
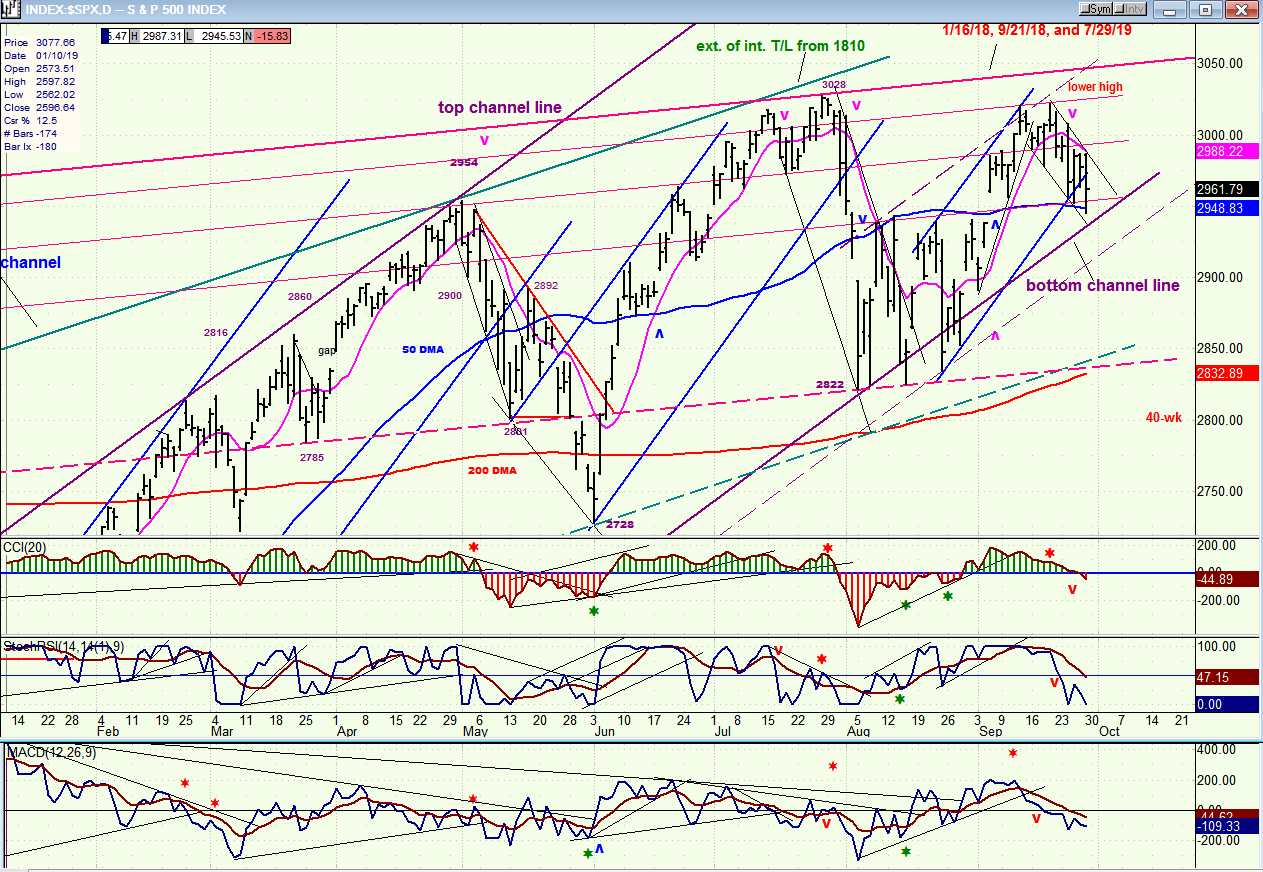
SPX daily chart
On 7/26 SPX made an all-time high at 3028. On 9/19, it made a secondary (lower) high at 3022. If it should now trade below 2822 over the next few weeks, it would, by technical definition be in a downtrend (lower high, lower low). For those concerned with the longer-term trend, this is what must be determined – as well as what it signifies if it should happen! A good precursor to this determination would be whether the index can break out of the current trend channel established since the December ‘18 2346 low.
The lower channel line has already been challenged on three separate occasions. On the first, it held. On the next two, it was breached, but not enough for prices to close decisively below it, and a rally ensued. This rally came to an end in the form of a double-top at 3022. Prices are now nearing the bottom channel line once again. Will it hold this time?
The odds are that it won’t. Being breached earlier is already a sign of weakness. If it is tested one more time, the odds are very good that it will give way this time. I have already mentioned some technical signs that this will happen. Another is that the blue 20-dma was also breached on Friday and, although it held for the second time, not only did SPX trade outside of the small bullish (blue) channel, but it also closed outside of it. Unless next week can provide a very strong rally to a new high, I suspect that a failure to move beyond 2988 and turning down will prove to be a big negative.
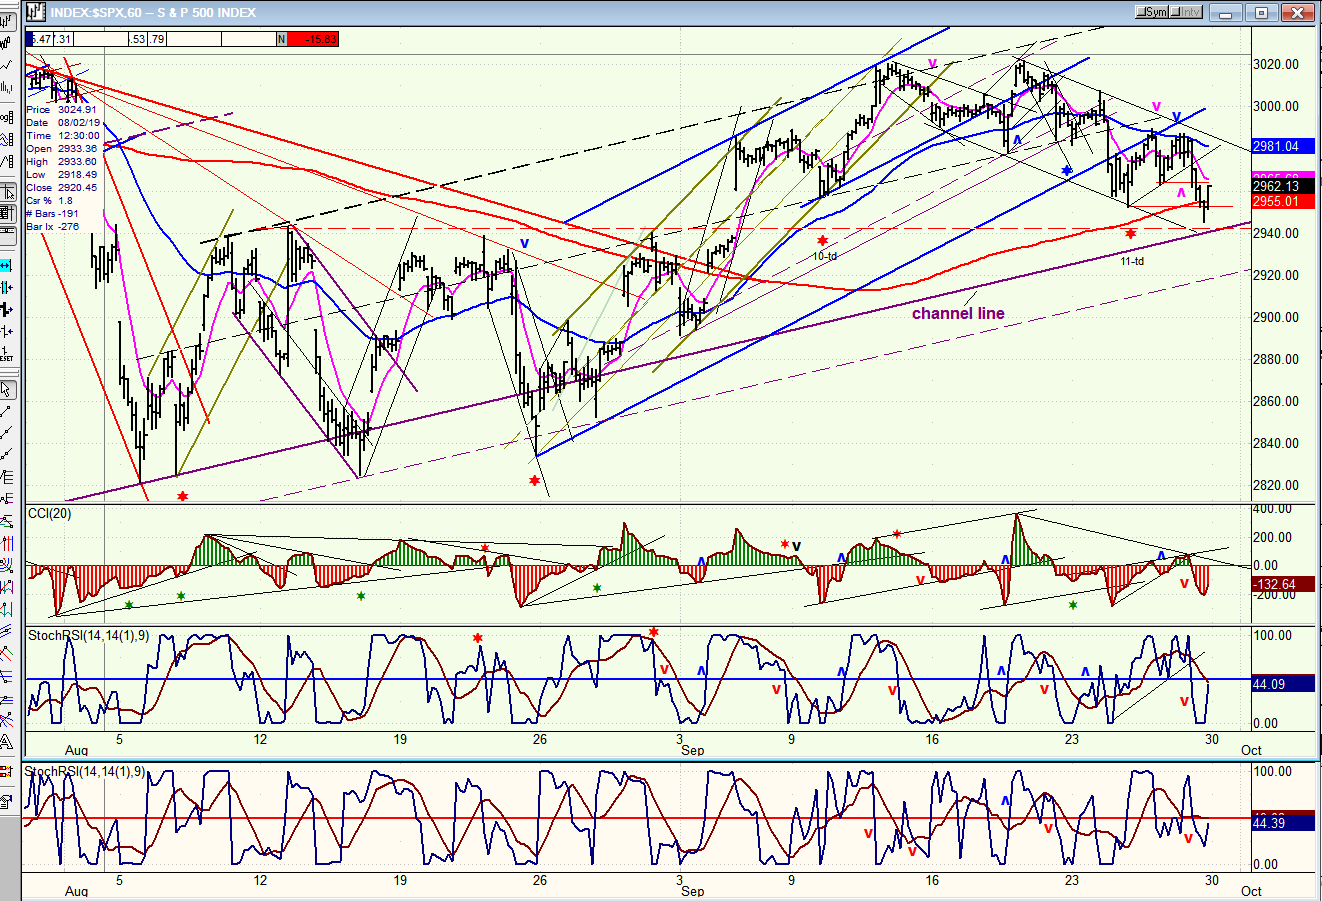
SPX hourly chart
The 60-m chart below is essentially the analysis of the blue channel which is a smaller fractal replica of the previous two blue channels shown on the daily chart. That is has already been beached beyond repair is not contestable. The index is now concerned with holding above the larger (purple) channel bottom line. Besides the reasons given earlier why it held, we can see that there were others: it came in contact with the 200-hr MA, it came within touch of the larger channel line, and it also nearly touched the tops of the previous highs formed earlier. Is it any wonder that it found support on Friday?
The strength or weakness of the index will now be evaluated by its immediate follow-though action. If it can get out of its minor bearish channel by rising above 2988, it will be proof that a serious resurgence of buying may be taking place. If, instead, it turns down from a lower level, all the reasons why it held on Friday will be re-tested and given a chance to succeed once again -- or fail!
We could find out as early as Monday!
SPX, IWM (weekly)
This week, I am going to make a pure analysis of the SPX and IWM weekly charts, without the help of oscillators.
Actually, very little analysis is required since a quick glance at the two charts leaves no doubt that IWM has the weakest trend of the two, and by a wide margin. Since IWM has a tendency to lead the SPX, it should concern SPX bulls that this index is about to follow in the path of IWM, namely downward. Furthermore, until this relative strength relationship changes and IWM shows signs of reversing its trend to the upside, we can also pretty much assume that SPX will continue its downtrend until that relationship turns positive.
Only a few points are needed to state the obvious. IWM made its bull market high a year ago. SPX made its high 2 months ago. The red channel shows that IWM is now in a downtrend, perhaps trying to come out of it, but Friday’s close back inside the channel negates that assumption unless more proof is provided. SPX just barely missed getting back to the top of the red channel and turned down on Friday. It must hold its previous low of 2822, or it will confirm that it has started an intermediate downtrend. If it breaks below that level, it has two basic alternatives: it can find support at the mid-channel (dashed) line of its red channel, around 2700, or it can go all the way lower and test several support points ranging from 2400 to 2600.
Let’s see what it does.

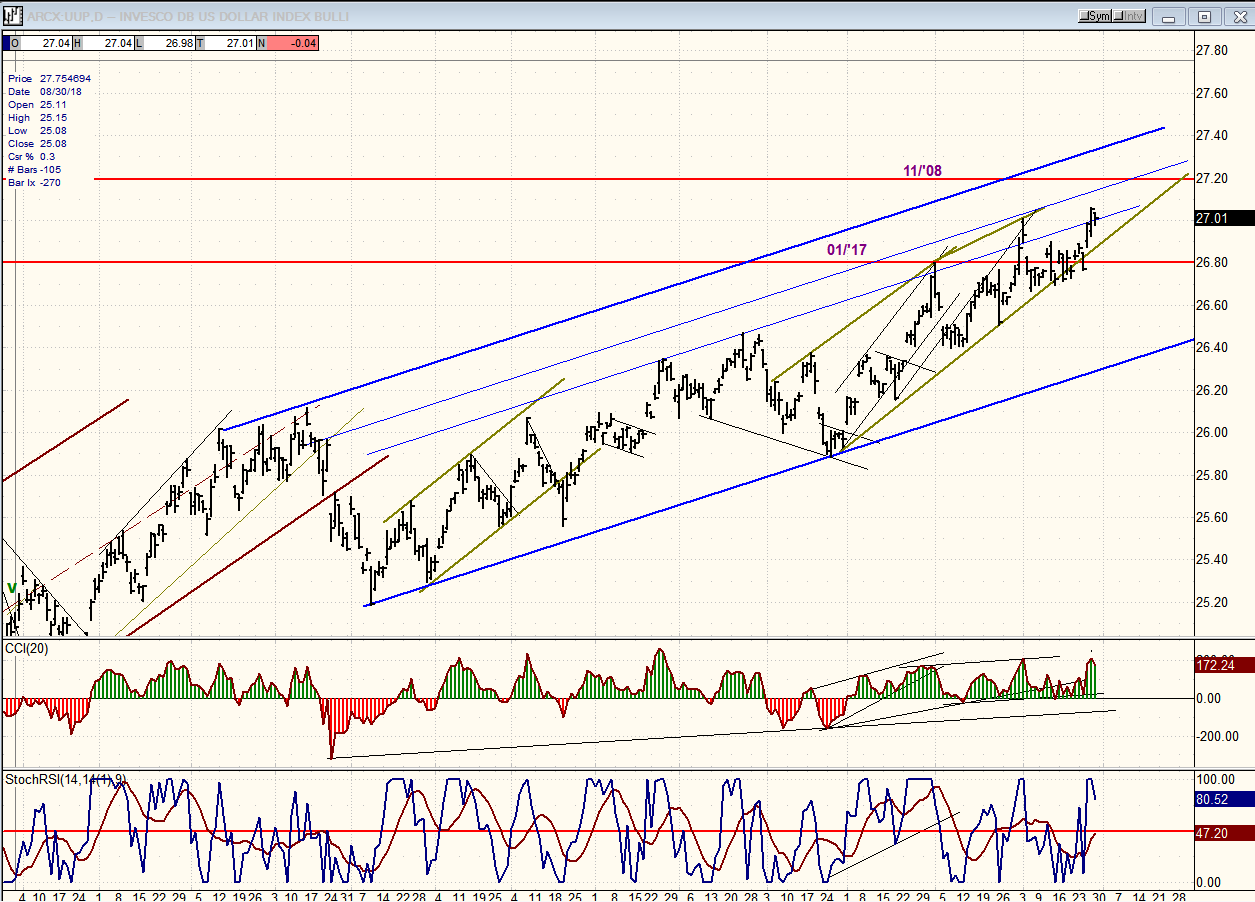
UUP (dollar ETF) daily
I do not know if UUP will eventually make it to the top of its blue channel, but I have expanded it to allow for more upside since last week it made another new high. I don’t think it would be wise to buy it at this level, but it does not look as if it is ready for an immediate collapse. At best, the green channel segment may be beginning to roll over.
GDX (Gold miners ETF) weekly
After a good run which increased its value by over 50% in three months when it broke out of a base which had been nearly two years in the making, (but which may still be under construction longer term), GDX was in need of a normal correction which has already caused it to retrace .382 of its break-out phase and may try for 50% before it’s over.
Since it has fairly close ties to the move in the dollar (but inversely), if UUP is still going up, GDX may wait until the former is ready to correct before it ends its own correction. However, it is probably best to evaluate the trend of each one on its on merits instead of looking for an exact inverse correlation.

BNO (U.S. Brent oil fund) daily
BNO continues to give up the sharp gain garnered when the Saudi facilities were damaged. It may continue to do so for the foreseeable future if the market turns weak for a protracted period of time.

Summary
SPX has made a secondary high and may be just starting an important correction. If, as some EWT analysts believe, this is the beginning of wave 4 of the bull market which started in 2009, we are indeed looking at a correction which could last several months and take prices into the low 2000s. I don’t see any reason to challenge this analysis at this time, although it’s still early and we’ll need to give the index a chance to define its intentions a little more clearly.
FREE TRIAL SUBSCRIPTON
With a trial subscription, you will have access to the same information that is given to paid subscribers, but for a limited time period. I think you will find that knowing how far a move can carry is one of the most useful benefits of this service, whether you are a trader or an investor -- especially when this price target is confirmed by reliable indicators which give advance warning of a market top or bottom. Furthermore, cycle analysis adds the all- important time element to the above price projections. For a FREE 4-week trial, further subscription options, payment plans, and for general information, I encourage you to visit my website at www.marketurningpoints.com.
The above comments about the financial markets are based purely on what I consider to be sound technical analysis principles. They represent my own opinion and are not meant to be construed as trading or investment advice, but are offered as an analytical point of view which might be of interest to those who follow stock market cycles and technical analysis.
********

When Andre Gratian was a stock broker years ago, a friend introduced him to technical analysis of the market. Consequently, it is not an exaggeration to say that Andre fell in love with this approach! Ever since then, it has become an increasingly important part of his professional life. Gratian has studied the works of Wyckoff, Edwards & Magee, Edward J. Dewey (cycles) and many others. However, one of my most profitable undertaking has probably been to study Point & Figure charting, which he finds invaluable in analyzing stocks and indices. If he were restricted to one methodology, this is the one that he would choose. This well-rounded background has given him what he feels to be a special insight into the stock market, facilitating the recognition of meaningful patterns and the ‘turning points’ in all trends, whether they be short or long term. Andre feels very comfortable discussing the stock market and passing on meaningful information to others. His subscribers include individuals and money managers throughout the world. Moreover, his Newsletters are currently published on several financial sites, here and abroad.


