Technical Analysis Of The Markets


Gold
Short-Term Update
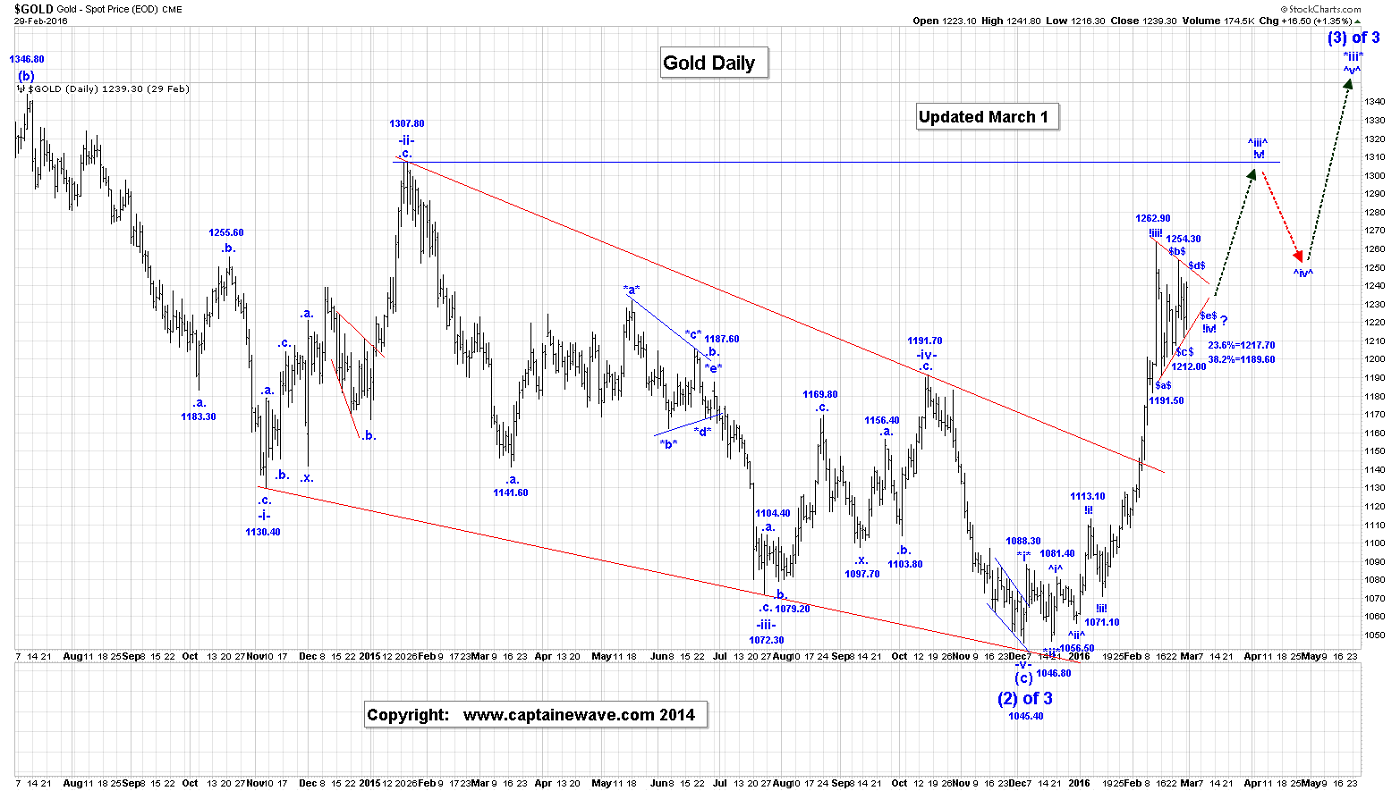
Gold reached a high of 1249.30, at the time that this Post was being written, which is about our target for the end of wave $d$.
We suggested in yesterday’s Posts that a run to the 1248.00 area seemed reasonable for a possible end to wave $d$.
If wave $d$ is now complete at the 1249.30 high, we should now expect a wave $e$ drop. Should gold continue to rally from here, above the wave $b$ high of 1254.20, now, then it is either possible that wave $b$ is still underway, which would indicate an expanding wave !iv! triangle or our wave !iv! triangle ended at 1201.40, and gold is about to burst sharply higher.
For now our preferred is the current wave !iv! triangle formation. Upon completion of wave !iv! we expect a sharp wave !iv! thrust, and that has a minimum target of 1263.40, but likely a run to the 1308 level, to complete just wave ^iii^.
The idea that wave $c$ could still be underway is eliminated now.
$a$ = 1191.80;
$b$ = 1254.20;
$c$ =1212.00;
$d$ =1249.30, if complete and cannot trade above the wave $b$ high of 1254.20
$e$ drop is next to complete, all of the wave !iv! triangle, and cannot drop below the wave $c$ low of 1212.00.
Our initial count for wave (3) of 3 is as follows:
*i* = 1088.30
*ii* = 1046.80;
*iii*:
^i^ = 1081.40;
^ii^ = 1056.60;
^iii^:
!i! = 1113.10;
!ii! = 1071.10;
!iii! =1263.40, 1262.90(Daily Continuous Futures);
!iv! triangle is still underway.
!v! rally is next and should reach the 1307.80 level to complete all of wave ^iii^.
Projection for the end of wave *iii* is:
*iii* = 6.25*i* = 1314.90.
Long-Term Update
Based on the current count, gold is still working on its first impulsive sequence out of its wave (2) of 3 low, and we still have a long way to go before this sequence is complete.
We are still working on our wave !iv! triangle and upon its completion we expect a very sharp thrust higher in wave !v!, as the next be the next big event.
Active Trading Positions: Long 20 positions, with puts at 1085.00!
Crude
Short-Term Update:
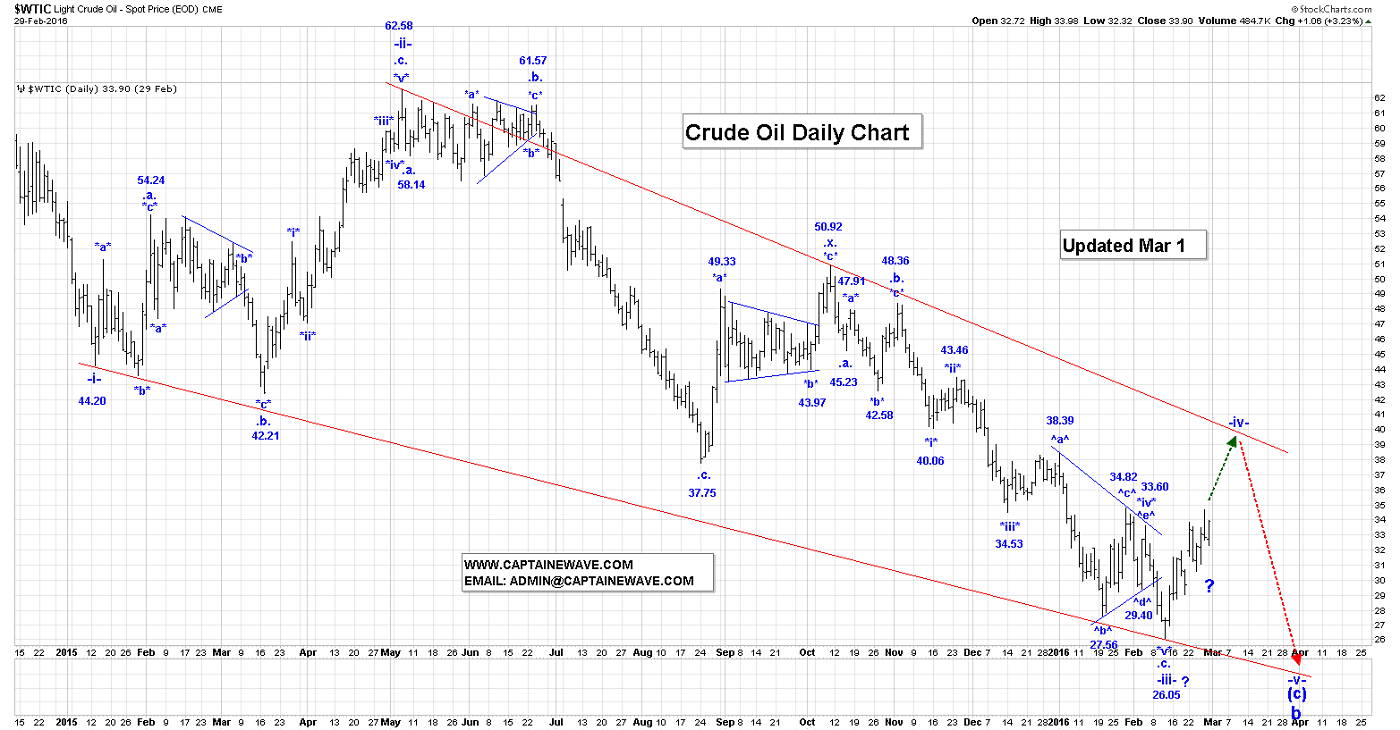
Crude continued to each higher in the overnight session reaching 34.42, at the time that this Post was being written.
On the Intraday Chart it looks like the rally out of the 32.34 low to the current high of 33.95 is impulsive which suggests that in the short term we should expect this market to rally above the 34.66 high.
Although we are still now sure of the make-up of the internal corrective wave structure of wave -iv-, we are expecting this overlapping , choppy type rally to continue and would not be surprised to see crude challenge the previous high at 38.39, before we see a sizable correction, all still within wave -iv.
No change to our current thinking around Suncor as we are waiting for beginning of our drop in wave (iii). We have satisfied all of the minimum requirements for a completed wave (ii).
Long-Term Update
Wave -iii- is complete at the 26.05 low and we should now be rallying in wave -iv-, as the next big event in the market.
Active Trading Positions: We are short Suncor at 24.75, risking to 27.00, and will also go long Suncor at 13.00!
S&P500
Short-Term Update:
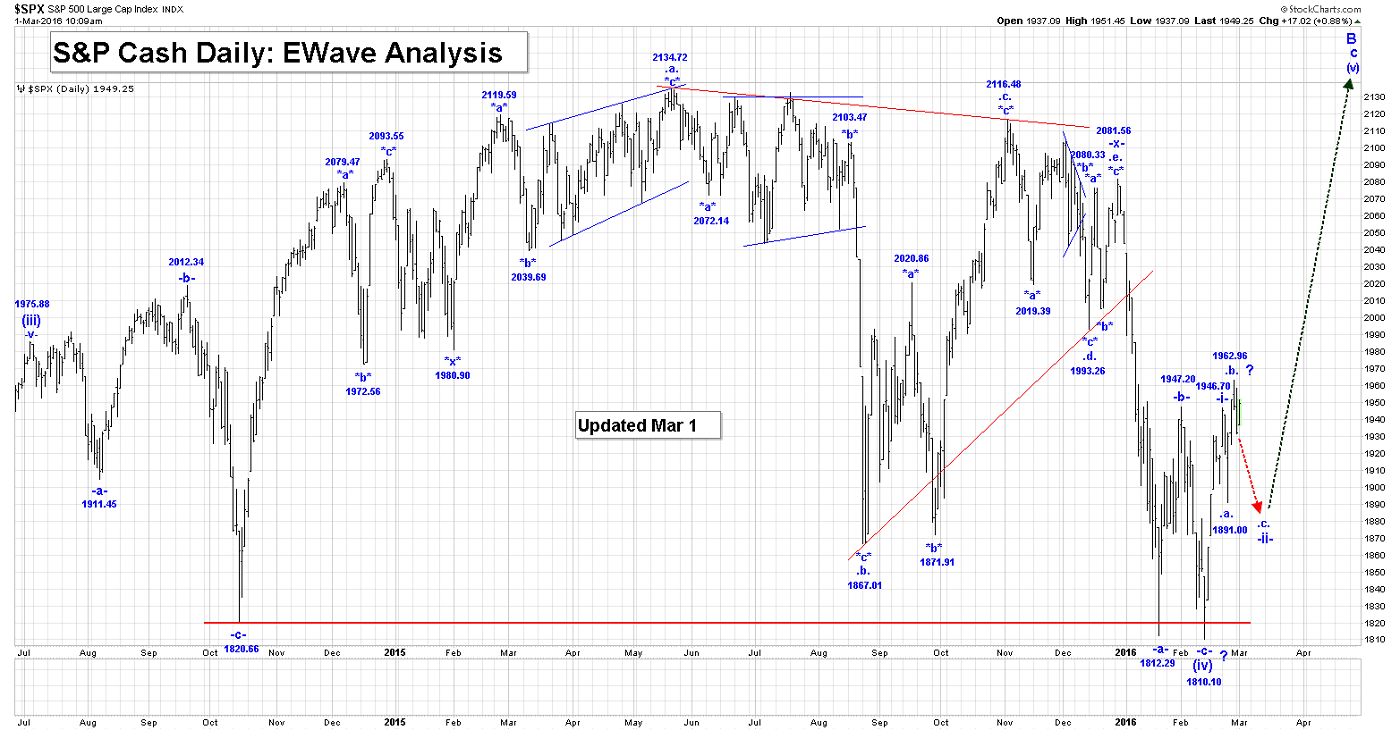
The S&P Futures are up about 16 points, in the overnight session, at the time that this Post as being written.
If our current analysis is correct, we are still expecting a final drop in wave .c. to complete all of wave -ii-.
Our minimum target for wave .c. is the wave .a. low of 1891.00, but our retracement levels for wave -ii- remain unchanged as, which suggests that wave .c. should end well below the 1891.00 low:
50% = 1878.40;
61.8% = 1862.28.
We cannot rally much higher, before we will need to conclude that wave -ii- ended at 1891.00. The bulls need to be very concerned if this rally from our current wave (iv) turns into only a 3 wave rally.
We will monitor this outcome and if this happens, we will be aggressively short this market at a location that we will share based on how the S&P trades in the days ahead.
Long-Term Update
If the S&P breaks below the 1810.10 lows then a major top in the S&P has occurred somewhere as a failure top in the 2100/2140 area. Wave -i- of (v) is complete at the 1946.70 high, and if that observation is correct, then the next big event in this market will be a wave
-ii- correction, that retraces between 50 to 61.8% of the entire wave -i- rally.
Active Trading Positions: Flat!
USDX
Short-Term Update
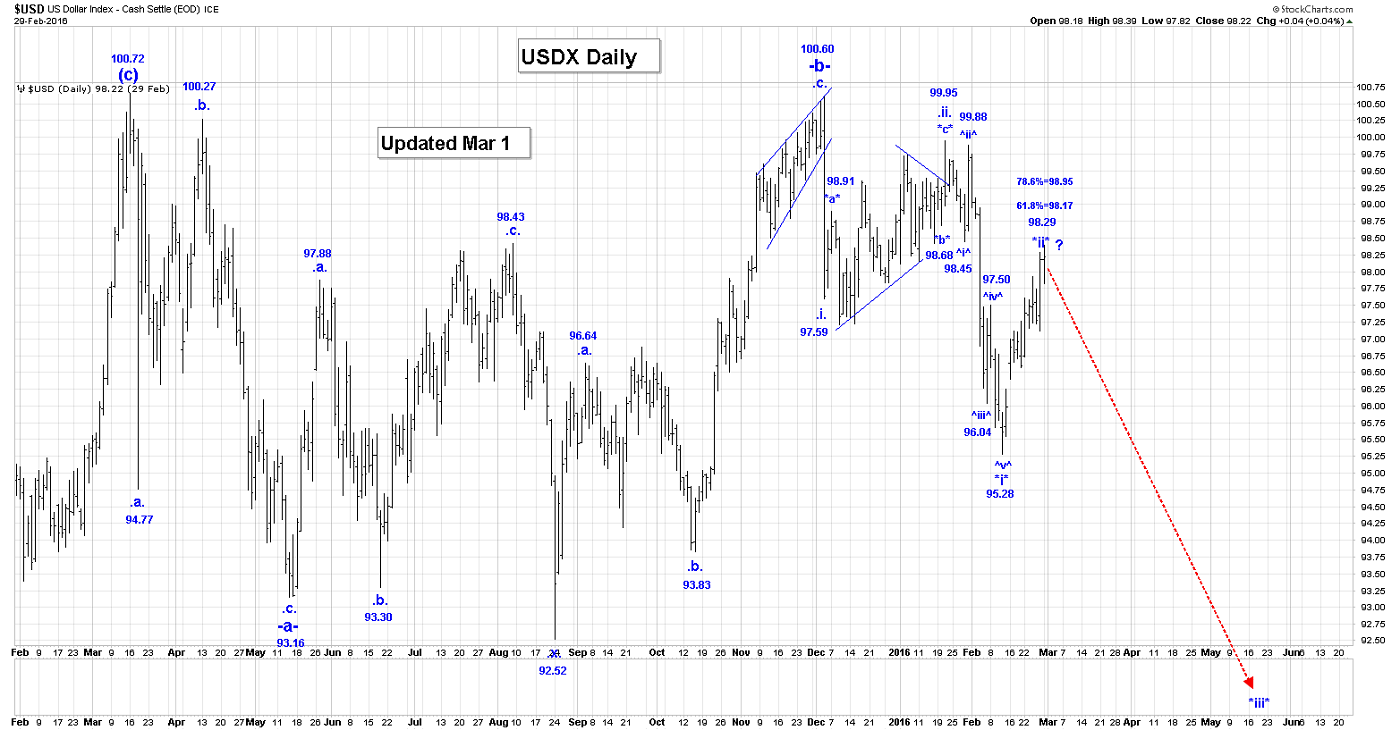
If our analysis in the USDX is correct, then the next big event will be a sharp drop in wave *iii* of .iii.. This sharp drop would coincide with our thinking that gold is due for a sharp thrust higher. Let’s see if events unfold as we suggest they might!
The USDX did not move very much in the overnight session, as the current high for wave *ii* remains 98.39.
We are still working on the idea that we are rallying in wave *ii* of .iii. Only a break of our 78.6% retracement level would suggest that something else is happening in this market.
We are now waiting for a signal that all of wave *ii* is complete at the current levels.
The next big event in this market should a sharp drop in wave *iii* of .iii..
Our retracement levels for all of wave *ii* are:
61.8% = 98.17.
78.6% = 98.95.
Our current count for wave -c- is:
.i. = 97.59;
.ii. = 99.95
.iii.:
*i*:
^i^ = 98.45;
^ii^ = 99.88;
^iii^ = 96.04;
^iv^ = 97.50:
^v^ = 95.28, to complete all of wave *i*;
*ii* = 98.39, if complete;
*iii* drop has now begun.
We have the following projections of all of the wave .iii. drop:
.iii. = 1.618.i. = 94.53;
.iii. -= 2.618.i. = 91.18;
.iii. = 4.236 i = 85.76.
Long-Term Trading Update
We should be falling sharply in wave .iii. in the next couple of weeks or months. Within wave .iii., we are now falling in wave *iii*, with wave *ii* ending at 97.92.
Active Trading Positions: We are short at 97.90, risking to 99.89!
NATGAS
Short-Term Update

NG had a low of 1.695, in the overnight session, before moving higher. At the time of this Post it is sitting at about the 1.742 level. We need to see a sharp rally higher to confirm that our current count remains valid and all of wave -b- has finally ended at the 1.690 low.
This rally would then be our long anticipated wave -c-, that would have minimum target of 2.294, which is the wave -a- high. A drop now below the 1.68 level will eliminate our current count.
Long-Term Trading Update
Our retracement levels for all of wave (iv):
38.2% = 2.91;
50% = 3.29.
For the time being we will assume that wave (iv) is a simple -a-, -b-, -c- pattern, and within that count we have:
-a- = 2.494;
-b- = 1.695, if complete;
-c- rally would be next and should rally to at least the wave -a- high, but more likely to our 38.2%/50% retracement zone shown above.
Active Trading Positions: We are long risking to 1.67!
HUI/GDX and Selected Gold Stocks
Short-Term Update:
With gold being higher, we expect the GDX and our selected stocks to likely to coniute to move higher, at least until wave $e$ is gold begins.
In terms of the GDX, we have attached the 60 Min GDX Chart.
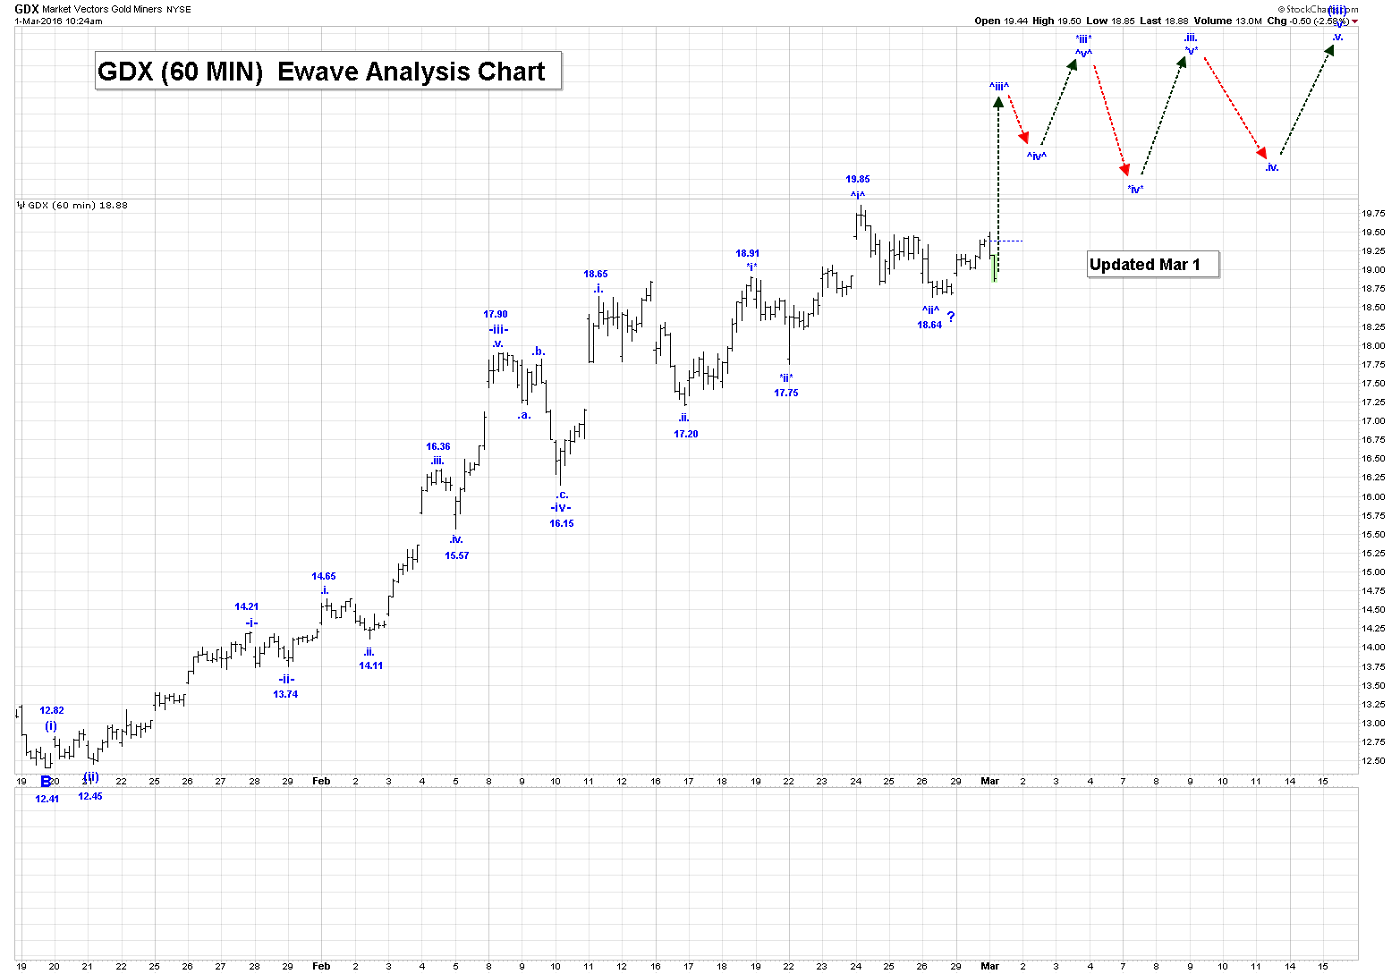
The GDX was higher today. It looks like wave ^ii^ of *iii* ended at 18.64, and we are now rallying in wave ^iii^ of *iii*.
On the Intraday Chart, the rallies are impulsive and the setbacks are corrective, and until that changes we expect much higher prices ahead for this market.
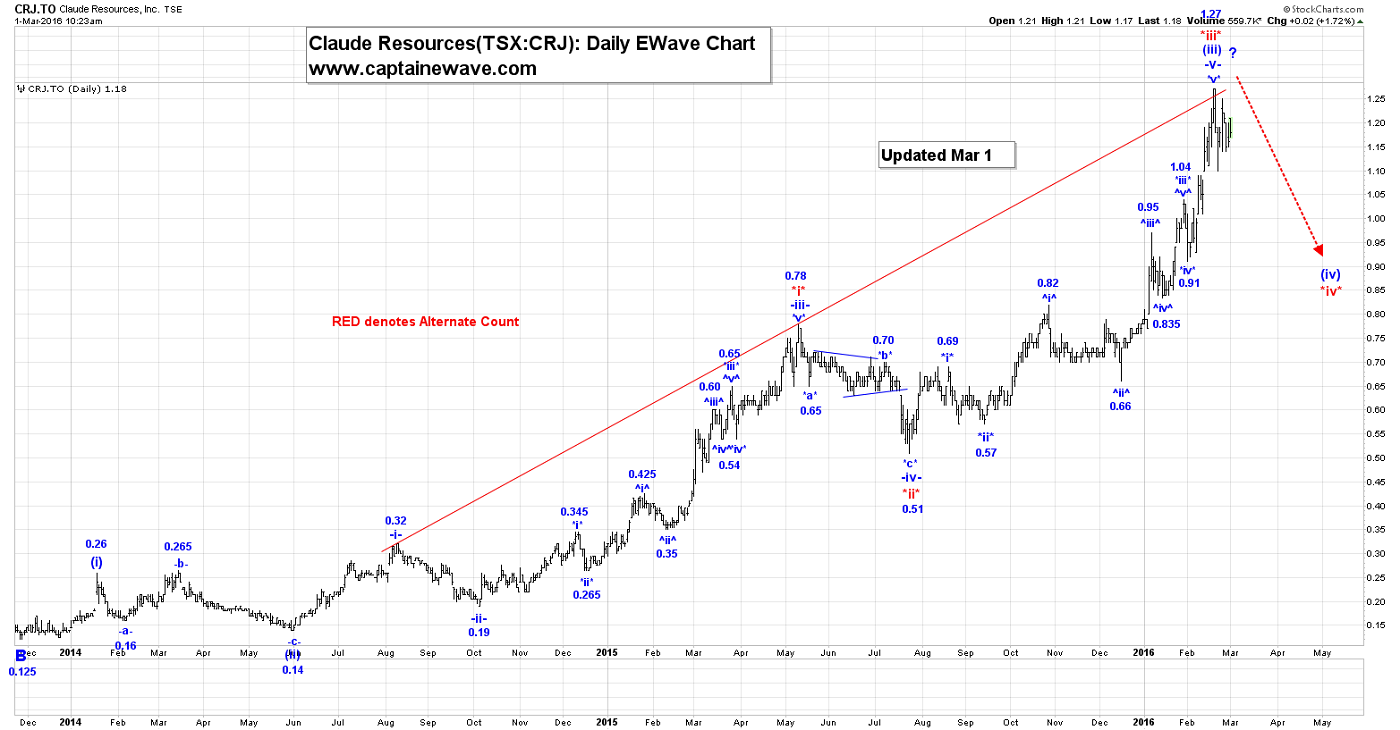
In terms of CRJ, nothing much happened, but we still think that we are still in wave (iii). We are looking at a final top in wave (iii) in the 1.40/1.50 level.

In terms of ABX, we have attached the 120 Min ABX Chart. ABX moved higher today, as we are working on the assumption that all of wave ^iv^ is complete at the 13.03 low, and that we are now rallying in wave ^v^.
As an alternate, wave ^iv^ could become more complex, and in that case we would revisit the 13.03 low one more time.
Our current count is:
.i. =12.66;
.ii. = 11.49. Note that wave .ii. did retrace at least 50% of the wave .i. rally, with the 61.8% level being 11.41.
.iii.:
^i^ =12.94;
^ii^ = 12.12;
^iii^= 14.45;
^iv^ = 13.03, if complete;
^v^ is now underway to complete all of wave .iii.
Long-Term Update
The HUI, Long Term XAU, Long Term Kinross and Long Term ABX Charts, have all broken major down trend lines, which is technically signaling a major change in direction.
All of the major gold stocks/indices have finally completed their respective wave B lows.
Active Trading Positions: We are long the GDX, ABX, KGC, NEM, CRJ, and TSX:XGD with no stops!
********
Email: [email protected]
Website: www.captainewave.com
Risk: CAPTAINEWAVE.COM IS AN IMPERSONAL ADVISORY SERVICE. AND THEREFORE, NO CONSIDERATION CAN OR IS MADE TOWARD YOUR FINANCIAL CIRCUMSTANCES. ALL MATERIAL PRESENTED WITHIN CAPTAINEWAVE.COM IS NOT TO BE REGARDED AS INVESTMENT ADVICE, BUT FOR GENERAL INFORMATIONAL PURPOSES ONLY. TRADING STOCKS DOES INVOLVE RISK, SO CAUTION MUST ALWAYS BE UTILIZED. WE CANNOT GUARANTEE PROFITS OR FREEDOM FROM LOSS. YOU ASSUME THE ENTIRE COST AND RISK OF ANY TRADING YOU CHOOSE TO UNDERTAKE. YOU ALSO AGREE TO BEAR COMPLETE RESPONSIBILITY FOR YOUR INVESTMENT RESEARCH AND DECISIONS AND ACKNOWLEDGE THAT CAPTAINEWAVE.COM HAS NOT AND WILL NOT MAKE ANY SPECIFIC RECOMMENDATIONS OR GIVE ADVICE TO YOU OR ANY OF ITS CLIENTS UPON WHICH THEY SHOULD RELY. CAPTAINEWAVE.COM SUGGESTS THAT THE CLIENT/MEMBER TEST ALL INFORMATION AND TRADING METHODOLOGIES PROVIDED AT OUR SITE THROUGH PAPER TRADING OR SOME OTHER FORM OF TESTING. CAPTAINEWAVE.COM, ITS OWNERS, OR ITS REPRESENTATIVES ARE NOT REGISTERED AS SECURITIES BROKER-DEALERS OR INVESTMENT ADVISORS EITHER WITH THE U.S. SECURITIES AND EXCHANGE COMMISSION OR WITH ANY STATE SECURITIES REGULATORY AUTHORITY. WE RECOMMEND CONSULTING WITH A REGISTERED INVESTMENT ADVISOR, BROKER-DEALER, AND/OR FINANCIAL ADVISOR. IF YOU CHOOSE TO INVEST WITH OR WITHOUT SEEKING ADVICE FROM SUCH AN ADVISOR OR ENTITY, THEN ANY CONSEQUENCES RESULTING FROM YOUR INVESTMENTS ARE YOUR SOLE RESPONSIBILITY.
ALL INFORMATION POSTED IS BELIEVED TO COME FROM RELIABLE SOURCES. CAPTAINEWAVE.COM DOES NOT WARRANT THE ACCURACY, CORRECTNESS, OR COMPLETENESS OF INFORMATION AVAILABLE FROM ITS SERVICE AND THEREFORE WILL NOT BE LIABLE FOR ANY LOSS INCURRED. DUE TO THE ELECTRONIC NATURE OF THE INTERNET, THE CAPTAINEWAVE.COM WEBSITE, ITS E-MAIL & DISTRIBUTION SERVICES AND ANY OTHER SUCH "ALERTS" COULD FAIL AT ANY GIVEN TIME. CAPTAINEWAVE.COM WILL NOT BE RESPONSIBLE FOR UNAVAILABILITY OF USE OF ITS WEBSITE, NOR UNDELIVERED E-MAILS, OR "ALERTS" DUE TO INTERNET BANDWIDTH PROBLEMS, EQUIPMENT FAILURE, OR ACTS OF GOD. CAPTAINEWAVE.COM DOES NOT WARRANT THAT THE TRANSMISSION OF E-MAILS, OR ANY "ALERT" WILL BE UNINTERRUPTED OR ERROR-FREE. CAPTAINEWAVE.COM WILL NOT BE LIABLE FOR THE ACTS OR OMISSIONS OF ANY THIRD PARTY WITH REGARDS TO CAPTAINEWAVE.COM DELAY OR NON-DELIVERY OF THE CAPTAINEWAVE.COM NIGHTLY EMAILS OR "ALERTS". FURTHER, WE DO NOT RECEIVE ANY FORM OF PAYMENT OR OTHER COMPENSATION FOR PUBLISHING INFORMATION, NEWS, RESEARCH OR ANY OTHER MATERIAL CONCERNING ANY SECURITIES ON OUR SITE OR PUBLISH ANY INFORMATION ON OUR SITE THAT IS INTENDED TO AFFECT OR INFLUENCE THE VALUE OF SECURITIES.
THERE IS NO GUARANTEE PAST PERFORMANCE WILL BE INDICATIVE OF FUTURE RESULTS. NO ASSURANCE CAN BE GIVEN THAT THE RECOMMENDATIONS OF CAPTAINEWAVE.COM WILL BE PROFITABLE OR WILL NOT BE SUBJECT TO LOSSES. ALL CLIENTS SHOULD UNDERSTAND THAT THE RESULTS OF A PARTICULAR PERIOD WILL NOT NECESSARILY BE INDICATIVE OF RESULTS IN FUTURE PERIODS. THE RESULTS LISTED AT THIS WEBSITE ARE BASED ON HYPOTHETICAL TRADES. PLAINLY SPEAKING, THESE TRADES WERE NOT ACTUALLY EXECUTED. HYPOTHETICAL OR SIMULATED PERFORMANCE RESULTS HAVE CERTAIN INHERENT LIMITATIONS. UNLIKE AN ACTUAL PERFORMANCE RECORD, SIMULATED TRADES DO NOT REPRESENT ACTUAL TRADING. ALSO, SINCE THE TRADES HAVE NOT ACTUALLY BEEN EXECUTED, THE RESULTS MAY HAVE OVER OR UNDER COMPENSATED FOR THE IMPACT, IF ANY, OF CERTAIN MARKET FACTORS SUCH AS LACK OF LIQUIDITY. YOU MAY HAVE DONE BETTER OR WORSE THAN THE RESULTS PORTRAYED. NO REPRESENTATION IS BEING MADE THAT ANY ACCOUNT WILL OR IS LIKELY TO ACHIEVE PROFITS OR LOSSES SIMILAR TO THOSE SHOWN. NO INDEPENDENT PARTY HAS AUDITED THE HYPOTHETICAL PERFORMANCE CONTAINED AT THIS WEBSITE, NOR HAS ANY INDEPENDENT PARTY UNDERTAKEN TO CONFIRM THAT THEY REFLECT THE TRADING METHOD UNDER THE ASSUMPTIONS OR CONDITIONS SPECIFIED HEREAFTER. WHILE THE RESULTS PRESENTED AT THIS WEBSITE ARE BASED UPON CERTAIN ASSUMPTIONS BELIEVED TO REFLECT ACTUAL TRADING CONDITIONS, THESE ASSUMPTIONS MAY NOT INCLUDE ALL VARIABLES THAT WILL AFFECT, OR HAVE IN THE PAST AFFECTED, THE EXECUTION OF TRADES INDICATED BY CAPTAINEWAVE.COM. THE HYPOTHETICAL RESULTS ON THIS WEBSITE ARE BASED ON THE ASSUMPTION THAT THE CLIENT BUY AND SELLS THE POSITIONS AT THE OPEN PRICE OF THE STOCK. THE SIMULATION ASSUMES PURCHASE AND SALE PRICES BELIEVED TO BE ATTAINABLE. IN ACTUAL TRADING, PRICES RECEIVED MAY OR MAY NOT BE THE SAME AS THE ASSUMED ORDER PRICES.


